Don Valley West
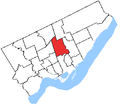
.png) Don Valley West in relation to other electoral districts in Toronto (2015 boundaries) | |||
| Federal electoral district | |||
| Legislature | House of Commons | ||
| MP |
| ||
| District created | 1976 | ||
| First contested | 1979 | ||
| Last contested | 2015 | ||
| District webpage | profile, map | ||
| Demographics | |||
| Population (2011)[1] | 99,820 | ||
| Electors (2015) | 69,333 | ||
| Area (km²)[2] | 32 | ||
| Pop. density (per km²) | 3,119.4 | ||
| Census divisions | Toronto | ||
| Census subdivisions | Toronto | ||
.gif)
Don Valley West (French: Don Valley-Ouest) is a federal electoral district in Ontario, Canada, that has been represented in the House of Commons of Canada since 1979. Its population in 2001 was 115,539. 13.6% of the population is Muslim, the highest in Canada.
Its most high-profile MP has been John Bosley, who was Speaker of the House 1984-86.
Demographics
Ethnic groups: 60.3% White, 14.3% South Asian, 8.6% Chinese, 4.6% Filipino, 4.0% Black, 3.0% West Asian, 1.4% Korean
Languages: 57.2% English, 1.3% French, 39.3% Other, 2.2% Multiple responses
Religions: 27.8% Protestant, 20.0% Catholic, 5.5% Christian Orthodox, 2.7% Other Christian; 13.6% Muslim, 8.2% Jewish, 3.7% Hindu, 1.2% Buddhist, 16.5% No affiliation
Average income: $57,558
Don Valley West has the highest proportion of Muslims (13.6%) of any Canadian federal riding.[3][4]
Geography
The district includes the neighbourhoods of York Mills, Silver Hills, the western half of Don Mills, the eastern half of Lawrence Park, Leaside, Thorncliffe Park and Flemingdon Park in the City of Toronto. The area is 37 km².
History
The federal electoral district was created in 1976 from Don Valley riding.
John Godfrey, who had represented the riding since 1993, announced in November 2007 that he would be resigning his seat on July 1, 2008 in order to accept a position as headmaster of Toronto French School and would leave earlier if an election were called before that date. Godfrey subsequently postponed his resignation until August 1.[5]
On August 17, 2008, the Prime Minister's Office issued a press release on behalf of Prime Minister Stephen Harper announcing a by-election for Don Valley West on September 22, 2008.[6] The by-election was canceled with the announcement of the federal election to held on October 14, 2008.
This riding lost significant territory to Don Valley East and gained territory from St. Paul's during the 2012 electoral redistribution.
Former boundaries
-
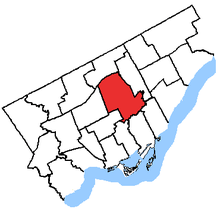
1976 to 1987
-
1987 to 1996
-
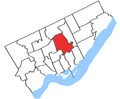
1996 to 2003
-
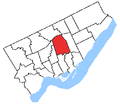
2003 to 2015
Members of Parliament
This riding has elected the following Members of Parliament:
| Parliament | Years | Member | Party | |
|---|---|---|---|---|
| Don Valley West Riding created from Don Valley |
||||
| 31st | 1979–1980 | John Bosley | Progressive Conservative | |
| 32nd | 1980–1984 | |||
| 33rd | 1984–1988 | |||
| 34th | 1988–1993 | |||
| 35th | 1993–1997 | John Godfrey | Liberal | |
| 36th | 1997–2000 | |||
| 37th | 2000–2004 | |||
| 38th | 2004–2006 | |||
| 39th | 2006–2008 | |||
| 40th | 2008–2011 | Rob Oliphant | ||
| 41st | 2011–2015 | John Carmichael | Conservative | |
| 42nd | 2015–Present | Rob Oliphant | Liberal | |
Election results
| Canadian federal election, 2015 | ||||||||
|---|---|---|---|---|---|---|---|---|
| Party | Candidate | Votes | % | ∆% | Expenditures | |||
| Liberal | Rob Oliphant | 27,472 | 53.78 | +12.29 | – | |||
| Conservative | John Carmichael | 19,206 | 37.60 | -6.29 | – | |||
| New Democratic | Syeda Riaz | 3,076 | 6.02 | -4.73 | – | |||
| Green | Natalie Hunt | 848 | 1.66 | -1.91 | – | |||
| Libertarian | John Kittredge | 325 | 0.64 | – | – | |||
| Communist | Elizabeth Hill | 84 | 0.16 | – | ||||
| Independent | Sharon Cromwell | 75 | 0.15 | – | – | |||
| Total valid votes/Expense limit | 51,086 | 100.00 | $202,821.40 | |||||
| Total rejected ballots | 217 | 0.42 | ||||||
| Turnout | 51,303 | 72.75 | ||||||
| Eligible voters | 70,524 | |||||||
| Liberal gain from Conservative | Swing | +9.29 | ||||||
| Source: Elections Canada[7][8] | ||||||||
| 2011 federal election redistributed results[9] | |||
|---|---|---|---|
| Party | Vote | % | |
| Conservative | 19,893 | 43.89 | |
| Liberal | 18,805 | 41.49 | |
| New Democratic | 4,871 | 10.75 | |
| Green | 1,616 | 3.57 | |
| Others | 140 | 0.31 | |
| Canadian federal election, 2011 | ||||||||
|---|---|---|---|---|---|---|---|---|
| Party | Candidate | Votes | % | ∆% | Expenditures | |||
| Conservative | John Carmichael | 22,962 | 42.93 | +4.11 | – | |||
| Liberal | Rob Oliphant | 22,351 | 41.79 | -2.57 | – | |||
| New Democratic | Nicole Yovanoff | 6,280 | 11.74 | +1.55 | – | |||
| Green | Georgina Wilcock | 1,703 | 3.18 | -3.12 | – | |||
| Communist | Dimitris Kabitsis | 186 | 0.35 | +0.02 | – | |||
| Total valid votes | 53,482 | 100.00 | – | |||||
| Total rejected ballots | 176 | 0.33 | – | |||||
| Turnout | 53,658 | 66.84 | – | |||||
| Eligible voters | 80,276 | – | – | |||||
| Conservative gain from Liberal | Swing | +3.34 | ||||||
| Canadian federal election, 2008 | ||||||||
|---|---|---|---|---|---|---|---|---|
| Party | Candidate | Votes | % | ∆% | Expenditures | |||
| Liberal | Rob Oliphant | 22,212 | 44.36 | -9.2 | $60,129 | |||
| Conservative | John Carmichael | 19,441 | 38.83 | +5.6 | $82,633 | |||
| New Democratic | David Sparrow | 5,102 | 10.19 | +1.1 | $67,984 | |||
| Green | Georgina Wilcock | 3,155 | 6.30 | +2.8 | $10,725 | |||
| Communist | Catherine Holliday | 162 | 0.32 | – | ||||
| Total valid votes/Expense limit | 50,072 | 100.00 | $85,470 | |||||
| Total rejected ballots | – | |||||||
| Turnout | – | 62.8 | ||||||
| Liberal hold | Swing | -7.4 | ||||||
| Canadian federal election, 2006 | ||||||||
|---|---|---|---|---|---|---|---|---|
| Party | Candidate | Votes | % | ∆% | ||||
| Liberal | John Godfrey | 28,709 | 53.4 | -6.4 | ||||
| Conservative | John Carmichael | 17,908 | 33.3 | +5.0 | ||||
| New Democratic | David Thomas | 4,902 | 9.1 | +0.5 | ||||
| Green | Daphne So | 1,906 | 3.5 | +0.2 | ||||
| Libertarian | Soumen Deb | 226 | 0.4 | |||||
| Canadian Action | Paul Barnes | 151 | 0.3 | |||||
| Total valid votes | 53,802 | 100.0 | ||||||
| Canadian federal election, 2004 | ||||||||
|---|---|---|---|---|---|---|---|---|
| Party | Candidate | Votes | % | ∆% | ||||
| Liberal | John Godfrey | 30,615 | 59.8 | +4.4 | ||||
| Conservative | David Turnbull | 14,495 | 28.3 | -10.7 | ||||
| New Democratic | David Thomas | 4,393 | 8.6 | +4.2 | ||||
| Green | Serge Abbat | 1,703 | 3.3 | |||||
| Total valid votes | 51,206 | 100.0 | ||||||
Note: Conservative vote is compared to the total of the Canadian Alliance vote and Progressive Conservative vote in 2000 election.
| Canadian federal election, 2000 | ||||||||
|---|---|---|---|---|---|---|---|---|
| Party | Candidate | Votes | % | ∆% | ||||
| Liberal | John Godfrey | 25,329 | 55.4 | +2.4 | ||||
| Progressive Conservative | Michael Murton | 10,583 | 23.1 | -7.3 | ||||
| Alliance | John Wakelin | 7,239 | 15.8 | +6.4 | ||||
| New Democratic | Ali Naqvi | 2,024 | 4.4 | -1.5 | ||||
| Marijuana | Greg Stock | 469 | 1.0 | |||||
| Marxist–Leninist | Fernand Deschamps | 97 | 0.2 | 0.0 | ||||
| Total valid votes | 45,741 | 100.0 | ||||||
Note: Canadian Alliance vote is compared to the Reform vote in 1997 election.
| Canadian federal election, 1997 | ||||||||
|---|---|---|---|---|---|---|---|---|
| Party | Candidate | Votes | % | ∆% | ||||
| Liberal | John Godfrey | 26,209 | 52.9 | +3.3 | ||||
| Progressive Conservative | Joanne Flint | 15,046 | 30.4 | +1.4 | ||||
| Reform | Jonathan Silbert | 4,669 | 9.4 | -5.7 | ||||
| New Democratic | Richard Tiller | 2,922 | 5.9 | +3.2 | ||||
| Green | Dan King | 378 | 0.8 | +0.2 | ||||
| Natural Law | Debbie Webberg | 173 | 0.3 | -0.2 | ||||
| Marxist–Leninist | Judith A. Snow | 104 | 0.2 | |||||
| Total valid votes | 49,501 | 100.0 | ||||||
| Canadian federal election, 1993 | ||||||||
|---|---|---|---|---|---|---|---|---|
| Party | Candidate | Votes | % | ∆% | ||||
| Liberal | John Godfrey | 25,756 | 49.7 | +12.9 | ||||
| Progressive Conservative | John Bosley | 15,023 | 29.0 | -24.4 | ||||
| Reform | Julian Pope | 7,872 | 15.2 | |||||
| New Democratic | Leonard Swartz | 1,410 | 2.7 | -5.6 | ||||
| National | Dorothy Campbell | 1,111 | 2.1 | |||||
| Green | Dan King | 302 | 0.6 | |||||
| Natural Law | Bob Pepper | 262 | 0.5 | |||||
| Independent | Judith A. Snow | 91 | 0.2 | |||||
| Abolitionist | Stephen Wilson | 26 | 0.1 | |||||
| Total valid votes | 51,853 | 100.0 | ||||||
| Canadian federal election, 1988 | ||||||||
|---|---|---|---|---|---|---|---|---|
| Party | Candidate | Votes | % | ∆% | ||||
| Progressive Conservative | John Bosley | 27,683 | 53.3 | -6.6 | ||||
| Liberal | Liz Yorke | 19,097 | 36.8 | +11.0 | ||||
| New Democratic | Ian Cameron | 4,307 | 8.3 | -4.9 | ||||
| Libertarian | Clarke Slemon | 408 | 0.8 | -0.4 | ||||
| Independent | J. Michael McCutcheon | 292 | 0.6 | |||||
| Communist | Chris Frazer | 73 | 0.1 | |||||
| Commonwealth of Canada | Peter Hetherington | 36 | 0.1 | |||||
| Total valid votes | 51,896 | 100.0 | ||||||
| Canadian federal election, 1984 | ||||||||
|---|---|---|---|---|---|---|---|---|
| Party | Candidate | Votes | % | ∆% | ||||
| Progressive Conservative | John Bosley | 29,905 | 59.9 | +8.2 | ||||
| Liberal | David Wishart | 12,855 | 25.8 | -12.0 | ||||
| New Democratic | Ian Cameron | 6,570 | 13.2 | +3.5 | ||||
| Libertarian | Michael Beech | 577 | 1.2 | +0.4 | ||||
| Total valid votes | 49,907 | 100.0 | ||||||
| Canadian federal election, 1980 | ||||||||
|---|---|---|---|---|---|---|---|---|
| Party | Candidate | Votes | % | ∆% | ||||
| Progressive Conservative | John Bosley | 25,260 | 51.8 | -2.3 | ||||
| Liberal | Frank Felkai | 18,430 | 37.8 | +3.3 | ||||
| New Democratic | Jonathan Lomas | 4,702 | 9.6 | -1.0 | ||||
| Libertarian | Scott Bell | 365 | 0.7 | 0.0 | ||||
| Marxist–Leninist | Ian Hyman | 42 | 0.1 | 0.0 | ||||
| Total valid votes | 48,799 | 100.0 | ||||||
| Canadian federal election, 1979 | ||||||||
|---|---|---|---|---|---|---|---|---|
| Party | Candidate | Votes | % | |||||
| Progressive Conservative | John Bosley | 28,427 | 54.1 | |||||
| Liberal | Frank Felkai | 18,117 | 34.5 | |||||
| New Democratic | Jean Smith | 5,572 | 10.6 | |||||
| Libertarian | Scott Bell | 405 | 0.8 | |||||
| Marxist–Leninist | Ian Hyman | 34 | 0.1 | |||||
| Total valid votes | 52,555 | 100.0 | ||||||
See also
References
- "(Code 35017) Census Profile". 2011 census. Statistics Canada. 2012. Retrieved 2012-03-02.
Notes
- ↑ Statistics Canada
- ↑ Statistics Canada
- ↑ "Religion (13) and Age Groups (8) for Population, for Canada, Provinces, Territories and Federal Electoral Districts (2003 Representation Order), 2001 Census - 20% Sample Data". 2.statcan.gc.ca. Retrieved 2012-11-20.
- ↑ "2001 Census of Canada: Topic-based tabulations". 2.statcan.ca. 2012-07-04. Retrieved 2012-11-30.
- ↑ http://www.canada.com/calgaryherald/news/theeditorialpage/story.html?id=50c50192-df40-4124-ac57-a39f452338a9
- ↑ http://www.pm.gc.ca/eng/media.asp?category=1&id=2227
- ↑ Elections Canada – Confirmed candidates for Don Valley West, 30 September 2015
- ↑ Elections Canada – Preliminary Election Expenses Limits for Candidates
- ↑ Pundits' Guide to Canadian Elections
External links
- Federal riding history from the Library of Parliament
- 2015 Results from Elections Canada
- Campaign expense data from Elections Canada