Canadian federal election, 1974
| | |||||||||||||||||||||||||||||||||||||||||||||||||||||||||||||||||||||||||||||||||||||||||||||||||
| |||||||||||||||||||||||||||||||||||||||||||||||||||||||||||||||||||||||||||||||||||||||||||||||||
| |||||||||||||||||||||||||||||||||||||||||||||||||||||||||||||||||||||||||||||||||||||||||||||||||
|
| |||||||||||||||||||||||||||||||||||||||||||||||||||||||||||||||||||||||||||||||||||||||||||||||||
| |||||||||||||||||||||||||||||||||||||||||||||||||||||||||||||||||||||||||||||||||||||||||||||||||
_cropped.jpg)
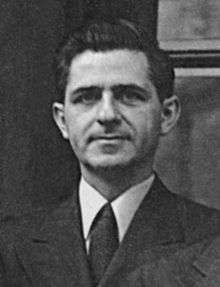


The Canadian federal election of 1974 was held on July 8, 1974 to elect members of the Canadian House of Commons of the 30th Parliament of Canada. The governing Liberal Party was reelected, going from a minority to a majority government, and gave Prime Minister Pierre Trudeau his third term. The Progressive Conservatives, led by Robert Stanfield, did well in the Atlantic provinces, and in the West, but the Liberal support in Ontario and Quebec ensured a majority Liberal government.
Overview
A key issue in the election was controlling spiralling inflation. Stanfield had proposed a "90-day wage and price freeze" to break the momentum of inflation. Trudeau had ridiculed this policy as an intrusion on the rights of businesses and employees to set or negotiate their own prices and wages with the catch-phrase, "Zap! You're frozen!" In 1975, Trudeau introduced his own wage and price control system under the auspices of the "Anti-Inflation Board".
The New Democratic Party, led by David Lewis, lost less than two-and-a-half percentage points in the popular vote, but almost half of their seats in the House of Commons.
The Social Credit Party of Canada, led by Réal Caouette, continued to lose ground, and fell to 11 seats, one short of the number required to be recognized as a party in the House of Commons (and therefore qualify for research funds and parliamentary committee memberships). This status was nonetheless extended to the party by the governing Liberals, who believed that Social Credit's support came primarily at the expense of the Tories.
One seat was won in New Brunswick by independent candidate Leonard Jones. Jones, the former mayor of Moncton, had secured the Progressive Conservative nomination, but PC leader Stanfield refused to sign Jones' nomination papers because he was a vocal opponent of official bilingualism, which the PC Party supported. Jones had opposed providing services in French in the City of Moncton even though 30% of the city's population was francophone. Jones ran and won as an independent. After the election, Social Credit leader Caouette invited Jones to join the Socred caucus, which would have given that party enough members for official status. Caouette justified the invitation on the basis that Jones agreed with providing bilingual education at the primary school level. Jones declined Caouette's invitation, and sat as an independent.
National results

| ↓ | ||||
| 141 | 95 | 16 | 11 | 1 |
| Liberal | Progressive Conservative | NDP | SC | O |
| Party | Party leader | # of candidates |
Seats | Popular vote | ||||||
|---|---|---|---|---|---|---|---|---|---|---|
| 1972 | Dissolution | Elected | % Change | # | % | Change | ||||
| Liberal | Pierre Trudeau | 264 | 109 | 109 | 141 | +29.4% | 4,102,853 | 43.15% | +4.73pp | |
| Progressive Conservative | Robert Stanfield | 264 | 107 | 106 | 95 | -11.2% | 3,371,319 | 35.46% | +0.44pp | |
| New Democratic Party | David Lewis | 262 | 31 | 31 | 16 | -48.4% | 1,467,748 | 15.44% | -2.40pp | |
| Social Credit | Real Caouette | 152 | 15 | 15 | 11 | -26.7% | 481,231 | 5.06% | -2.49pp | |
| Independent | 63 | 1 | - | 1 | - | 38,745 | 0.41% | -0.18pp | ||
| Unknown | 28 | - | - | - | - | 17,124 | 0.18% | -0.15pp | ||
| Marxist–Leninist | Hardial Bains | 104 | - | 16,261 | 0.17% | |||||
| Communist | William Kashtan | 69 | - | 12,100 | 0.13% | |||||
| No affiliation | 3 | 1 | 1 | - | -100% | 551 | 0.01% | -0.24pp | ||
| Vacant | 2 | |||||||||
| Total | 1,209 | 264 | 264 | 264 | - | 9,507,932 | 100% | |||
| Sources: http://www.elections.ca History of Federal Ridings since 1867 | ||||||||||
Note: "% change" refers to change from previous election
Vote and seat summaries
Results by province
| Party name | BC | AB | SK | MB | ON | QC | NB | NS | PE | NL | NT | YK | Total | ||
|---|---|---|---|---|---|---|---|---|---|---|---|---|---|---|---|
| Liberal | Seats: | 8 | - | 3 | 2 | 55 | 60 | 6 | 2 | 1 | 4 | - | - | 141 | |
| Popular Vote (%): | 33.8 | 24.8 | 30.7 | 27.4 | 45.1 | 54.1 | 47.2 | 40.7 | 46.2 | 46.7 | 24.7 | 33.5 | 43.2 | ||
| Progressive Conservative | Seats: | 13 | 19 | 8 | 9 | 25 | 3 | 3 | 8 | 3 | 3 | - | 1 | 95 | |
| Vote: | 41.9 | 61.2 | 36.4 | 47.7 | 35.1 | 21.2 | 33.0 | 47.5 | 49.1 | 43.6 | 33.2 | 47.1 | 35.5 | ||
| New Democratic Party | Seats: | 2 | - | 2 | 2 | 8 | - | - | 1 | - | - | 1 | - | 16 | |
| Vote: | 23.0 | 9.3 | 31.5 | 23.5 | 19.1 | 6.6 | 8.7 | 11.2 | 4.6 | 9.5 | 42.1 | 19.5 | 15.4 | ||
| Social Credit | Seats: | - | - | - | - | - | 11 | - | - | - | 11 | ||||
| Vote: | 1.2 | 3.4 | 1.1 | 1.1 | 0.2 | 17.1 | 2.9 | 0.4 | 0.1 | 5.1 | |||||
| Independent | Seats: | - | - | - | - | - | - | 1 | - | 1 | |||||
| Vote: | 0.1 | 0.2 | 0.1 | 0.1 | 0.1 | 0.3 | 8.1 | 0.1 | 0.4 | ||||||
| Total seats: | 23 | 19 | 13 | 13 | 88 | 74 | 10 | 11 | 4 | 7 | 1 | 1 | 264 | ||
| Parties that won no seats: | |||||||||||||||
| Unknown | Vote: | xx | 1.0. | 0.1 | 0.1 | 0.3 | 0.1 | 0.2 | |||||||
| Marxist–Leninist | Vote: | 0.1 | 0.1 | 0.1 | 0.1 | 0.1 | 0.4 | xx | 0.1 | 0.2 | |||||
| Communist | Vote: | 0.3 | 0.1 | 0.1 | 0.1 | 0.1 | 0.1 | 0.1 | |||||||
| No affiliation | Vote: | xx | xx | xx | |||||||||||
xx - less than 0.05% of the popular vote.
Notes
- Number of parties: 6
- First appearance: Marxist–Leninist Party of Canada
- Final appearance: none
See also
- List of Canadian federal general elections
- List of political parties in Canada
- 30th Canadian parliament
References
- ↑ Pomfret, R. "Voter Turnout at Federal Elections and Referendums". Elections Canada. Elections Canada. Retrieved 11 January 2014.