Canadian federal election, 1980
| | |||||||||||||||||||||||||||||||||||||||||||||||||||||||||||||||||||||||||||||||||||||||||||||||||
| |||||||||||||||||||||||||||||||||||||||||||||||||||||||||||||||||||||||||||||||||||||||||||||||||
| |||||||||||||||||||||||||||||||||||||||||||||||||||||||||||||||||||||||||||||||||||||||||||||||||
|
| |||||||||||||||||||||||||||||||||||||||||||||||||||||||||||||||||||||||||||||||||||||||||||||||||
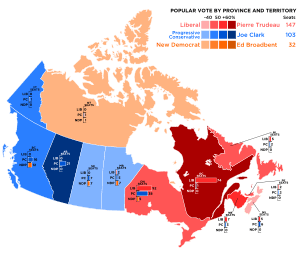
| Popular vote map showing seat totals by province | |||||||||||||||||||||||||||||||||||||||||||||||||||||||||||||||||||||||||||||||||||||||||||||||||
| |||||||||||||||||||||||||||||||||||||||||||||||||||||||||||||||||||||||||||||||||||||||||||||||||
_cropped.jpg)
The Canadian federal election of 1980 was held on February 18, 1980 to elect members of the Canadian House of Commons of the 32nd Parliament of Canada. It was called when the minority Progressive Conservative government led by Prime Minister Joe Clark was defeated in the Commons.
Clark and his government had been under attack for its perceived inexperience, for example, in its handling of its 1979 election campaign commitment to move Canada's embassy in Israel from Tel Aviv to Jerusalem. Clark had maintained uneasy relations with the fourth largest party in the House of Commons, Social Credit. While he needed the six votes that the conservative-populist Quebec-based party had in order to get legislation passed, he was unwilling to agree to the conditions they imposed for their support. Clark had managed to recruit one Social Credit MP, Richard Janelle, to join the PC caucus.
Clark's Minister of Finance, John Crosbie, introduced an austere government budget in late 1979 that proposed to increase the excise tax on gasoline by 18¢ per Imperial gallon (about 4¢ a litre) to reduce the federal government's deficit. The New Democratic Party's finance critic, Bob Rae, proposed a subamendment to the budget motion, stating that the House of Commons did not approve of the budget.[2] The five remaining Social Credit MPs abstained, upset that the revenues from the increased gas tax were not allocated to Quebec. In addition, one Tory MP was too ill to attend the vote while two others were stuck abroad on official business. Meanwhile, the Liberals assembled all but one member of their caucus, even going as far as to bring in several bedridden MPs by ambulance. Rae's subamendment was adopted by a vote of 139-133, bringing down the government and forcing a new election.
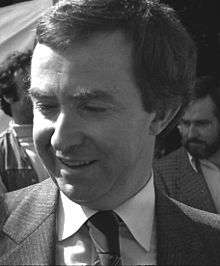
Former Liberal prime minister Pierre Trudeau had announced his resignation as leader of the Liberal Party following its defeat in 1979. However, no leadership convention had been held when the Progressive Conservative government fell. Trudeau quickly rescinded his resignation and led the party to victory, winning 34 more seats than in the 1979 federal election. This enabled the Liberals to form a strong majority government.
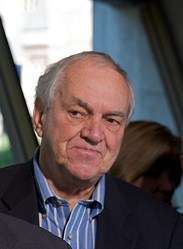
Clark's Tories campaigned under the slogan, "Real change deserves a fair chance", but the voters were unwilling to give Clark another chance. The loss of the budget vote just seven months into his mandate and his subsequent defeat in the February 18 general election would eventually result in his ouster as leader by Brian Mulroney three years later.
The Socreds' abstention on the crucial budget vote (while the Liberals and NDP voted to bring down the government) contributed to the growing perception that the party had become irrelevant following the death of iconic leader Réal Caouette. Social Credit lost all of its seats, never to return. The party rapidly declined into obscurity after this election, though it nominally continued to exist until 1993.
The new house was very regionally polarized. While the Liberals were shut out west of Manitoba, the Tories won only 14 seats east of Ontario (including only one in Quebec).
Voter turn-out was 69.3%.[3]
National results
| Party | Party leader | # of candidates |
Seats | Popular vote | ||||||
|---|---|---|---|---|---|---|---|---|---|---|
| 1979 | Dissolution | Elected | % Change | # | % | Change | ||||
| Liberal | Pierre Trudeau | 282 | 114 | 114 | 147 | +28.9% | 4,855,425 | 44.34% | +4.23pp | |
| Progressive Conservative | Joe Clark | 282 | 136 | 136 | 103 | -24.3% | 3,552,994 | 32.45% | -3.44pp | |
| New Democratic Party | Ed Broadbent | 280 | 26 | 27 | 32 | +23.1% | 2,165,087 | 19.77% | +1.89pp | |
| Social Credit | Fabien Roy | 81 | 6 | 5 | - | -100% | 185,486 | 1.70% | -2.91pp | |
| Rhinoceros | Cornelius I | 121 | - | - | - | 110,597 | 1.01% | +0.46pp | ||
| Marxist–Leninist | Hardial Bains | 177 | - | - | - | - | 14,728 | 0.13% | +0.01pp | |
| Libertarian | 58 | - | - | - | - | 14,656 | 0.13% | -0.01pp | ||
| Union populaire | 54 | - | - | - | - | 14,474 | 0.13% | -0.04pp | ||
| Independent | 55 | - | - | - | - | 14,472 | 0.13% | -0.13pp | ||
| Unknown | 41 | - | - | - | - | 12,532 | 0.11% | -0.07pp | ||
| Communist | William Kashtan | 52 | - | - | - | - | 6,022 | 0.05% | -0.02pp | |
| No affiliation | 14 | - | - | - | - | 3,063 | 0.03% | +0.03pp | ||
| Total | 1,497 | 282 | 282 | 282 | - | 10,949,536 | 100% | |||
|
Sources: http://www.elections.ca,History of Federal Ridings since 1867 | ||||||||||
Notes:
"% change" refers to change from previous election.
Changes to party standings from previous election: Social Credit MP Richard Janelle crossed the floor to join the PC Party. PC MP John Diefenbaker died during the parliamentary session. A New Democrat was elected in the subsequent by-election.
| ↓ | ||||
| 147 | 103 | 32 | ||
| Liberal | Progressive Conservative | NDP | ||
Vote and seat summaries
Results by province
| Party name | BC | AB | SK | MB | ON | QC | NB | NS | PE | NL | NT | YK | Total | ||
|---|---|---|---|---|---|---|---|---|---|---|---|---|---|---|---|
| Liberal | Seats: | - | - | - | 2 | 52 | 74 | 7 | 5 | 2 | 5 | - | - | 147 | |
| Popular Vote: | 22.2 | 22.2 | 24.3 | 28.0 | 41.9 | 68.2 | 50.1 | 39.9 | 46.8 | 47.0 | 35.8 | 39.6 | 44.3 | ||
| Progressive Conservative | Seats: | 16 | 21 | 7 | 5 | 38 | 1 | 3 | 6 | 2 | 2 | 1 | 1 | 103 | |
| Vote: | 41.5 | 64.9 | 38.9 | 37.7 | 35.5 | 12.6 | 32.5 | 38.7 | 46.3 | 36.0 | 24.7 | 40.6 | 32.4 | ||
| New Democratic Party | Seats: | 12 | - | 7 | 7 | 5 | - | - | - | - | - | 1 | - | 32 | |
| Vote: | 35.3 | 10.3 | 36.3 | 33.5 | 21.8 | 9.1 | 16.2 | 20.9 | 6.6 | 16.7 | 38.4 | 19.8 | 19.8 | ||
| Total seats: | 28 | 21 | 14 | 14 | 95 | 75 | 10 | 11 | 4 | 7 | 2 | 1 | 282 | ||
| Parties that won no seats: | |||||||||||||||
| Social Credit | Vote: | 0.1 | 1.0 | xx | xx | 5.9 | 1.7 | ||||||||
| Rhinoceros | Vote: | 0.4 | 0.7 | 0.1 | 0.4 | 0.2 | 3.0 | 0.5 | 0.2 | 1.1 | 1.0 | ||||
| Marxist–Leninist | Vote: | 0.1 | 0.1 | 0.1 | 0.2 | 0.1 | 0.2 | xx | xx | xx | 0.1 | 0.1 | |||
| Libertarian | Vote: | xx | 0.3 | 0.1 | xx | 0.1 | |||||||||
| Union populaire | Vote: | 0.5 | 0.1 | ||||||||||||
| Independent | Vote: | 0.3 | 0.3 | 0.1 | xx | 0.1 | 0.1 | 0.1 | 0.4 | 0.3 | 0.1 | 0.1 | |||
| Non-Affiliated | Vote: | xx | 0.5 | 0.2 | 0.1 | xx | 0.2 | 0.3 | 0.1 | 0.1 | |||||
| Communist | Vote: | 0.1 | 0.1 | xx | 0.1 | 0.1 | xx | 0.1 | |||||||
| No affiliation | Vote: | xx | 0.1 | 0.1 | xx | ||||||||||
xx - less than 0.05% of the popular vote.
Notes
- Number of parties: 9
- First appearance: none
- Final appearance: Union Populaire
- Final appearance before hiatus: Marxist–Leninist Party of Canada (returned in 1993)
See also
- List of Canadian federal general elections
- List of political parties in Canada
- 33rd Canadian Parliament
Articles on parties' candidates in this election:
- Independent
- Liberal
- Libertarian
- New Democrats
- Progressive Conservative
- Rhinoceros
References
- ↑ Pomfret, R. "Voter Turnout at Federal Elections and Referendums". Elections Canada. Elections Canada. Retrieved 11 January 2014.
- ↑ "House of Commons Journals, 31st Parliament, 1st Session". Canadian Parliamentary Historical Resources. Queen's Printer for Canada. 1979-12-13. Retrieved 2016-07-09.
Debate was resumed on the motion of Mr. Crosbie (St John's West), seconded by Mr. MacDonald (Egmont),-That this House approves in general the budgetary policy of the Government. And on the motion of Mr. Gray, seconded by Mr. Lalonde, in amendment thereto,-That all the words after the word 'That' be deleted and the following substituted therefor: 'this House condemns the Government for its budget which will place and unfair and unnecessary burden of higher gasoline prices, higher fuel oil prices, and higher taxes on middle and lower income Canadians.' And on the motion of Mr. Rae, seconded by Mr. Knowles, in amendment to the amendment,-That the amendment be amended by changing the period at the end thereof to a comma, and by adding immediately after the words: 'and this House unreservedly condemns the Government for its outright betrayal of election promises to lower interest rates, to cut taxes, and to stimulate the growth of the Canadian economy, without a mandate from the Canadian people for such a reversal.'
- ↑ Pomfret, R. "Voter Turnout at Federal Elections and Referendums". Elections Canada. Elections Canada. Retrieved 11 January 2014.