Elgin—Middlesex—London
For the provincial electoral district, see Elgin—Middlesex—London (provincial electoral district).
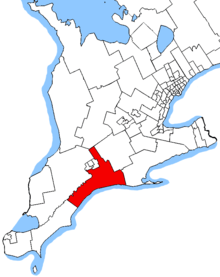 Elgin—Middlesex—London in relation to other southern Ontario electoral districts | |||
| Federal electoral district | |||
| Legislature | House of Commons | ||
| MP |
| ||
| District created | 1996 | ||
| First contested | 1997 | ||
| Last contested | 2015 | ||
| District webpage | profile, map | ||
| Demographics | |||
| Population (2011)[1] | 110,109 | ||
| Electors (2015) | 82,062 | ||
| Area (km²)[2] | 2,640 | ||
| Pop. density (per km²) | 41.7 | ||
| Census divisions | Elgin, Middlesex | ||
| Census subdivisions | Aylmer, Bayham, Central Elgin, Dutton/Dunwich, London, Malahide, Southwold, St. Thomas, Thames Centre, West Elgin | ||
Elgin—Middlesex—London is a federal electoral district in Ontario, Canada, that has been represented in the House of Commons of Canada since 1997.
It was created in 1996 from Elgin—Norfolk, Lambton—Middlesex, and London—Middlesex ridings. This riding lost territory to London—Fanshawe during the 2012 electoral redistribution.
Members of Parliament
This riding has elected the following Members of Parliament:
| Parliament | Years | Member | Party | |
|---|---|---|---|---|
| Elgin—Middlesex—London Riding created from Elgin—Norfolk, Lambton—Middlesex and London—Middlesex |
||||
| 36th | 1997–2000 | Gar Knutson | Liberal | |
| 37th | 2000–2004 | |||
| 38th | 2004–2006 | Joe Preston | Conservative | |
| 39th | 2006–2008 | |||
| 40th | 2008–2011 | |||
| 41st | 2011–2015 | |||
| 42nd | 2015–Present | Karen Vecchio | ||
Election results
| Canadian federal election, 2015 | ||||||||
|---|---|---|---|---|---|---|---|---|
| Party | Candidate | Votes | % | ∆% | Expenditures | |||
| Conservative | Karen Louise Vecchio | 28,023 | 49.22 | –8.83 | – | |||
| Liberal | Lori Baldwin-Sands | 17,642 | 30.99 | +17.57 | – | |||
| New Democratic | Fred Sinclair | 8,771 | 15.41 | –8.67 | – | |||
| Green | Bronagh Joyce Morgan | 1,783 | 3.13 | +0.11 | – | |||
| Christian Heritage | Michael Hopkins | 529 | 0.93 | – | ||||
| Rhinoceros | Lou Bernardi | 185 | 0.32 | – | – | |||
| Total valid votes/Expense limit | 56,933 | 100.00 | $218,764.77 | |||||
| Total rejected ballots | 230 | 0.40 | ||||||
| Turnout | 57,163 | 68.96 | ||||||
| Eligible voters | 82,892 | |||||||
| Conservative hold | Swing | –13.20 | ||||||
| Source: Elections Canada[3][4] | ||||||||
| 2011 federal election redistributed results[5] | |||
|---|---|---|---|
| Party | Vote | % | |
| Conservative | 28,387 | 58.05 | |
| New Democratic | 11,774 | 24.08 | |
| Liberal | 6,559 | 13.41 | |
| Green | 1,478 | 3.02 | |
| Others | 701 | 1.43 | |
| Canadian federal election, 2011 | ||||||||
|---|---|---|---|---|---|---|---|---|
| Party | Candidate | Votes | % | ∆% | Expenditures | |||
| Conservative | Joe Preston | 29,147 | 57.55 | +9.17 | – | |||
| New Democratic | Fred Sinclair | 12,439 | 24.56 | +5.32 | – | |||
| Liberal | Graham Warwick | 6,812 | 13.45 | -10.07 | – | |||
| Green | John Fisher | 1,529 | 3.02 | -3.80 | – | |||
| Christian Heritage | Carl Hiemstra | 582 | 1.15 | -0.15 | – | |||
| Canadian Action | Will Arlow | 140 | 0.28 | +0.08 | – | |||
| Total valid votes | 50,649 | 100.00 | – | |||||
| Total rejected ballots | 170 | 0.33 | -0.07 | |||||
| Turnout | 50,819 | 62.90 | +3.24 | |||||
| Eligible voters | 80,796 | – | – | |||||
| Canadian federal election, 2008 | ||||||||
|---|---|---|---|---|---|---|---|---|
| Party | Candidate | Votes | % | ∆% | Expenditures | |||
| Conservative | Joe Preston | 22,970 | 48.38 | +2.8 | $77,732 | |||
| Liberal | Suzanne van Bommel | 11,169 | 23.52 | -2.8 | $79,198 | |||
| New Democratic | Ryan Dolby | 9,135 | 19.24 | 0.0 | $12,502 | |||
| Green | Noel Burgon | 3,241 | 6.82 | +1.2 | ||||
| Christian Heritage | Carl Hiemstra | 619 | 1.30 | -0.7 | $9,598 | |||
| Independent | Michael van Holst | 243 | 0.51 | – | $1,875 | |||
| Canadian Action | Will Arlow | 96 | 0.20 | 0.0 | ||||
| Total valid votes/Expense limit | 47,473 | 100.0 | $85,544 | |||||
| Total rejected ballots | 190 | 0.40 | ||||||
| Turnout | 47,663 | 59.66 | ||||||
| Canadian federal election, 2006 | ||||||||
|---|---|---|---|---|---|---|---|---|
| Party | Candidate | Votes | % | ∆% | ||||
| Conservative | Joe Preston | 23,416 | 45.6 | +1.8 | ||||
| Liberal | Crispin Colvin | 13,507 | 26.3 | -7.9 | ||||
| New Democratic | Tim McCallum | 9,873 | 19.2 | +4.6 | ||||
| Green | Jonathan Martyn | 2,878 | 5.6 | +1.2 | ||||
| Christian Heritage | Ken DeVries | 1,049 | 2.0 | -0.7 | ||||
| Progressive Canadian | Phill Borm | 504 | 1.0 | |||||
| Canadian Action | Will Arlow | 105 | 0.2 | -0.1 | ||||
| Total valid votes | 51,332 | 100.0 | ||||||
| Canadian federal election, 2004 | ||||||||
|---|---|---|---|---|---|---|---|---|
| Party | Candidate | Votes | % | ∆% | ||||
| Conservative | Joe Preston | 20,333 | 43.8 | -8.7 | ||||
| Liberal | Gar Knutson | 15,860 | 34.2 | -6.2 | ||||
| New Democratic | Tim McCallum | 6,763 | 14.6 | +9.4 | ||||
| Green | Julie-Ann Stodolny | 2,033 | 4.4 | +3.4 | ||||
| Christian Heritage | Ken DeVries | 1,246 | 2.7 | +1.8 | ||||
| Canadian Action | Will Arlow | 146 | 0.3 | |||||
| Total valid votes | 46,381 | 100.0 | ||||||
Note: Conservative vote is compared to the total of the Canadian Alliance vote and Progressive Conservative vote in 2000 election.
| Canadian federal election, 2000 | ||||||||
|---|---|---|---|---|---|---|---|---|
| Party | Candidate | Votes | % | ∆% | ||||
| Liberal | Gar Knutson | 17,890 | 40.4 | +0.4 | ||||
| Alliance | Bill Walters | 17,202 | 38.8 | +15.8 | ||||
| Progressive Conservative | Delia Reiche | 6,080 | 13.7 | -12.0 | ||||
| New Democratic | Tim McCallum | 2,319 | 5.2 | -2.1 | ||||
| Green | John R. Fisher | 431 | 1.0 | -0.2 | ||||
| Independent | Ken DeVries | 407 | 0.9 | -1.9 | ||||
| Total valid votes | 44,329 | 100.0 | ||||||
Note: Canadian Alliance vote is compared to the Reform vote in 1997 election.
| Canadian federal election, 1997 | ||||||||
|---|---|---|---|---|---|---|---|---|
| Party | Candidate | Votes | % | |||||
| Liberal | Gar Knutson | 17,890 | 40.0 | |||||
| Progressive Conservative | Luella Watson | 11,499 | 25.7 | |||||
| Reform | John Van Der Veen | 10,307 | 23.0 | |||||
| New Democratic | Cynthia Nurse | 3,260 | 7.3 | |||||
| Christian Heritage | Ron Steenbergen | 1,275 | 2.8 | |||||
| Green | John R. Fisher | 508 | 1.1 | |||||
| Total valid votes | 44,739 | 100.0 | ||||||
See also
References
- "(Code 35020) Census Profile". 2011 census. Statistics Canada. 2012. Retrieved 2011-03-03.
- Federal riding history from the Library of Parliament
- 2011 Results from Elections Canada
- Campaign expense data from Elections Canada
Notes
External links
- Website of the Parliament of Canada
- Website of the Conservative Party Electoral District Association for Elgin-Middlesex-London
.png)
Coordinates: 42°47′N 81°13′W / 42.78°N 81.21°W
This article is issued from Wikipedia - version of the 10/31/2016. The text is available under the Creative Commons Attribution/Share Alike but additional terms may apply for the media files.