Salisbury (UK Parliament constituency)
| Salisbury | |
|---|---|
|
County constituency for the House of Commons | |
|
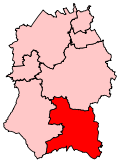
Boundary of Salisbury in Wiltshire. | |
|
Location of Wiltshire within England. | |
| County | Wiltshire |
| Electorate | 68,731 (December 2010)[1] |
| Major settlements | Salisbury |
| Current constituency | |
| Created | 1918 |
| Member of parliament | John Glen (Conservative) |
| Number of members | One |
| 1295–1918 | |
| Number of members |
1295–1885: Two 1885–1918: One |
| Type of constituency | Borough constituency |
| Overlaps | |
| European Parliament constituency | South West England |

Salisbury is a constituency[n 1] represented in the House of Commons of the UK Parliament since 2010 by John Glen, a Conservative.[n 2]
History
From 1295, (the Model Parliament) a form of this constituency on a narrower area, the Parliamentary borough of Salisbury, returned two MPs to the House of Commons of England[n 3] Elections were held using the bloc vote system. This afforded the ability for wealthy male townsfolk who owned property rated at more than £2 a year liability in Land Tax to vote in the county and borough (if they met the requirements of both systems). The franchise (right to vote) in the town was generally restricted to male tradespersons and professionals within the central town wards, however in medieval elections would have been the aldermen.
The borough constituency co-existed with a neighbouring minuscule-electorate seat described towards its Great Reform Act abolition as a rotten borough: Old Sarum that covered the mostly abandoned Roman citadel to the northeast.
Under the Redistribution of Seats Act 1885, the borough's representation was reduced to one member. The parliamentary borough of Salisbury was abolished for the 1918 general election however the name transferred immediately to a new county division.
Boundaries
1918-1950: The Municipal Boroughs of Salisbury and Wilton, and the Rural Districts of Amesbury, Salisbury, Tisbury, and Wilton.
1950-1983: The Municipal Boroughs of Salisbury and Wilton, and the Rural Districts of Amesbury, and Salisbury and Wilton.
1983-2010: The District of Salisbury wards of Alderbury, Amesbury, Bemerton, Bishopdown, Bulford, Chalke Valley, Donhead, Downton, Durrington, Ebble, Fisherton and Bemerton Village, Fonthill, Fovant, Harnham, Idmiston, Laverstock, Milford, Nadder, Redlynch, St Edmund, St Mark, St Martin, St Paul, Stratford, Till Valley, Tisbury, Upper Bourne, Whiteparish, Wilton, Winterbourne, Winterslow, Woodford Valley, and Wylye.
2010-present: The District of Salisbury wards of Alderbury and Whiteparish, Amesbury East, Amesbury West, Bemerton, Bishopdown, Chalke Valley, Downton and Redlynch, Ebble, Fisherton and Bemerton Village, Harnham East, Harnham West, Laverstock, Lower Wylye and Woodford Valley, St Edmund and Milford, St Mark and Stratford, St Martin and Milford, St Paul, Till Valley and Wylye, Upper Bourne, Idmiston and Winterbourne, Wilton, and Winterslow.
The constituency is based around the city of Salisbury in Wiltshire. A large portion of the former Salisbury district, excluding a part to the west, is included within the constituency.
Downton (listed above) was a former borough constituency until abolished as a rotten borough, like Old Sarum, in 1832.
Traditions
According to a local tradition, the Member of Parliament for Salisbury sings the song The Vly be on the Turmut from the balcony of the White Hart Hotel in St John's Street after winning each Parliamentary election.[2][3]
Constituency profile
The constituency consists of Census Output Areas of one local government district with a working population whose income is close to the national average and lower than average reliance upon social housing.[4] At the end of 2012 the unemployment rate in the constituency stood as 1.6% of the population claiming jobseekers allowance, compared to the regional average of 2.5%.[5]
The rural county as a whole has a low 14.8% of its population without a car, 18.6% of the population without qualifications and a high 29.5% with level 4 qualifications or above. In terms of tenure across the whole county 67.5% of homes are owned outright or on a mortgage as at the 2011 census.[6]
Members of Parliament
- Constituency created 1295
MPs 1295–1660
| Parliament | First member | Second member |
|---|---|---|
| 1386 | Thomas Burford | David White[7] |
| 1388 (Feb) | John Bitterley | Thomas Burford[7] |
| 1388 (Sep) | David White | John Hethe[7] |
| 1390 (Jan) | John Bitterley | William Warmwell[7] |
| 1390 (Nov) | ||
| 1391 | ||
| 1393 | John Bitterley | William Warmwell[7] |
| 1394 | John Bitterley | Thomas Burford[7] |
| 1395 | William Warmwell | Richard Spencer[7] |
| 1397 (Jan) | Richard Spencer | John Moner[7] |
| 1397 (Sep) | Richard Juel | John Cary[7] |
| 1399 | William Hulle I | William Walters[7] |
| 1401 | Richard Spencer | John Levesham[7] |
| 1402 | John Wallop | William Boyton[7] |
| 1404 (Jan) | William Waryn | John Levesham[7] |
| 1404 (Oct) | John Wallop | Richard Juel[7] |
| 1406 | William Bailey | William Boyton[7] |
| 1407 | Thomas Child | John Becket[7] |
| 1410 | William Bourer | William Bailey, died 1410[7] |
| 1411 | Richard Spencer | Walter Shirley[7] |
| 1413 (Feb) | Walter Shirley | William Waryn[7] |
| 1413 (May) | Walter Shirley | William Waryn[7] |
| 1414 (Apr) | Walter Shirley | John Becket[7] |
| 1414 (Nov) | Walter Shirley | John Becket[7] |
| 1415 | Walter Shirley | Henry Man[7] |
| 1416 (Mar) | Walter Shirley | Henry Man[7] |
| 1416 (Oct) | Walter Shirley | Thomas Mason[7] |
| 1417 | Walter Shirley | William Waryn[7] |
| 1419 | Walter Shirley | William Waryn[7] |
| 1420 | Walter Shirley | Robert Poynaunt[7] |
| 1421 (May) | Walter Shirley | Robert Poynaunt[7] |
| 1421 (Dec) | Walter Shirley | Thomas Boner[7] |
| 1422 | Henry Man[8] | |
| 1423 | William Alexander[9] | |
| 1425 | William Alexander[9] | Henry Man[8] |
| 1426 | Henry Man[8] | |
| 1427 | William Alexander[9] | |
| 1429 | Henry Man[8] | |
| 1431 | William Alexander[9] | |
| 1432 | William Alexander[9] | |
| 1485 | William Boket | Roger Holes[10] |
| 1510 | Thomas Coke I | William Webbe alias Kellowe[11] |
| 1512 | Thomas Coke I | Richard Bartholomew[11] |
| 1515 | Thomas Coke I, repl. Oct 1515 by John Abarough | Richard Bartholomew, repl. Oct 1515 by Thomas Brodegate[11] |
| 1523 | Robert Keilway | John Abarough[11] |
| 1529 | William Webbe II | Thomas Chaffyn I[11] |
| 1536 | William Webbe II[11] | |
| 1539 | Robert South | Henry Coldston[11] |
| 1542 | Charles Bulkeley | Edward Chaffyn[11] |
| 1545 | Thomas Gawdy I | John Story[11] |
| 1547 | Sir John Thynne | Henry Clifford[11] |
| 1553 (Mar) | George Penruddock | John Beckingham[11] |
| 1553 (Oct) | John Hooper | John Abyn[11] |
| 1554 (Apr) | Robert Griffith | John Abyn[11] |
| 1554 (Nov) | Robert Griffith | John Hooper[11] |
| 1555 | Thomas Chaffyn II | John Hooper[11] |
| 1558 | John Hooper | Robert Eyre[11] |
| 1559 | William Webbe | John Webbe[12] |
| 1562/3 | Anthony Weekes | Giles Estcourt[12] |
| 1571 | John Eyre | Giles Estcourt[12] |
| 1572 | Giles Estcourt | Hugh Tucker[12] |
| 1584 | Giles Estcourt | Christopher Weekes[12] |
| 1586 | Giles Estcourt | Christopher Weekes[12] |
| 1588 | Christopher Weekes | John Bayley[12] |
| 1593 | Giles Hutchens | Robert Bower[12] |
| 1597 | Thomas Eyre | Giles Hutchens[12] |
| 1601 | Giles Tooker | John Puxton[12] |
| 1604 | Giles Tooker | Richard Godfrey |
| 1614 | Giles Tooker | Roger Gauntlett |
| 1621 | Roger Gauntlett | Thomas Hussey |
| 1624 | Henry Sherfield | Roger Gauntlett |
| 1625 | Henry Sherfield | Walter Long |
| 1626 | Henry Sherfield | John Puxton |
| 1628 | Henry Sherfield | Bartholemew Tookey |
| 1629–1640 | No Parliaments summoned | |
| 1640 (Apr) | Robert Hyde | Michael Oldisworth |
| 1640 (Nov) | Robert Hyde | Michael Oldisworth |
| 1645 | Michael Oldisworth | John Dove |
| 1648 | Michael Oldisworth | John Dove |
| 1653 | Salisbury not represented in Barebones Parliament | |
| 1654 | Edward Tooker | William Stevens |
| 1656 | William Stone | James Heeley |
| 1659 | Henry Eyre | Humphry Ditton snr |
MPs 1660–1885
MPs since 1885
Elections
Elections in the 2010s
| Party | Candidate | Votes | % | ± | |
|---|---|---|---|---|---|
| Conservative | John Glen | 28,192 | 55.6 | +6.4 | |
| Labour | Thomas Corbin | 7,771 | 15.3 | +7.7 | |
| UKIP | Paul Martin[16] | 6,152 | 12.1 | +9.2 | |
| Liberal Democrat | Reetendra Nath Banerji | 5,099 | 10.1 | -26.9 | |
| Green | Alison Craig | 2,762 | 5.4 | +4.4 | |
| Independent | Arthur Uther Pendragon[17] | 729 | 1.4 | N/A | |
| Majority | 20,421 | 40.3 | +28.0 | ||
| Turnout | 50,705 | 72.9 | +1.0 | ||
| Conservative hold | Swing | ||||
| Party | Candidate | Votes | % | ± | |
|---|---|---|---|---|---|
| Conservative | John Glen | 23,859 | 49.2 | +2.8 | |
| Liberal Democrat | Nick Radford | 17,893 | 36.9 | +10.0 | |
| Labour | Tom Gann | 3,690 | 7.6 | −11.0 | |
| UKIP | Frances Howard | 1,392 | 2.9 | −1.3 | |
| BNP | Sean Witheridge | 765 | 1.6 | N/A | |
| Green | Nick Startin | 506 | 1.0 | −2.4 | |
| Independent | King Arthur | 257 | 0.5 | N/A | |
| Independent | John Holme | 119 | 0.2 | N/A | |
| Majority | 5,966 | 12.3 | |||
| Turnout | 48,481 | 71.9 | +3.4 | ||
| Conservative hold | Swing | −3.6 | |||
Elections in the 2000s
| Party | Candidate | Votes | % | ± | |
|---|---|---|---|---|---|
| Conservative | Robert Key | 25,961 | 47.8 | +1.2 | |
| Liberal Democrat | Richard Denton-White | 14,819 | 27.3 | −2.8 | |
| Labour | Clare Moody | 9,457 | 17.4 | −0.1 | |
| UKIP | Frances Howard | 2,290 | 4.2 | +0.5 | |
| Green | Hamish Soutar | 1,555 | 2.9 | +0.8 | |
| Independent | John Holme | 240 | 0.4 | N/A | |
| Majority | 11,142 | 20.5 | |||
| Turnout | 54,322 | 68.1 | +2.8 | ||
| Conservative hold | Swing | +2.0 | |||
| Party | Candidate | Votes | % | ± | |
|---|---|---|---|---|---|
| Conservative | Robert Key | 24,527 | 46.6 | +3.7 | |
| Liberal Democrat | Yvonne Emmerson-Peirce | 15,824 | 30.1 | −2.1 | |
| Labour | Sue Mallory | 9,199 | 17.5 | −0.1 | |
| UKIP | Malcolm Wood | 1,958 | 3.7 | −2.0 | |
| Green | Hamish Soutar | 1,095 | 2.1 | +1.0 | |
| Majority | 8,703 | 16.5 | |||
| Turnout | 52,603 | 65.3 | -8.3 | ||
| Conservative hold | Swing | ||||
Elections in the 1990s
| Party | Candidate | Votes | % | ± | |
|---|---|---|---|---|---|
| Conservative | Robert Key | 25,012 | 43.0 | −9.0 | |
| Liberal Democrat | Yvonne Emmerson-Peirce | 18,736 | 32.2 | −5.0 | |
| Labour | Ricky Rogers | 10,242 | 17.6 | +8.6 | |
| UKIP | Nigel Farage | 3,332 | 5.7 | N/A | |
| Green | Hamish Soutar | 623 | 1.1 | +0.1 | |
| Independent | William Holmes | 184 | 0.3 | N/A | |
| Natural Law | Shirley Haysom | 110 | 0.2 | 0.0 | |
| Majority | 6,276 | 10.8 | |||
| Turnout | 58,239 | 73.6 | |||
| Conservative hold | Swing | −2.0 | |||
| Party | Candidate | Votes | % | ± | |
|---|---|---|---|---|---|
| Conservative | Robert Key | 31,546 | 52.0 | −2.9 | |
| Liberal Democrat | Paul W.L. Sample | 22,573 | 37.2 | +2.2 | |
| Labour | Steve R. Fear | 5,483 | 9.0 | −0.4 | |
| Green | Dr. Sherwood M. Elcock | 609 | 1.0 | N/A | |
| Independent | Stephen W. Fletcher | 233 | 0.4 | N/A | |
| Independent | Tim I. Abbott | 117 | 0.2 | N/A | |
| Natural Law | Ms. Annie Martell | 93 | 0.2 | N/A | |
| Majority | 8,973 | 14.8 | −5.1 | ||
| Turnout | 60,654 | 79.9 | +4.3 | ||
| Conservative hold | Swing | −2.5 | |||
Elections in the 1980s
| Party | Candidate | Votes | % | ± | |
|---|---|---|---|---|---|
| Conservative | Robert Key | 31,612 | 54.87 | ||
| Social Democratic | Parry Andrew Mitchell | 20,169 | 35.0 | ||
| Labour | TE Seaborne | 5,455 | 9.5 | ||
| Independent | SW Fletcher | 372 | 0.6 | ||
| Majority | 11,443 | 19.9 | |||
| Turnout | 75.6 | ||||
| Conservative hold | Swing | ||||
| Party | Candidate | Votes | % | ± | |
|---|---|---|---|---|---|
| Conservative | Robert Key | 28,876 | 53.5 | ||
| Liberal | John F Lakeman | 21,702 | 40.2 | ||
| Labour | CK Lamberth | 3,139 | 5.8 | ||
| Wessex Regionalist | M Kemp | 182 | 0.3 | ||
| Independent | T Abbott | 86 | 0.2 | ||
| Majority | 7,174 | 13.3 | |||
| Turnout | 72.8 | ||||
| Conservative hold | Swing | ||||
Elections in the 1970s
| Party | Candidate | Votes | % | ± | |
|---|---|---|---|---|---|
| Conservative | Michael Aubrey Hamilton | 24,962 | 49.9 | ||
| Liberal | John F Lakeman | 18,718 | 37.4 | ||
| Labour | CR Boney | 6,321 | 12.6 | ||
| Majority | 6,244 | 12.5 | |||
| Turnout | 77.4 | ||||
| Conservative hold | Swing | ||||
| Party | Candidate | Votes | % | ± | |
|---|---|---|---|---|---|
| Conservative | Michael Aubrey Hamilton | 20,478 | 43.6 | ||
| Liberal | John F Lakeman | 16,298 | 34.7 | ||
| Labour | CJ Connnor | 10,140 | 21.6 | ||
| Majority | 4,180 | 8.9 | |||
| Turnout | 74.7 | ||||
| Conservative hold | Swing | ||||
| Party | Candidate | Votes | % | ± | |
|---|---|---|---|---|---|
| Conservative | Michael Aubrey Hamilton | 22,753 | 45.7 | ||
| Liberal | John F Lakeman | 16,536 | 33.2 | ||
| Labour | CJ Connor | 10,455 | 21.0 | ||
| Majority | 6,217 | 12.5 | |||
| Turnout | 79.95 | ||||
| Conservative hold | Swing | ||||
| Party | Candidate | Votes | % | ± | |
|---|---|---|---|---|---|
| Conservative | Michael Aubrey Hamilton | 26,549 | 60.3 | ||
| Labour | Alexander Waugh | 17,493 | 39.7 | ||
| Majority | 9,056 | 20.6 | |||
| Turnout | 71.4 | ||||
| Conservative hold | Swing | ||||
Elections in the 1960s
| Party | Candidate | Votes | % | ± | |
|---|---|---|---|---|---|
| Conservative | Michael Aubrey Hamilton | 22,601 | 55.0 | ||
| Labour | Ronald C Smith | 18,462 | 45.0 | ||
| Majority | 4,139 | 10.1 | |||
| Turnout | 41,063 | 76.2 | |||
| Conservative hold | Swing | +1.9 | |||
| Party | Candidate | Votes | % | ± | |
|---|---|---|---|---|---|
| Conservative | Michael Aubrey Hamilton | 17,599 | 48.2 | −0.1 | |
| Labour | Leifchild Mills | 13,660 | 37.4 | +3.0 | |
| Liberal | Cllr. Hugh Capstick | 4,699 | 12.9 | −4.4 | |
| Independent Conservative | Horace Trevor-Cox | 533 | 1.5 | N/A | |
| Majority | 3,939 | 10.8 | −3.1 | ||
| Turnout | 36,491 | ||||
| Conservative hold | Swing | ||||
| Party | Candidate | Votes | % | ± | |
|---|---|---|---|---|---|
| Conservative | John Granville Morrison | 20,071 | 48.3 | −4.5 | |
| Labour | Leif Mills | 14,311 | 34.4 | +1.3 | |
| Liberal | Cllr. Hugh Capstick | 7,176 | 17.3 | +3.2 | |
| Majority | 5,760 | 13.9 | −5.8 | ||
| Turnout | 41,558 | 78.6 | +0.4 | ||
| Conservative hold | Swing | − | |||
Elections in the 1950s
| Party | Candidate | Votes | % | ± | |
|---|---|---|---|---|---|
| Conservative | John Granville Morrison | 20,641 | 52.8 | ||
| Labour | Dr. John A Cannon | 12,932 | 33.1 | ||
| Liberal | John Mackarness Booker | 5,516 | 14.1 | ||
| Majority | 7,709 | 19.7 | |||
| Turnout | 78.2 | ||||
| Conservative hold | Swing | ||||
| Party | Candidate | Votes | % | ± | |
|---|---|---|---|---|---|
| Conservative | John Granville Morrison | 20,271 | 53.4 | ||
| Labour | John Papworth | 12,632 | 33.3 | ||
| Liberal | John Mackarness Booker | 5,037 | 13.3 | ||
| Majority | 7,639 | 20.1 | |||
| Turnout | 77.7 | ||||
| Conservative hold | Swing | ||||
| Party | Candidate | Votes | % | ± | |
|---|---|---|---|---|---|
| Conservative | John Granville Morrison | 21,798 | 57.1 | ||
| Labour | Roger R Thomas | 16,386 | 42.9 | ||
| Majority | 5,412 | 14.2 | |||
| Turnout | 80.2 | ||||
| Conservative hold | Swing | ||||
| Party | Candidate | Votes | % | ± | |
|---|---|---|---|---|---|
| Conservative | John Granville Morrison | 17,301 | 45.0 | ||
| Labour | Ald. WAJ Case | 12,319 | 32.0 | ||
| Liberal | Alan Campbell Johnson | 8,847 | 23.0 | ||
| Majority | 4,982 | 12.9 | |||
| Turnout | 83.7 | ||||
| Conservative hold | Swing | ||||
Elections in the 1940s
| Party | Candidate | Votes | % | ± | |
|---|---|---|---|---|---|
| Conservative | Maj. John Granville Morrison | 16,742 | 44.02 | ||
| Labour | John Alan Lyde Caunter | 12,344 | 32.46 | ||
| Liberal | Wing-Com. Alan Campbell Johnson | 8,946 | 23.52 | ||
| Majority | 4,398 | 11.56 | |||
| Turnout | 70.81 | ||||
| Conservative hold | Swing | ||||
| Party | Candidate | Votes | % | ± | |
|---|---|---|---|---|---|
| Conservative | John Granville Morrison | 12,076 | 67.8 | −3.7 | |
| Independent Progressive | William Reginald Hipwell | 3,218 | 18.1 | N/A | |
| Independent Democrat | J. D. Monro | 2,519 | 14.1 | N/A | |
| Majority | 8,858 | 49.7 | +6.7 | ||
| Turnout | 17,813 | 39.7 | −26.5 | ||
| Conservative hold | Swing | ||||
Elections in the 1930s
| Party | Candidate | Votes | % | ± | |
|---|---|---|---|---|---|
| Conservative | James Despencer-Robertson | 20,707 | 71.5 | −5.4 | |
| Labour | E. J. Plaisted | 8,259 | 28.5 | +5.4 | |
| Majority | 12,448 | 43.0 | −10.8 | ||
| Turnout | 28,966 | 66.2 | −5.7 | ||
| Conservative hold | Swing | −5.4 | |||
| Party | Candidate | Votes | % | ± | |
|---|---|---|---|---|---|
| Conservative | James Despencer-Robertson | 23,189 | 76.92 | ||
| Labour | AB Lemon | 6,956 | 23.08 | ||
| Majority | 16,233 | 53.85 | |||
| Turnout | 71.86 | ||||
| Conservative hold | Swing | ||||
| Party | Candidate | Votes | % | ± | |
|---|---|---|---|---|---|
| Conservative | James Despencer-Robertson | 15,800 | 53.9 | +6.3 | |
| Liberal | Lucy Blanche Masterman | 9,588 | 32.7 | −6.6 | |
| Labour | F. R. Hancock | 3,939 | 13.4 | +0 | |
| Majority | 6,212 | 21.2 | +13.2 | ||
| Turnout | 29,327 | 71.1 | −10.8 | ||
| Conservative hold | Swing | +6.6 | |||
Elections in the 1920s
| Party | Candidate | Votes | % | ± | |
|---|---|---|---|---|---|
| Unionist | Hugh Morrison | 15,672 | 47.3 | −9.0 | |
| Liberal | Lucy Blanche Masterman | 13,022 | 39.3 | +3.7 | |
| Labour | F. R. Hancock | 4,435 | 13.4 | +5.3 | |
| Majority | 2,650 | 8.0 | −12.7 | ||
| Turnout | 33,129 | 81.9 | +0.1 | ||
| Unionist hold | Swing | -6.4 | |||
| Party | Candidate | Votes | % | ± | |
|---|---|---|---|---|---|
| Unionist | Hugh Morrison | 14,475 | 56.4 | ||
| Liberal | Hugh Lawrence Fletcher Moulton | 9,138 | 35.6 | ||
| Labour | David Freeman | 2,071 | 8.1 | ||
| Majority | 20.8 | ||||
| Turnout | 25,684 | ||||
| Unionist gain from Liberal | Swing | ||||
| Party | Candidate | Votes | % | ± | |
|---|---|---|---|---|---|
| Liberal | Hugh Lawrence Fletcher Moulton | 12,375 | 51.4 | ||
| Unionist | Hugh Morrison | 11,710 | 48.6 | ||
| Majority | 665 | 2.8 | |||
| Turnout | 24,085 | ||||
| Liberal gain from Unionist | Swing | ||||
| Party | Candidate | Votes | % | ± | |
|---|---|---|---|---|---|
| Unionist | Hugh Morrison | 11,882 | |||
| Liberal | Alfred Ernest Brown | 11,559 | |||
| Majority | |||||
| Turnout | |||||
| Unionist hold | Swing | ||||
Elections in the 1910s
| Party | Candidate | Votes | % | ± | |
|---|---|---|---|---|---|
| Unionist | Hugh Morrison | 9,168 | |||
| Liberal | Lt. Alfred Ernest Brown | 8,018 | |||
| Majority | |||||
| Turnout | |||||
| Unionist hold | Swing | ||||
Elections in the 1900s
| Party | Candidate | Votes | % | ± | |
|---|---|---|---|---|---|
| Liberal | Edward Priaulx Tennant | 1,646 | 50.6 | ||
| Conservative | Sir Walter Palmer | 1,605 | 49.4 | ||
| Majority | 41 | 1.2 | |||
| Turnout | 95.7 | ||||
| Liberal gain from Conservative | Swing | ||||
See also
Notes and references
- Notes
- ↑ A county constituency (for the purposes of election expenses and type of returning officer)
- ↑ As with all constituencies, the constituency elects one Member of Parliament (MP) by the first past the post system of election at least every five years.
- ↑ And then to its successor bodies: the House of Commons of Great Britain from 1707, and the House of Commons of the United Kingdom from 1801.
- References
- ↑ "Electorate Figures - Boundary Commission for England". 2011 Electorate Figures. Boundary Commission for England. 4 March 2011. Retrieved 13 March 2011.
- ↑ D. A. E. Cross, Salisbury: a history and celebration of the city (Teffont: Frith Book Co., 2004, ISBN 1-904938-44-2) p. 80
- ↑ The Vly be on the Turmut at wiltshire.gov.uk, accessed 22 october 2011
- ↑ 2001 Census
- ↑ Unemployment claimants by constituency The Guardian
- ↑ 2011 census interactive maps
- 1 2 3 4 5 6 7 8 9 10 11 12 13 14 15 16 17 18 19 20 21 22 23 24 25 26 27 28 29 30 "History of Parliament". History of Parliament Trust. Retrieved 2011-11-01.
- 1 2 3 4 "MAN, Henry, of Salisbury, Wilts.". History of Parliament Online. Retrieved 14 April 2016.
- 1 2 3 4 5 http://www.historyofparliamentonline.org/volume/1386-1421/member/alexander-william-1446
- ↑ Cavill. The English Parliaments of Henry VII 1485-1504.
- 1 2 3 4 5 6 7 8 9 10 11 12 13 14 15 16 "History of Parliament". History of Parliament Trust. Retrieved 2011-11-01.
- 1 2 3 4 5 6 7 8 9 10 "History of Parliament". History of Parliament Trust. Retrieved 2011-11-01.
- 1 2 3 Leigh Rayment's Historical List of MPs – Constituencies beginning with "S" (part 2)
- ↑ http://elections.wiltshire.gov.uk/Home/Division/1214 19Jun2015
- ↑ "Election Data 2015". Electoral Calculus. Archived from the original on 17 October 2015. Retrieved 17 October 2015.
- ↑ http://ukpollingreport.co.uk/2015guide/salisbury/
- ↑ Cork, Tristan (11 February 2014). "King Arthur enters politics with launch of People's Party". Western Daily Press. Retrieved 25 January 2015.
- ↑ "Election Data 2010". Electoral Calculus. Archived from the original on 17 October 2015. Retrieved 17 October 2015.
- ↑ "Election 2010: Salisbury". BBC News. BBC. 7 May 2010. Retrieved 9 May 2010.
- ↑ "Election Data 2005". Electoral Calculus. Archived from the original on 15 October 2011. Retrieved 18 October 2015.
- ↑ "Election Data 2001". Electoral Calculus. Archived from the original on 15 October 2011. Retrieved 18 October 2015.
- ↑ "Election Data 1997". Electoral Calculus. Archived from the original on 15 October 2011. Retrieved 18 October 2015.
- ↑ "Election Data 1992". Electoral Calculus. Archived from the original on 15 October 2011. Retrieved 18 October 2015.
- ↑ "Politics Resources". Election 1992. Politics Resources. 9 April 1992. Retrieved 2010-12-06.
- ↑ "Election Data 1987". Electoral Calculus. Archived from the original on 15 October 2011. Retrieved 18 October 2015.
- ↑ "Election Data 1983". Electoral Calculus. Archived from the original on 15 October 2011. Retrieved 18 October 2015.
- ↑ British parliamentary election results 1885-1918, Craig, F. W. S.
- ↑ British parliamentary election results 1885-1918, Craig, F. W. S.
- ↑ British parliamentary election results, 1885-1918 (Craig)
Sources
- Craig, F. W. S. (1989) [1977]. British parliamentary election results 1832–1885 (2nd ed.). Chichester: Parliamentary Research Services. pp. 266–267. ISBN 0-900178-26-4.
- Craig, F. W. S. (1989) [1974]. British parliamentary election results 1885–1918 (2nd ed.). Chichester: Parliamentary Research Services. p. 181. ISBN 0-900178-27-2.
- Craig, F. W. S. (1983) [1969]. British parliamentary election results 1918–1949 (3rd ed.). Chichester: Parliamentary Research Services. p. 497. ISBN 0-900178-06-X.