Plymouth Sutton and Devonport (UK Parliament constituency)
| Plymouth, Sutton and Devonport | |
|---|---|
|
Borough constituency for the House of Commons | |
|
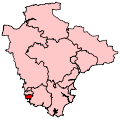
Boundary of Plymouth, Sutton and Devonport in Devon. | |
|
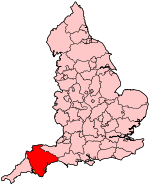
Location of Devon within England. | |
| County | Devon |
| Electorate | 71,236 (December 2010)[1] |
| Current constituency | |
| Created | 2010 |
| Member of parliament | Oliver Colvile (Conservative) |
| Number of members | One |
| Created from | Plymouth Devonport, Plymouth Sutton |
| Overlaps | |
| European Parliament constituency | South West England |
Plymouth, Sutton and Devonport is a borough constituency represented in the House of Commons of the Parliament of the United Kingdom. It elects one Member of Parliament (MP) by the first past the post system of election.
Following the review by the Boundary Commission for England into parliamentary representation in Devon, constituencies in Plymouth have been reorganised. This is one of two new seats, the other being Plymouth Moor View.[2] It is largely based on the former Plymouth, Sutton, with the addition of smaller parts of the former Plymouth Devonport constituency.
Boundaries
The areas which make up this seat include Compton, Devonport, Stonehouse, Drake ward (which includes the University and Mutley), Efford and Lipson, Peverell, St Peter and the Waterfront, Stoke, and Sutton and Mount Gould.[2]
The seat is entirely within the boundaries of the city of Plymouth, and includes the city centre.
History
This constituency has been represented since its creation in 2010 by the Conservative Oliver Colvile. In 2015, against opinion poll predictions, Colvile held the seat over the Labour candidate Luke Pollard, but with a reduced majority.
Members of Parliament
| Election | Member[3] | Party | |
|---|---|---|---|
| 2010 | Oliver Colvile | Conservative | |
Elections
Elections in the 2010s
| Party | Candidate | Votes | % | ± | |
|---|---|---|---|---|---|
| Conservative | Oliver Colvile | 18,120 | 37.8 | +3.5 | |
| Labour | Luke Pollard | 17,597 | 36.7 | +5.0 | |
| UKIP | Roy Kettle | 6,731 | 14.0 | +7.5 | |
| Green | Libby Brown | 3,401 | 7.1 | +5.0 | |
| Liberal Democrat | Graham Reed | 2,008 | 4.2 | -20.5 | |
| Communist | Laura-Jane Rossington | 106 | 0.2 | N/A | |
| Majority | 523 | 1.1 | |||
| Turnout | 47,963 | 65.5 | |||
| Conservative hold | Swing | -0.8% | |||
| Party | Candidate | Votes | % | ± | |
|---|---|---|---|---|---|
| Conservative | Oliver Colvile | 15,050 | 34.3 | +4.7 | |
| Labour | Linda Gilroy | 13,901 | 31.7 | -9.0 | |
| Liberal Democrat | Judy Evans | 10,829 | 24.7 | +2.1 | |
| UKIP | Andrew Leigh | 2,854 | 6.5 | -0.1 | |
| Green | Tony Brown | 904 | 2.1 | +2.1 | |
| Independent | Brian Gerrish | 223 | 0.5 | +0.5 | |
| Socialist Labour | Robert Hawkins | 123 | 0.3 | +0.3 | |
| Majority | 1,149 | 2.6 | |||
| Turnout | 43,894 | 61.8 | +6.3 | ||
| Conservative gain from Labour | Swing | +6.9 | |||
See also
Notes and references
- ↑ "Electorate Figures - Boundary Commission for England". 2011 Electorate Figures. Boundary Commission for England. 4 March 2011. Archived from the original on 6 November 2010. Retrieved 13 March 2011.
- 1 2 "Final recommendations for Parliamentary constituencies in the counties of Devon, Plymouth and Torbay". Boundary Commission for England. 2004-11-24. Retrieved 2010-04-25.
- ↑ Leigh Rayment's Historical List of MPs – Constituencies beginning with "S" (part 6)
- ↑ "Election Data 2015". Electoral Calculus. Archived from the original on 17 October 2015. Retrieved 17 October 2015.
- ↑ "Election Data 2010". Electoral Calculus. Archived from the original on 17 October 2015. Retrieved 17 October 2015.
- ↑ BBC Election Results BBC News - Election Results 2010 - Plymouth Sutton and Devonport. Retrieved 7 May 2010
Sources
- Plymouth Sutton and Devonport, UKPollingReport
Coordinates: 50°22′12″N 4°08′28″W / 50.37°N 4.141°W