Bournemouth West (UK Parliament constituency)
Coordinates: 50°43′01″N 1°54′47″W / 50.717°N 1.913°W
| Bournemouth West | |
|---|---|
|
Borough constituency for the House of Commons | |
|
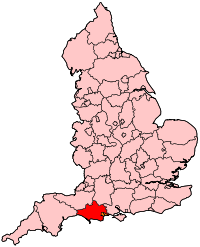
Boundary of Bournemouth West in Dorset. | |
|
Location of Dorset within England. | |
| County | Dorset |
| Population | 98,968 (2011 census)[1] |
| Electorate | 72,714 (December 2010)[2] |
| Current constituency | |
| Created | 1950 |
| Member of parliament | Conor Burns (Conservative) |
| Number of members | One |
| Overlaps | |
| European Parliament constituency | South West England |

Bournemouth West is a borough constituency represented in the House of Commons of the Parliament of the United Kingdom. It elects one Member of Parliament (MP) by the first past the post system of election.
Boundaries
1950-1974: The County Borough of Bournemouth wards of Central, East Cliff, Kinson, Moordown North, Moordown South, Redhill Park, Westbourne, West Cliff, and Winton.
1974-1983: The County Borough of Bournemouth wards of Central, East Cliff, Kinson North, Kinson South, Redhill Park, Westbourne, West Cliff, and Winton.
1983-1997: The Borough of Bournemouth wards of Ensbury Park, Kinson, Redhill Park, Talbot Woods, Wallisdown, Westbourne, West Cliff, and Winton, and the Borough of Poole wards of Alderney, Bourne Valley, and Canford Magna.
1997-2010: The Borough of Bournemouth wards of Central, East Cliff, Ensbury Park, Kinson, Redhill Park, Talbot Woods, Wallisdown, Westbourne, West Cliff, and Winton.
2010–present: The Borough of Bournemouth wards of Central, Kinson North, Kinson South, Redhill and Northbourne, Talbot and Branksome Woods, Wallisdown and Winton West, Westbourne and West Cliff, and Winton East, and the Borough of Poole wards of Alderney and Branksome East.
The constituency includes the western portion of Bournemouth, from the Kinson, Winton, and Talbot Woods areas down towards the town centre and the West Cliff. Following a boundary change for the 2010 General Election, the constituency gained the Branksome area from Poole whilst losing East Cliff to the neighbouring Bournemouth East constituency.
The constituency contains Labour's best ward in Bournemouth in the district of Kinson, but the seat has elected Conservatives at every election since its creation in 1950 and is considered safe for them.
With the exception of the period 1983-1997 (when it was in Bournemouth East), Bournemouth town centre has been in this constituency since its creation in 1950.
Members of Parliament
| Election | Member[3] | Party | Notes | |
|---|---|---|---|---|
| 1950 | Viscount Cranborne | Conservative | Resigned 1954 | |
| 1954 by-election | John Eden | Conservative | ||
| 1983 | John Butterfill | Conservative | ||
| 2010 | Conor Burns | Conservative | ||
Elections
Elections in the 2010s
| Party | Candidate | Votes | % | ± | |
|---|---|---|---|---|---|
| Conservative | Conor Burns | 20,155 | 48.2 | +3.1 | |
| UKIP | Martin Houlden | 7,745 | 18.5 | +11.3 | |
| Labour | David Stokes | 7,386 | 17.7 | +2.9 | |
| Liberal Democrat | Mike Plummer | 3,281 | 7.9 | -23.9 | |
| Green | Elizabeth McManus | 3,107 | 7.4 | +7.4 | |
| Patria | Dick Franklin | 99 | 0.2 | +0.2 | |
| Majority | 12,410 | 29.7 | +16.3 | ||
| Turnout | 41,767 | 58.0 | -0.1 | ||
| Conservative hold | Swing | ||||
| Party | Candidate | Votes | % | ± | |
|---|---|---|---|---|---|
| Conservative | Conor Burns | 18,808 | 45.1 | +5.6 | |
| Liberal Democrat | Alasdair Murray | 13,225 | 31.7 | -0.2 | |
| Labour | Sharon Carr-Brown | 6,171 | 14.8 | -8.1 | |
| UKIP | Philip Glover | 2,999 | 7.2 | +1.6 | |
| Independent | Harvey Taylor | 456 | 1.1 | ||
| Majority | 5,583 | 13.4 | |||
| Turnout | 41,659 | 58.1 | +4.2 | ||
| Conservative hold | Swing | +2.9 | |||
Elections in the 2000s
| Party | Candidate | Votes | % | ± | |
|---|---|---|---|---|---|
| Conservative | John Butterfill | 14,057 | 41.4 | −1.4 | |
| Liberal Democrat | Richard Renaut | 10,026 | 29.6 | +4.4 | |
| Labour | Dafydd Williams | 7,824 | 23.1 | −5.7 | |
| UKIP | Michael Maclaire-Hillier | 2,017 | 5.9 | +2.7 | |
| Majority | 4,031 | 11.9 | |||
| Turnout | 33,924 | 53.3 | +0.1 | ||
| Conservative hold | Swing | -2.9 | |||
| Party | Candidate | Votes | % | ± | |
|---|---|---|---|---|---|
| Conservative | John Butterfill | 14,417 | 42.8 | +1.2 | |
| Labour | David Stokes | 9,699 | 28.8 | +4.3 | |
| Liberal Democrat | Fiona Hornby | 8,468 | 25.2 | -2.6 | |
| UKIP | Cynthia Blake | 1,064 | 3.2 | +2.5 | |
| Majority | 4,718 | 14.0 | |||
| Turnout | 33,648 | 53.2 | -13.0 | ||
| Conservative hold | Swing | ||||
Elections in the 1990s
| Party | Candidate | Votes | % | ± | |
|---|---|---|---|---|---|
| Conservative | John Butterfill | 17,115 | 41.7 | ||
| Liberal Democrat | Janet Dover | 11,405 | 27.8 | ||
| Labour | Dennis Gritt | 10,093 | 24.6 | ||
| Referendum | Ronald Mills | 1,910 | 4.7 | ||
| UKIP | Linda Tooley | 281 | 0.7 | ||
| BNP | John Morse | 165 | 0.4 | ||
| Natural Law | Alexander Springham | 103 | 0.3 | ||
| Majority | 5,710 | 13.9 | |||
| Turnout | 41,073 | 66.21 | |||
| Conservative hold | Swing | -5.6 | |||
| Party | Candidate | Votes | % | ± | |
|---|---|---|---|---|---|
| Conservative | John Butterfill | 29,820 | 52.7 | −2.5 | |
| Liberal Democrat | Janet Dover | 17,117 | 30.2 | −1.7 | |
| Labour | Ben Grower | 9,423 | 16.7 | +3.8 | |
| Natural Law | Alexander Springham | 232 | 0.4 | +0.4 | |
| Majority | 12,703 | 22.4 | −0.7 | ||
| Turnout | 56,592 | 75.7 | +2.4 | ||
| Conservative hold | Swing | −0.4 | |||
Elections in the 1980s
| Party | Candidate | Votes | % | ± | |
|---|---|---|---|---|---|
| Conservative | John Butterfill | 30,117 | 55.16 | ||
| Social Democratic | PGM Craven | 17,466 | 31.99 | ||
| Labour | RW Jones | 7,018 | 12.85 | ||
| Majority | 12,651 | 23.17 | |||
| Turnout | 73.35 | ||||
| Conservative hold | Swing | ||||
| Party | Candidate | Votes | % | ± | |
|---|---|---|---|---|---|
| Conservative | John Butterfill | 28,466 | 56.90 | ||
| Liberal | M James | 15,135 | 30.26 | ||
| Labour | K Horrocks | 6,243 | 12.48 | ||
| BNP | JH Morse | 180 | 0.36 | ||
| Majority | 13,331 | 26.65 | |||
| Turnout | 69.19 | ||||
| Conservative hold | Swing | ||||
Elections in the 1970s
| Party | Candidate | Votes | % | ± | |
|---|---|---|---|---|---|
| Conservative | John Eden | 25,873 | 59.84 | ||
| Labour | Peter J. Brushett | 9,247 | 21.39 | ||
| Liberal | Terence D. G. Richards | 7,677 | 17.76 | ||
| National Front | G Hubbard | 438 | 1.01 | ||
| Majority | 16,626 | 38.45 | |||
| Turnout | 70.46 | ||||
| Conservative hold | Swing | ||||
| Party | Candidate | Votes | % | ± | |
|---|---|---|---|---|---|
| Conservative | John Eden | 21,294 | 50.67 | ||
| Labour | LF Bennett | 10,566 | 25.14 | ||
| Liberal | Terence D. G. Richards | 10,166 | 24.19 | ||
| Majority | 10,728 | 25.53 | |||
| Turnout | 68.66 | ||||
| Conservative hold | Swing | ||||
| Party | Candidate | Votes | % | ± | |
|---|---|---|---|---|---|
| Conservative | John Eden | 23,473 | 50.82 | ||
| Liberal | Terence D. G. Richards | 12,655 | 27.40 | ||
| Labour | LF Bennett | 10,062 | 21.78 | ||
| Majority | 10,818 | 23.42 | |||
| Turnout | 76.06 | ||||
| Conservative hold | Swing | ||||
| Party | Candidate | Votes | % | ± | |
|---|---|---|---|---|---|
| Conservative | John Eden | 28,714 | 56.17 | ||
| Labour | L. F. Bennett | 14,099 | 27.58 | ||
| Liberal | John E. Mills | 8,303 | 16.24 | ||
| Majority | 13,615 | 28.59 | |||
| Turnout | 69.28 | ||||
| Conservative hold | Swing | ||||
Elections in the 1960s
| Party | Candidate | Votes | % | ± | |
|---|---|---|---|---|---|
| Conservative | John Eden | 25,740 | 50.02 | ||
| Labour | L .F. Bennett | 16,334 | 31.74 | ||
| Liberal | J. F. Mills | 9,389 | 18.24 | ||
| Majority | 9,406 | 18.28 | |||
| Turnout | 73.37 | ||||
| Conservative hold | Swing | ||||
| Party | Candidate | Votes | % | ± | |
|---|---|---|---|---|---|
| Conservative | John Eden | 26,114 | 50.44 | ||
| Labour | GW Spicer | 13,975 | 26.99 | ||
| Liberal | J. F. Mills | 11,681 | 22.56 | ||
| Majority | 12,139 | 23.45 | |||
| Turnout | 73.71 | ||||
| Conservative hold | Swing | ||||
Elections in the 1950s
| Party | Candidate | Votes | % | ± | |
|---|---|---|---|---|---|
| Conservative | John Eden | 33,575 | 67.78 | ||
| Labour | GW Spicer | 15,957 | 32.22 | ||
| Majority | 17,618 | 35.57 | |||
| Turnout | 72.62 | ||||
| Conservative hold | Swing | ||||
| Party | Candidate | Votes | % | ± | |
|---|---|---|---|---|---|
| Conservative | John Eden | 31,931 | 67.83 | ||
| Labour | C Ford | 15,147 | 32.17 | ||
| Majority | 16,784 | 35.65 | |||
| Turnout | 71.71 | ||||
| Conservative hold | Swing | ||||
| Party | Candidate | Votes | % | ± | |
|---|---|---|---|---|---|
| Conservative | John Eden | 20,695 | 69.68 | +4.19 | |
| Labour | H Brinton | 9,006 | 30.32 | -4.19 | |
| Majority | 11,689 | 39.36 | +8.38 | ||
| Turnout | 29,701 | ||||
| Conservative hold | Swing | ||||
| Party | Candidate | Votes | % | ± | |
|---|---|---|---|---|---|
| Conservative | Viscount Cranborne | 33,269 | 65.49 | ||
| Labour | Judith Hart | 17,532 | 34.51 | ||
| Majority | 15,737 | 30.98 | |||
| Turnout | 77.71 | ||||
| Conservative hold | Swing | ||||
| Party | Candidate | Votes | % | ± | |
|---|---|---|---|---|---|
| Conservative | Viscount Cranborne | 28,548 | 53.62 | ||
| Labour | WA Boddy | 15,476 | 29.07 | ||
| Liberal | John Creasey | 9,216 | 17.31 | ||
| Majority | 13,072 | ||||
| Turnout | 83.95 | ||||
| Conservative hold | Swing | ||||
See also
Notes and references
- ↑ "Bournemouth West: Usual Resident Population, 2011". Neighbourhood Statistics. Office for National Statistics. Retrieved 1 February 2015.
- ↑ "Electorate Figures – Boundary Commission for England". 2011 Electorate Figures. Boundary Commission for England. 4 March 2011. Archived from the original on 6 November 2010. Retrieved 13 March 2011.
- ↑ Leigh Rayment's Historical List of MPs – Constituencies beginning with "B" (part 4)
- ↑ "Election Data 2010". Electoral Calculus. Archived from the original on 26 July 2013. Retrieved 17 October 2015.
- ↑ "Election Data 2005". Electoral Calculus. Archived from the original on 15 October 2011. Retrieved 18 October 2015.
- ↑ "Election Data 2001". Electoral Calculus. Archived from the original on 15 October 2011. Retrieved 18 October 2015.
- ↑ "Election Data 1997". Electoral Calculus. Archived from the original on 15 October 2011. Retrieved 18 October 2015.
- ↑ "Election Data 1992". Electoral Calculus. Archived from the original on 15 October 2011. Retrieved 18 October 2015.
- ↑ "Politics Resources". Election 1992. Politics Resources. 9 April 1992. Retrieved 6 December 2010.
- ↑ "Election Data 1987". Electoral Calculus. Archived from the original on 15 October 2011. Retrieved 18 October 2015.
- ↑ "Election Data 1983". Electoral Calculus. Archived from the original on 15 October 2011. Retrieved 18 October 2015.
External links
- nomis Constituency Profile for Bournemouth West — presenting data from the ONS annual population survey and other official statistics.