Bournemouth East (UK Parliament constituency)
Coordinates: 50°43′30″N 1°48′11″W / 50.725°N 1.803°W
| Bournemouth East | |
|---|---|
|
Borough constituency for the House of Commons | |
|
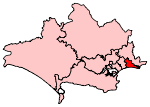
Boundary of Bournemouth East in Dorset. | |
|
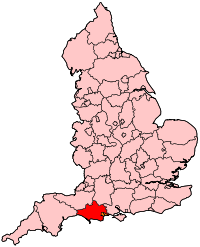
Location of Dorset within England. | |
| County | Dorset |
| Population | 102,152 (2011 census)[1] |
| Electorate | 72,961 (December 2010)[2] |
| Current constituency | |
| Created | 1974 |
| Member of parliament | Tobias Ellwood (Conservative) |
| Number of members | One |
| Created from | Bournemouth East and Christchurch |
| Overlaps | |
| European Parliament constituency | South West England |
Bournemouth East is a borough constituency represented in the House of Commons of the Parliament of the United Kingdom. It elects one Member of Parliament (MP) by the first past the post system of election. It has elected Conservative MPs since its creation.
Boundaries
1974-1983: The County Borough of Bournemouth wards of Boscombe East, Boscombe West, King's Park, Moordown North, Moordown South, Queen's Park, Southbourne, and West Southbourne.
1983-1997: The Borough of Bournemouth wards of Boscombe East, Boscombe West, Central, East Cliff, Littledown, Moordown, Muscliff, Queen's Park, Southbourne, Strouden Park, and West Southbourne.
1997-2010: The Borough of Bournemouth wards of Boscombe East, Boscombe West, Littledown, Moordown, Muscliff, Queen’s Park, Southbourne, Strouden Park, and West Southbourne.
2010–present: The Borough of Bournemouth wards of Boscombe East, Boscombe West, East Cliff and Springbourne, East Southbourne and Tuckton, Littledown and Iford, Moordown, Queen’s Park, Strouden Park, Throop and Muscliff, and West Southbourne.
The constituency is based around the eastern portion of Bournemouth, in Dorset, including the Southbourne district at the border of Christchurch, Boscombe, Throop, and Queen's Park.
Following boundary changes enacted at the 2010 United Kingdom general election, the western boundary of the constituency changed so that it aligned with ward boundaries (which had changed since the constituency boundary changes of the 1990s). The main changes saw Eastcliff brought into the constituency with the loss of part of east Winton.
Bournemouth town centre was in this constituency from 1983 to 1997.
Members of Parliament
| Election | Member[3] | Party | Notes | |
|---|---|---|---|---|
| Feb 1974 | John Cordle | Conservative | Resigned 1977 | |
| 1977 by-election | David Atkinson | Conservative | ||
| 2005 | Tobias Ellwood | Conservative | ||
Elections
Elections in the 2010s
| Party | Candidate | Votes | % | ± | |
|---|---|---|---|---|---|
| Conservative | Tobias Ellwood [6] | 22,060 | 49.0 | +0.8 | |
| Labour | Peter Stokes | 7,448 | 16.6 | +3.4 | |
| UKIP | David Hughes [7] | 7,401 | 16.5 | +9.6 | |
| Liberal Democrat | Jon Nicholas | 3,752 | 8.4 | −22.5 | |
| Green | Alasdair Keddie[8] | 3,263 | 7.3 | N/A | |
| Independent | David Ross | 903 | 2.0 | N/A | |
| Majority | 14,612 | 32.6 | +15.1 | ||
| Turnout | 45,014 | 62.6 | +0.7 | ||
| Conservative hold | Swing | ||||
| Party | Candidate | Votes | % | ± | |
|---|---|---|---|---|---|
| Conservative | Tobias Ellwood | 21,320 | 48.4 | +3.4 | |
| Liberal Democrat | Lisa Northover | 13,592 | 30.9 | −0.2 | |
| Labour | David Llewellyn Kelsey Stokes | 5,836 | 13.3 | −5.8 | |
| UKIP | David Hughes | 3,027 | 6.9 | +2.1 | |
| Independent | Steven Humphrey | 249 | 0.6 | +0.6 | |
| Majority | 7,728 | 17.5 | |||
| Turnout | 44,024 | 61.9 | +2.9 | ||
| Conservative hold | Swing | +1.8 | |||
Elections in the 2000s
| Party | Candidate | Votes | % | ± | |
|---|---|---|---|---|---|
| Conservative | Tobias Ellwood | 16,925 | 45.0 | +1.7 | |
| Liberal Democrat | Andrew Charles William Garratt | 11,681 | 31.1 | −2.6 | |
| Labour | David Llewellyn Kelsey Stokes | 7,191 | 19.1 | −0.8 | |
| UKIP | Thomas Edward Richard Collier | 1,802 | 4.8 | +1.7 | |
| Majority | 5,244 | 13.9 | |||
| Turnout | 37,599 | 59.3 | +1.1 | ||
| Conservative hold | Swing | +2.2 | |||
| Party | Candidate | Votes | % | ± | |
|---|---|---|---|---|---|
| Conservative | David Anthony Atkinson | 15,501 | 43.3 | +1.9 | |
| Liberal Democrat | Andrew Charles William Garratt | 12,067 | 33.7 | +2.3 | |
| Labour | Paul Matthew Nicholson | 7,107 | 19.9 | −1.3 | |
| UKIP | George Frederick John Chamberlaine | 1,124 | 3.1 | +1.3 | |
| Majority | 3,434 | 9.6 | |||
| Turnout | 35,799 | 58.2 | −12.0 | ||
| Conservative hold | Swing | ||||
Elections in the 1990s
| Party | Candidate | Votes | % | ± | |
|---|---|---|---|---|---|
| Conservative | David Anthony Atkinson | 17,997 | 41.4 | −14.0 | |
| Liberal Democrat | Douglas Eyre | 13,655 | 31.4 | +0.4 | |
| Labour | Mrs. Jessica Lilias Stevens | 9,181 | 21.2 | +8.3 | |
| Referendum | Alan Musgrave-Scott | 1,808 | 4.2 | N/A | |
| UKIP | Kenneth Fred Benney | 791 | 1.8 | N/A | |
| Majority | 4,346 | 10.01 | |||
| Turnout | 43,432 | 70.21 | |||
| Conservative hold | Swing | ||||
| Party | Candidate | Votes | % | ± | |
|---|---|---|---|---|---|
| Conservative | David Anthony Atkinson | 30,820 | 56.4 | −1.9 | |
| Liberal Democrat | Neil Robert Russell | 15,998 | 29.3 | −1.4 | |
| Labour | Peter John Brushett | 7,541 | 13.8 | +2.7 | |
| Natural Law | Mrs Susan Teresa Holmes | 329 | 0.6 | N/A | |
| Majority | 14,822 | 27.1 | −0.6 | ||
| Turnout | 54,688 | 72.8 | +2.3 | ||
| Conservative hold | Swing | -0.3 | |||
Elections in the 1980s
| Party | Candidate | Votes | % | ± | |
|---|---|---|---|---|---|
| Conservative | David Anthony Atkinson | 30,925 | 58.3 | +4.8 | |
| Liberal | Dr. John Millward | 16,242 | 30.6 | +1.4 | |
| Labour | Ian Arundel Taylor | 5,885 | 11.1 | +2.6 | |
| Majority | 14,683 | 27.7 | |||
| Turnout | 53,052 | 70.5 | |||
| Conservative hold | Swing | ||||
| Party | Candidate | Votes | % | ± | |
|---|---|---|---|---|---|
| Conservative | David Anthony Atkinson | 25,176 | 53.5 | −9.2 | |
| Liberal | Dr. John Millward | 13,760 | 29.2 | +12.7 | |
| Labour | Michael John Shutler | 4,026 | 8.5 | −9.9 | |
| Independent Conservative | Phyllis Margaret Hogarth | 3,644 | 7.7 | N/A | |
| Ecology | Trevor Douglas Dykes | 273 | 0.6 | ||
| Monster Raving Loony | Jeremy Stooks | 225 | 0.5 | N/A | |
| Majority | 11,416 | 24.3 | |||
| Turnout | 47,104 | 66.6 | |||
| Conservative hold | Swing | −11.0 | |||
Elections in the 1970s
| Party | Candidate | Votes | % | ± | |
|---|---|---|---|---|---|
| Conservative | David Anthony Atkinson | 25,808 | 62.6 | +10.8 | |
| Labour | Joseph Goodwin | 7,553 | 18.3 | −2.7 | |
| Liberal | Donald Matthew | 6,738 | 16.4 | −8.8 | |
| New Britain | John Philip Pratt | 581 | 1.4 | N/A | |
| Ecology | Jacqueline Mary Dempsey | 523 | 1.3 | N/A | |
| Majority | 18,255 | 44.3 | |||
| Turnout | 41,203 | 73.1 | |||
| Conservative hold | Swing | ||||
| Party | Candidate | Votes | % | ± | |
|---|---|---|---|---|---|
| Conservative | David Anthony Atkinson | 15,235 | 63.4 | +11.7 | |
| Labour | Joseph Goodwin | 3,684 | 15.3 | −5.6 | |
| Liberal | Donald Matthew | 3,212 | 13.4 | −11.9 | |
| New Britain | John Philip Pratt | 1,127 | 4.7 | N/A | |
| National Front | Kenneth Roderick McKilliam | 725 | 3.0 | +1.0 | |
| International Marxist | Brian Heron | 494 | 1.4 | N/A | |
| Democratic Monarchist, Public Safety, White Resident | Bill Boaks | 42 | 0.2 | N/A | |
| Majority | 11,551 | 47.1 | +20.6 | ||
| Turnout | 24,519 | 24.5 | |||
| Conservative hold | Swing | ||||
| Party | Candidate | Votes | % | ± | |
|---|---|---|---|---|---|
| Conservative | John Cordle | 20,790 | 51.8 | +1.6 | |
| Liberal | George Hamilton Musgrave | 10,129 | 25.2 | −4.0 | |
| Labour | Desmond Earle Lock | 8,422 | 21.0 | +4.3 | |
| National Front | Michael John Hayes | 828 | 2.1 | +0.2 | |
| Majority | 10,661 | 26,5 | +5.6 | ||
| Turnout | 40,149 | 70.5 | −8.1 | ||
| Conservative hold | Swing | N/A | |||
| Party | Candidate | Votes | % | ± | |
|---|---|---|---|---|---|
| Conservative | John Cordle | 22,319 | 50.2 | N/A | |
| Liberal | George Hamilton Musgrave | 13,005 | 29.3 | N/A | |
| Labour | Desmond Earle Lock | 7,423 | 16.7 | N/A | |
| National Front | Michael John Hayes | 875 | 2.0 | N/A | |
| Anti-EEC | Alan Stanley Reynolds | 834 | 1.9 | N/A | |
| Majority | 9,314 | 20.95 | N/A | ||
| Turnout | 44,456 | 78.6 | N/A | ||
| Conservative win (new seat) | |||||
See also
Notes and references
- ↑ "Bournemouth East: Usual Resident Population, 2011". Neighbourhood Statistics. Office for National Statistics. Retrieved 1 February 2015.
- ↑ "Electorate Figures – Boundary Commission for England". 2011 Electorate Figures. Boundary Commission for England. 4 March 2011. Archived from the original on 6 November 2010. Retrieved 13 March 2011.
- ↑ Leigh Rayment's Historical List of MPs – Constituencies beginning with "B" (part 4)
- ↑ "Election Data 2015". Electoral Calculus. Archived from the original on 17 October 2015. Retrieved 17 October 2015.
- ↑ "Statement of Persons Nominated" (PDF). Bournemouth Borough Council. 9 April 2015. Retrieved 18 April 2015.
- ↑ http://electionresults.blogspot.co.uk/2013/04/bournemouth-east-2015.html
- ↑ http://electionresults.blogspot.co.uk/2013/04/bournemouth-east-2015.html
- ↑ http://sedorset.greenparty.org.uk/news/2015/02/09/dorset-greens-make-history/
- ↑ "Election Data 2010". Electoral Calculus. Archived from the original on 26 July 2013. Retrieved 17 October 2015.
- ↑ "Election Data 2005". Electoral Calculus. Archived from the original on 15 October 2011. Retrieved 18 October 2015.
- ↑ "Election Data 2001". Electoral Calculus. Archived from the original on 15 October 2011. Retrieved 18 October 2015.
- ↑ "Election Data 1997". Electoral Calculus. Archived from the original on 15 October 2011. Retrieved 18 October 2015.
- ↑ "Election Data 1992". Electoral Calculus. Archived from the original on 15 October 2011. Retrieved 18 October 2015.
- ↑ "Politics Resources". Election 1992. Politics Resources. 9 April 1992. Retrieved 6 December 2010.
- ↑ "Election Data 1987". Electoral Calculus. Archived from the original on 15 October 2011. Retrieved 18 October 2015.
- ↑ "Election Data 1983". Electoral Calculus. Archived from the original on 15 October 2011. Retrieved 18 October 2015.
External links
- nomis Constituency Profile for Bournemouth East — presenting data from the ONS annual population survey and other official statistics.