North Cornwall (UK Parliament constituency)
Coordinates: 50°41′20″N 4°35′38″W / 50.689°N 4.594°W
| North Cornwall | |
|---|---|
|
County constituency for the House of Commons | |
|
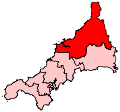
Boundary of North Cornwall in Cornwall for the 2010 general election. | |
|
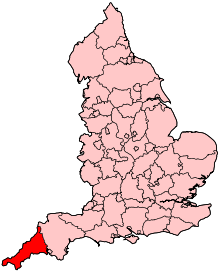
Location of Cornwall within England. | |
| County | Cornwall |
| Electorate | 68,206 (December 2010)[1] |
| Major settlements | Bodmin, Bude, Camelford, Launceston, Padstow and Wadebridge |
| Current constituency | |
| Created | 1918 |
| Member of parliament | Scott Mann (Conservative) |
| Number of members | One |
| Created from | Launceston |
| Overlaps | |
| European Parliament constituency | South West England |


North Cornwall is a constituency[n 1] represented in the House of Commons of the UK Parliament by Scott Mann, a Conservative.[n 2]
History
This constituency was created under the Representation of the People Act 1918.[2]
Boundaries
1918-1950: The Municipal Borough of Launceston, the Urban Districts of Newquay, Padstow, Stratton and Bude, and Wadebridge, the Rural Districts of Calstock, Camelford, Launceston, St Columb Major, and Stratton, and parts of the Rural Districts of Bodmin and Holsworthy (these districts such as Whitstone and Week St Mary were on the Cornish side of the border).
1950-1974: The Municipal Borough of Launceston, the Urban Districts of Bude-Stratton, Newquay, and Padstow, the Rural Districts of Camelford, Launceston, and Stratton, and parts of the Rural Districts of St Austell and Wadebridge.
1974-1983: The Municipal Borough of Launceston, the Urban Districts of Bude-Stratton and Newquay, the Rural Districts of Camelford, Launceston, and Stratton, and parts of the Rural Districts of St Austell, and Wadebridge and Padstow.
1983-2010: The District of North Cornwall wards of Allan, Altarnun, Bodmin St Mary's, Bodmin St Petroc, Bude and Poughill, Camelford, Grenville, Lanivet, Launceston North, Launceston South, Lesnewth, North Petherwin, Ottery, Padstow and St Merryn, Penfound, Rumford, St Breward, St Endellion, St Minver, St Teath, South Petherwin, Stratton, Tintagel, Trigg, Wadebridge, and Week St Mary, and the Borough of Restormel wards of Edgcumbe, Gannel, Rialton, St Columb, and St Enoder.
2010–present: The District of North Cornwall.
Several former borough constituencies lay within the area of the current constituency, most of which were abolished as 'rotten boroughs' by the Great Reform Act, 1832:
- Bossiney (abolished 1832)
- Camelford (abolished 1832)
- Launceston (abolished 1885)
- Newport (abolished 1832 - settlement now a suburb of Launceston).
Members of Parliament
| Election | Member[3] | Party | |
|---|---|---|---|
| 1918 | Sir George Croydon Marks | Liberal | |
| 1924 | Alfred Martyn Williams | Conservative | |
| 1929 | Sir Donald Maclean | Liberal | |
| 1932 by-election | Sir Francis Dyke Acland | Liberal | |
| 1939 by-election | Thomas Lewis Horabin | Liberal | |
| 1946 | Independent | ||
| 1947 | Labour | ||
| 1950 | Sir Harold Roper | Conservative | |
| 1959 | James Scott-Hopkins | Conservative | |
| 1966 | John Pardoe | Liberal | |
| 1979 | Gerry Neale | Conservative[n 3] | |
| 1992 | Paul Tyler | Liberal Democrat[n 4] | |
| 2005 | Dan Rogerson | Liberal Democrat | |
| 2015 | Scott Mann | Conservative | |
Elections
Elections in the 2010s
| Party | Candidate | Votes | % | ± | |
|---|---|---|---|---|---|
| Conservative | Scott Leslie Mann | 21,689 | 45.0 | +3.3 | |
| Liberal Democrat | Dan Rogerson | 15,068 | 31.2 | −16.8 | |
| UKIP | Julie Lingard | 6,121 | 12.7 | +7.8 | |
| Labour | John Whitby | 2,621 | 5.4 | +1.2 | |
| Green | Amanda Pennington | 2,063 | 4.3 | +4.3 | |
| Mebyon Kernow | Jerry Jefferies | 631 | 1.3 | +0.2 | |
| Restore the Family | John Allman | 52 | 0.1 | +0.1 | |
| Majority | 6,621 | 13.7 | |||
| Turnout | 48,245 | 71.8 | +3.6 | ||
| Conservative gain from Liberal Democrat | Swing | ||||
| Party | Candidate | Votes | % | ± | |
|---|---|---|---|---|---|
| Liberal Democrat | Dan Rogerson | 22,512 | 48.1 | +5.7 | |
| Conservative | Sian Flynn | 19,531 | 41.7 | +6.3 | |
| UKIP | Miriel O'Connor | 2,300 | 4.9 | −0.8 | |
| Labour | Janet Hulme | 1,971 | 4.2 | −8.3 | |
| Mebyon Kernow | Joanie Willet | 530 | 1.1 | −2.1 | |
| Majority | 2,981 | 6.4 | |||
| Turnout | 46,844 | 68.2 | +3.7 | ||
| Liberal Democrat hold | Swing | −0.3 | |||
Elections in the 2000s
| Party | Candidate | Votes | % | ± | |
|---|---|---|---|---|---|
| Liberal Democrat | Dan Rogerson | 23,842 | 42.6 | −9.4 | |
| Conservative | Mark Formosa | 20,766 | 37.1 | +3.3 | |
| Labour | David Acton | 6,636 | 11.9 | +2.2 | |
| UKIP | David Campbell-Bannerman | 3,063 | 5.5 | +1.1 | |
| Mebyon Kernow | Dick Cole | 1,351 | 2.4 | N/A | |
| Veritas | Alan Eastwood | 324 | 0.6 | N/A | |
| Majority | 3,076 | 5.5 | |||
| Turnout | 55,982 | 64.5 | +0.7 | ||
| Liberal Democrat hold | Swing | −6.4 | |||
| Party | Candidate | Votes | % | ± | |
|---|---|---|---|---|---|
| Liberal Democrat | Paul Tyler | 28,082 | 52.0 | −1.1 | |
| Conservative | John Weller | 18,250 | 33.8 | +4.3 | |
| Labour | Michael Goodman | 5,257 | 9.7 | +0.3 | |
| UKIP | Steve Protz | 2,394 | 4.4 | N/A | |
| Majority | 9,832 | 18.2 | |||
| Turnout | 53,983 | 63.8 | −9.3 | ||
| Liberal Democrat hold | Swing | −2.7 | |||
Elections in the 1990s
| Party | Candidate | Votes | % | ± | |
|---|---|---|---|---|---|
| Liberal Democrat | Paul Tyler | 31,100 | 53.2 | +5.8 | |
| Conservative | Nigel Guy Thornton Linacre | 17,253 | 29.5 | −14.8 | |
| Labour | Anne Elizabeth Lindo | 5,523 | 9.4 | +2.9 | |
| Referendum | Felicity Anne Odam | 3,636 | 6.2 | N/A | |
| Mebyon Kernow | John Bolitho | 645 | 1.1 | N/A | |
| Liberal | Rif Winfield | 186 | 0.3 | −0.8 | |
| Natural Law | Nicholas John Creswell | 152 | 0.3 | +0.1 | |
| Majority | 13,847 | 23.7 | |||
| Turnout | 58,495 | 73.05 | |||
| Liberal Democrat hold | Swing | +10.3[n 5] | |||
| Party | Candidate | Votes | % | ± | |
|---|---|---|---|---|---|
| Liberal Democrat | Paul Tyler | 29,696 | 47.4 | +5.5 | |
| Conservative | Sir Gerry Neale | 27,775 | 44.3 | −7.4 | |
| Labour | Frank R. Jordan | 4,103 | 6.6 | +0.1 | |
| Liberal | Philip John Andrews | 678 | 1.1 | −40.8 | |
| Independent | Geoffrey Rowe | 276 | 0.4 | +0.4 | |
| Natural Law | Mrs Robyn Helen Treadwell | 112 | 0.2 | +0.2 | |
| Majority | 1,921 | 3.1 | −6.8 | ||
| Turnout | 62,640 | 82.1 | +2.3 | ||
| Liberal Democrat gain from Conservative | Swing | +6.5 | |||
Elections in the 1980s
| Party | Candidate | Votes | % | ± | |
|---|---|---|---|---|---|
| Conservative | Sir Gerry Neale | 29,862 | 51.7 | −0.7 | |
| Liberal | Michael Norman Mitchell | 24,180 | 41.9 | −1.1 | |
| Labour | Christine Janet Herries | 3,719 | 6.4 | +2.5 | |
| Majority | 5,682 | 9.8 | |||
| Turnout | 79.8 | ||||
| Conservative hold | Swing | ||||
| Party | Candidate | Votes | % | ± | |
|---|---|---|---|---|---|
| Conservative | Sir Gerry Neale | 28,146 | 52.4 | +0.8 | |
| Liberal | David John Chambers | 23,087 | 43.0 | −0.8 | |
| Labour | James Colin Hayday | 2,096 | 3.9 | −0.7 | |
| Cornish Nationalist | James Charles Arthur Whetter | 364 | 0.4 | N/A | |
| Majority | 5,059 | 9.4 | |||
| Turnout | 80.4 | ||||
| Conservative hold | Swing | ||||
Elections in the 1970s
| Party | Candidate | Votes | % | ± | |
|---|---|---|---|---|---|
| Conservative | Sir Gerry Neale | 24,489 | 51.7 | +9.7 | |
| Liberal | John Wentworth Pardoe | 20,742 | 43.75 | −7.5 | |
| Labour | R.B. Tremlett | 1,514 | 3.2 | −3.2 | |
| Ecology | J. Faull | 442 | 0.9 | N/A | |
| National Front | R. Bridgwater | 224 | 0.5 | N/A | |
| Majority | 3,747 | 7.90 | |||
| Turnout | 86.1 | ||||
| Conservative gain from Liberal | Swing | +8.58 | |||
| Party | Candidate | Votes | % | ± | |
|---|---|---|---|---|---|
| Liberal | John Wentworth Pardoe | 21,368 | 51.25 | -6.65 | |
| Conservative | Gerry Neale | 17,512 | 42.00 | ||
| Labour | R. Tremlett | 2,663 | 6.4 | ||
| Anti Party System | R.J. Bridgwater | 148 | 0.35 | ||
| Majority | 3,856 | 9.25 | |||
| Turnout | 80.52 | ||||
| Liberal hold | Swing | ||||
- February 1974; new constituency boundaries applied.
| Party | Candidate | Votes | % | ± | |
|---|---|---|---|---|---|
| Liberal | John Wentworth Pardoe | 25,667 | 57.90 | ||
| Conservative | Trixie Gardner | 16,938 | 38.21 | ||
| Labour | J.B. Benjamin | 1,726 | 3.89 | ||
| Majority | 8,729 | 19.69 | |||
| Turnout | 86.29 | ||||
| Liberal hold | Swing | ||||
| Party | Candidate | Votes | % | ± | |
|---|---|---|---|---|---|
| Liberal | John Wentworth Pardoe | 19,863 | 48.64 | ||
| Conservative | Simon James Day | 19,223 | 47.10 | ||
| Labour | Ernest William J Hill | 1,741 | 4.26 | ||
| Majority | 630 | 1.54 | |||
| Turnout | 85.11 | ||||
| Liberal hold | Swing | ||||
Elections in the 1960s
| Party | Candidate | Votes | % | ± | |
|---|---|---|---|---|---|
| Liberal | John Wentworth Pardoe | 18,460 | 48.50 | ||
| Conservative | James Sidney Rawdon Scott-Hopkins | 16,952 | 44.54 | ||
| Labour | Reginald S. Wills | 2,647 | 6.95 | ||
| Majority | 1,508 | 3.96 | |||
| Turnout | 87.53 | ||||
| Liberal gain from Conservative | Swing | ||||
| Party | Candidate | Votes | % | ± | |
|---|---|---|---|---|---|
| Conservative | James Sidney Rawdon Scott-Hopkins | 16,352 | 45.68 | ||
| Liberal | Charles Meddon Karslake Bruton | 15,683 | 43.81 | ||
| Labour | Raymond S Dash | 3,497 | 9.77 | ||
| Independent | Edward George C Voullaire | 265 | 0.74 | ||
| Majority | 669 | 1.87 | |||
| Turnout | 83.10 | ||||
| Conservative hold | Swing | ||||
Elections in the 1950s
| Party | Candidate | Votes | % | ± | |
|---|---|---|---|---|---|
| Conservative | James Sidney Rawdon Scott-Hopkins | 16,701 | 46.65 | ||
| Liberal | Edwin Thomas Malindine | 15,712 | 43.89 | ||
| Labour | William Carlo Ferman | 3,389 | 9.47 | ||
| Majority | 989 | 2.76 | |||
| Turnout | 83.72 | ||||
| Conservative hold | Swing | ||||
| Party | Candidate | Votes | % | ± | |
|---|---|---|---|---|---|
| Conservative | Sir Harold Roper | 16,824 | 47.38 | ||
| Liberal | Edwin Thomas Malindine | 15,220 | 42.86 | ||
| Labour | Vernon Eric Cornford | 3,465 | 9.76 | ||
| Majority | 1,604 | 4.52 | |||
| Turnout | 82.30 | ||||
| Conservative hold | Swing | ||||
| Party | Candidate | Votes | % | ± | |
|---|---|---|---|---|---|
| Conservative | Sir Harold Roper | 18,009 | 48.77 | ||
| Liberal | Dingle Mackintosh Foot | 12,869 | 34.85 | ||
| Labour | William Carlo Ferman | 6,049 | 16.38 | ||
| Majority | 5,140 | 13.92 | |||
| Turnout | 85.71 | ||||
| Conservative hold | Swing | ||||
| Party | Candidate | Votes | % | ± | |
|---|---|---|---|---|---|
| Conservative | Sir Harold Roper | 17,059 | 46.6 | ||
| Liberal | Dingle Mackintosh Foot | 13,987 | 38.3 | ||
| Labour | Herbert Leslie Richardson | 5,521 | 15.1 | ||
| Majority | 3,072 | 8.4 | |||
| Turnout | 85.9 | ||||
| Conservative gain from Liberal | Swing | ||||
Elections in the 1940s
| Party | Candidate | Votes | % | ± | |
|---|---|---|---|---|---|
| Liberal | Thomas Lewis Horabin | 18,836 | 52.9 | +0.7 | |
| Conservative | Thomas Percy Fulford | 16,171 | 45.4 | -2.4 | |
| Independent Labour | John Hazlewood Worrall | 626 | 1.8 | +1.8 | |
| Majority | 2,665 | 7.5 | +3.1 | ||
| Turnout | 35,633 | 72.7 | -6.6 | ||
| Liberal hold | Swing | ||||
Elections in the 1930s
| Party | Candidate | Votes | % | ± | |
|---|---|---|---|---|---|
| Liberal | Thomas Lewis Horabin | 17,072 | 52.2 | +0.9 | |
| Conservative | Edward Robin Whitehouse | 15,608 | 47.8 | -0.9 | |
| Majority | 1,464 | 4.4 | +1.8 | ||
| Turnout | 32,680 | 79.3 | -0.6 | ||
| Liberal hold | Swing | +0.9 | |||
| Party | Candidate | Votes | % | ± | |
|---|---|---|---|---|---|
| Liberal | Rt Hon. Sir Francis Dyke Acland | 16,872 | 51.3 | -1.1 | |
| Conservative | Edward Robin Whitehouse | 16,036 | 48.7 | +1.1 | |
| Majority | 836 | 2.6 | -2.2 | ||
| Turnout | 32,908 | 79.9 | -0.9 | ||
| Liberal hold | Swing | -1.1 | |||
| Party | Candidate | Votes | % | ± | |
|---|---|---|---|---|---|
| Liberal | Rt Hon. Sir Francis Dyke Acland | 16,933 | 52.4 | +3.3 | |
| Conservative | Alfred Martyn Williams | 15,387 | 47.6 | +2.3 | |
| Majority | 1,546 | 4.8 | +1.0 | ||
| Turnout | 32,320 | 80.8 | -4.9 | ||
| Liberal hold | Swing | ||||
- Death of Maclean 15 June 1932
| Party | Candidate | Votes | % | ± | |
|---|---|---|---|---|---|
| Liberal | Rt Hon. Sir Donald Maclean | 16,867 | 49.1 | -0.6 | |
| Conservative | Alfred Martyn Williams | 16,526 | 45.3 | +3.0 | |
| Labour | Arthur Bennett | 1,907 | 5.6 | -2.4 | |
| Majority | 1,341 | 3.8 | -3.6 | ||
| Turnout | 35,300 | 85.7 | -0.4 | ||
| Liberal hold | Swing | ||||
Elections in the 1920s
| Party | Candidate | Votes | % | ± | |
|---|---|---|---|---|---|
| Liberal | Rt Hon. Sir Donald Maclean | 16,586 | 49.7 | +3.3 | |
| Unionist | Alfred Martyn Williams | 14,095 | 42.3 | -11.3 | |
| Labour | F. E. Church | 2,654 | 8.0 | n/a | |
| Majority | 2,491 | 7.4 | 14.6 | ||
| Turnout | 33,335 | 86.1 | +8.1 | ||
| Liberal gain from Unionist | Swing | +7.3 | |||
| Party | Candidate | Votes | % | ± | |
|---|---|---|---|---|---|
| Unionist | Alfred Martyn Williams | 12,639 | 53.6 | +10.1 | |
| Liberal | Sir George Croydon Marks | 10,927 | 46.4 | -10.1 | |
| Majority | 1,712 | 7.2 | 20.2 | ||
| Turnout | 23,566 | 78.0 | |||
| Unionist gain from Liberal | Swing | ||||
| Party | Candidate | Votes | % | ± | |
|---|---|---|---|---|---|
| Liberal | Sir George Croydon Marks | 12,434 | 56.5 | n/a | |
| Unionist | Charles Alexander Petrie | 9,581 | 43.5 | n/a | |
| Majority | 2,853 | 13.0 | n/a | ||
| Turnout | 22,015 | 75.6 | n/a | ||
| Liberal hold | Swing | n/a | |||
| Party | Candidate | Votes | % | ± | |
|---|---|---|---|---|---|
| National Liberal | Sir George Croydon Marks | unopposed | n/a | n/a | |
| National Liberal hold | Swing | n/a | |||
Elections in the 1910s
| Party | Candidate | Votes | % | ± | |
|---|---|---|---|---|---|
| Liberal | Sir George Croydon Marks | unopposed | n/a | n/a | |
| Liberal win | |||||
See also
Notes and references
- ↑ A county constituency (for the purposes of election expenses and type of returning officer)
- ↑ As with all constituencies, the constituency elects one Member of Parliament (MP) by the first past the post system of election at least every five years.
- ↑ Knighted in 1991
- ↑ Granted a peerage in 2005
- ↑ The largest two-party swing in this election was (Con-Ref): 10.5%
References
- ↑ "Electorate Figures - Boundary Commission for England". 2011 Electorate Figures. Boundary Commission for England. 4 March 2011. Retrieved 13 March 2011.
- ↑ "The Representation of the people act, 1918 : with explanatory notes". http://archive.org. External link in
|journal=(help) - ↑ Leigh Rayment's Historical List of MPs – Constituencies beginning with "C" (part 6)
- ↑ "Election Data 2015". Electoral Calculus. Archived from the original on 17 October 2015. Retrieved 17 October 2015.
- ↑ "Election Data 2010". Electoral Calculus. Archived from the original on 17 October 2015. Retrieved 17 October 2015.
- ↑ Lavery, Kevin (20 April 2010). "North Cornwall statement of persons nominated and notice of poll" (MSWord). Acting Returning Officer. Cornwall Council. Retrieved 20 April 2010.
- ↑ "Election Data 2005". Electoral Calculus. Archived from the original on 15 October 2011. Retrieved 18 October 2015.
- ↑ "Election Data 2001". Electoral Calculus. Archived from the original on 15 October 2011. Retrieved 18 October 2015.
- ↑ "Election Data 1997". Electoral Calculus. Archived from the original on 15 October 2011. Retrieved 18 October 2015.
- ↑ "Election Data 1992". Electoral Calculus. Archived from the original on 15 October 2011. Retrieved 18 October 2015.
- ↑ "Politics Resources". Election 1992. Politics Resources. 9 April 1992. Retrieved 2010-12-06.
- ↑ "Election Data 1987". Electoral Calculus. Archived from the original on 15 October 2011. Retrieved 18 October 2015.
- ↑ "Election Data 1983". Electoral Calculus. Archived from the original on 15 October 2011. Retrieved 18 October 2015.
Sources
- British Parliamentary Election Results 1918-1949, compiled and edited by F.W.S. Craig (Macmillan Press 1977)