Russell County, Alabama
| Russell County, Alabama | |
|---|---|
 County courthouse in Phenix City | |
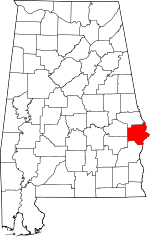 Location in the U.S. state of Alabama | |
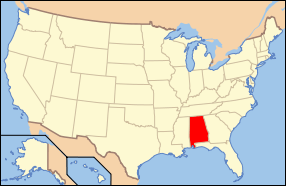 Alabama's location in the U.S. | |
| Founded | December 18, 1832 |
| Named for | Gilbert C. Russell |
| Seat | Phenix City |
| Largest city | Phenix City |
| Area | |
| • Total | 647 sq mi (1,676 km2) |
| • Land | 641 sq mi (1,660 km2) |
| • Water | 6.1 sq mi (16 km2), 0.9% |
| Population (est.) | |
| • (2015) | 59,660 |
| • Density | 93/sq mi (36/km²) |
| Congressional district | 3rd |
| Time zone | Central: UTC-6/-5 |
| Website |
www |
|
Footnotes:
| |
Russell County is a county of the U.S. state of Alabama. As of the 2010 census, the population was 52,947.[1] Its county seat is Phenix City.[2] Its name is in honor of Colonel Gilbert C. Russell, who fought in the wars against the Creek Indians.
Russell County is part of the Columbus, GA-AL Metropolitan Statistical Area.
History
Russell County was established by an act of the state general assembly on December 18, 1832, from lands ceded to the state by the Creek Indians. The county seat has changed several times: Girard (1833–1839), Crawford originally Crockettsville (1839–1868), Seale (1868–1935) and Phenix City (1935–present). It was named for War of 1812, Col. Gilbert Christian Russell, Sr., 1782–1861, 3rd U.S. Infantry.
Geography
According to the U.S. Census Bureau, the county has a total area of 647 square miles (1,680 km2), of which 641 square miles (1,660 km2) is land and 6.1 square miles (16 km2) (0.9%) is water.[3]
Major highways
Adjacent counties
- Lee County (north)
- Muscogee County, Georgia (northeast/EST Border)
- Chattahoochee County, Georgia (east/EST Border)
- Stewart County, Georgia (southeast/EST Border)
- Barbour County (south)
- Bullock County (southwest)
- Macon County (northwest)
National protected area
Demographics
| Historical population | |||
|---|---|---|---|
| Census | Pop. | %± | |
| 1840 | 13,513 | — | |
| 1850 | 19,548 | 44.7% | |
| 1860 | 26,592 | 36.0% | |
| 1870 | 21,636 | −18.6% | |
| 1880 | 24,837 | 14.8% | |
| 1890 | 24,093 | −3.0% | |
| 1900 | 27,083 | 12.4% | |
| 1910 | 25,937 | −4.2% | |
| 1920 | 27,448 | 5.8% | |
| 1930 | 27,377 | −0.3% | |
| 1940 | 35,775 | 30.7% | |
| 1950 | 40,364 | 12.8% | |
| 1960 | 46,351 | 14.8% | |
| 1970 | 45,394 | −2.1% | |
| 1980 | 47,356 | 4.3% | |
| 1990 | 46,860 | −1.0% | |
| 2000 | 49,756 | 6.2% | |
| 2010 | 52,947 | 6.4% | |
| Est. 2015 | 59,660 | [4] | 12.7% |
| U.S. Decennial Census[5] 1790–1960[6] 1900–1990[7] 1990–2000[8] 2010–2015[1] | |||
As of the 2010 United States Census, there were 52,947 people residing in the county. 53.7% were White, 41.8% Black or African American, 0.4% Asian, 0.4% Native American, 0.2% Pacific Islander, 1.3% of some other race and 2.1% of two or more races. 3.7% were Hispanic or Latino (of any race).
As of the census of 2000, there were 49,756 people, 19,741 households, and 13,423 families residing in the county. The population density was 78 people per square mile (30/km2). There were 22,831 housing units, at an average density of 14/km2 (36/sq mi). The racial makeup of the county was: 56.69% White, 40.84% Black or African American, 0.37% Native American, 0.36% Asian, 0.07% Pacific Islander, 0.59% from other races, and 1.07% from two or more races. Nearly 1.50% of the population were Hispanic or Latino of any race.
There were 19,741 households, out of which 32.00% had children under the age of 18 living with them; 44.40% were married couples living together, 18.90% had a female householder with no husband present, and 32.00% were non-families. 28.00% of all households were made up of individuals, and 10.60% had someone living alone who was 65 years of age or older. The average household size was 2.49, and the average family size was 3.05.
In the county, the population was spread out with 26.50% under the age of 18, 9.10% from 18 to 24, 28.80% from 25 to 44, 22.40% from 45 to 64, and 13.10% who were 65 years of age or older. The median age was 35 years. For every 100 females, there were 91.00 males. For every 100 females age 18 and over, there were 85.90 males.
The median income for a household in the county was $27,492, and the median income for a family was $34,004. Males had a median income of $28,696 versus $20,882 for females. The per capita income for the county was $14,015. About 16.80% of families and 19.90% of the population were below the poverty line, including 26.50% of those under age 18 and 19.30% of those age 65 or over.
Government
| Year | GOP | DNC | Others |
|---|---|---|---|
| 2016 | 47.8% 9,210 | 49.8% 9,577 | 2.4% 465 |
| 2012 | 43.9% 8,276 | 55.6% 10,495 | 0.5% 100 |
| 2008 | 46.0% 8,705 | 53.3% 10,085 | 0.7% 125 |
| 2004 | 49.6% 8,337 | 49.8% 8,375 | 0.6% 97 |
| 2000 | 42.0% 6,198 | 56.8% 8,396 | 1.2% 181 |
Communities
City
- Phenix City (county seat; partly in Lee County)
Town
Census-designated place
Unincorporated communities
Former City
- Girard (merged with Phenix City in 1923)
Notable person
- James Abercrombie, United States Congressman from Alabama, resided here.[10]
See also
- National Register of Historic Places listings in Russell County, Alabama
- Properties on the Alabama Register of Landmarks and Heritage in Russell County, Alabama
Notes
- 1 2 "State & County QuickFacts". United States Census Bureau. Retrieved May 17, 2014.
- ↑ "Find a County". National Association of Counties. Retrieved 2011-06-07.
- ↑ "2010 Census Gazetteer Files". United States Census Bureau. August 22, 2012. Retrieved August 22, 2015.
- ↑ "County Totals Dataset: Population, Population Change and Estimated Components of Population Change: April 1, 2010 to July 1, 2015". Retrieved July 2, 2016.
- ↑ "U.S. Decennial Census". United States Census Bureau. Retrieved August 22, 2015.
- ↑ "Historical Census Browser". University of Virginia Library. Retrieved August 22, 2015.
- ↑ Forstall, Richard L., ed. (March 24, 1995). "Population of Counties by Decennial Census: 1900 to 1990". United States Census Bureau. Retrieved August 22, 2015.
- ↑ "Census 2000 PHC-T-4. Ranking Tables for Counties: 1990 and 2000" (PDF). United States Census Bureau. April 2, 2001. Retrieved August 22, 2015.
- ↑ "Dave Leip's Atlas of U.S. Presidential Elections". Retrieved November 21, 2016.
- ↑ Who Was Who in America, Historical Volume, 1607-1896. Chicago: Marquis Who's Who. 1963.
External links
- Official Russell County website
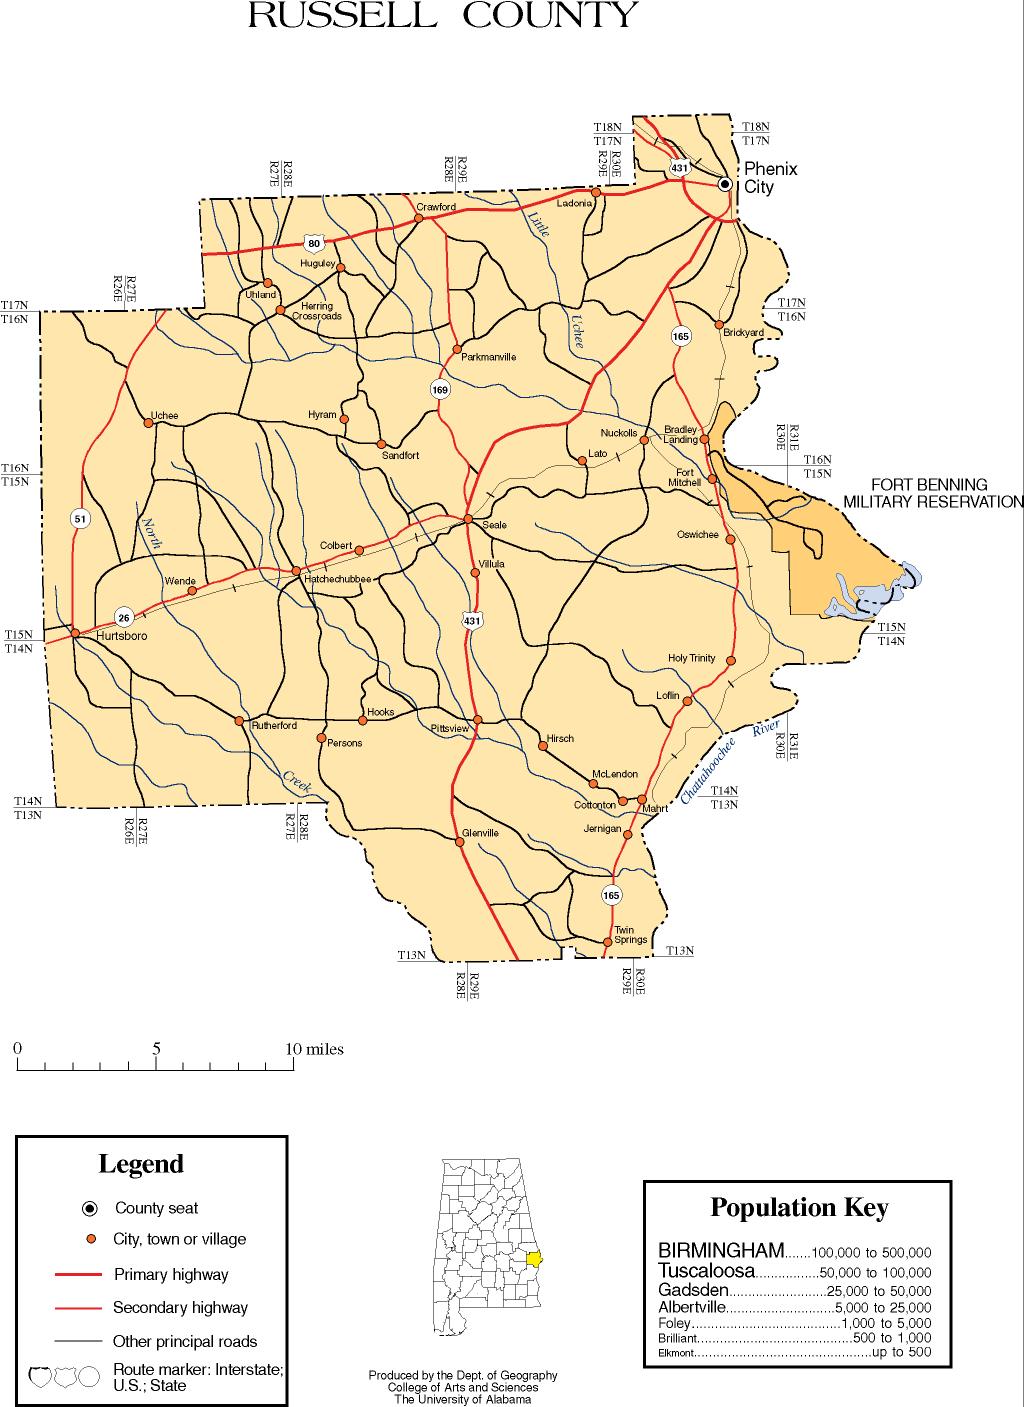
- Russell County map of roads/towns (map © 2007 Univ. of Alabama).
- Columbus Enquirer Archive Digital Library of Georgia
 |
Macon County | Lee County | Muscogee County | |
| |
Chattahoochee County | |||
| ||||
| | ||||
| Bullock County | Barbour County | Stewart County |
Municipalities and communities of Russell County, Alabama, United States | ||
|---|---|---|
| City | | |
| Town | ||
| CDP | ||
| Unincorporated communities | ||
| Former city | ||
| Footnotes | ‡This populated place also has portions in an adjacent county or counties | |
| Central cities/Largest cities | 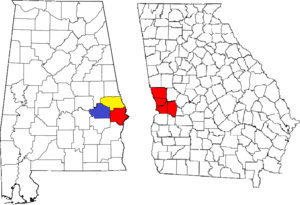 Location of the Columbus, Georgia-Auburn, Alabama CSA and its counties:
Columbus, Georgia Metropolitan Statistical Area
Auburn, Alabama Metropolitan Statistical Area
Tuskegee, Alabama Micropolitan Statistical Area (defunct) | |
|---|---|---|
| Cities in Georgia | ||
| Cities in Alabama | ||
| Counties in Georgia | ||
| Counties in Alabama | ||
Coordinates: 32°17′12″N 85°11′38″W / 32.28667°N 85.19389°W