Henry County, Alabama
| Henry County, Alabama | |
|---|---|
 Henry County Courthouse in Abbeville | |
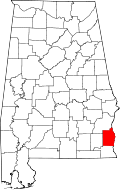 Location in the U.S. state of Alabama | |
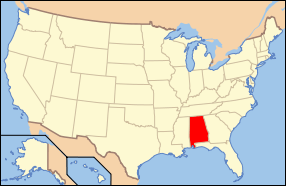 Alabama's location in the U.S. | |
| Founded | December 13, 1819 |
| Named for | Patrick Henry |
| Seat | Abbeville |
| Largest city | Headland |
| Area | |
| • Total | 568 sq mi (1,471 km2) |
| • Land | 562 sq mi (1,456 km2) |
| • Water | 6.6 sq mi (17 km2), 1.2% |
| Population (est.) | |
| • (2015) | 17,221 |
| • Density | 31/sq mi (12/km²) |
| Congressional district | 2nd |
| Time zone | Central: UTC-6/-5 |
| Website |
www |
|
Footnotes:
| |
Henry County is a county of the U.S. state of Alabama. As of the 2010 census, its population was 17,302.[1] Its county seat is Abbeville.[2] Its name is in honor of Patrick Henry (1736–1799), famous orator and Governor of Virginia.[3]
Henry County is part of the Dothan, AL Metropolitan Statistical Area.
History
Between 1763 and 1783, the area that is now Henry County, Alabama was under the jurisdiction of the colony of British West Florida. Henry County was established on December 13, 1819 by the Alabama Territorial Legislature. The area was ceded by the Creek Indian Nation in 1814 under the Treaty of Fort Jackson. Henry County was formed before the State of Alabama was organized. The area that includes Henry County had historically been part of the Lower Creek Confederacy. It was occupied for thousands of years before that by varying cultures of indigenous peoples. Abbeville was designated as the county seat in 1833.
Upon formation, Henry County was the largest county within Alabama, composing all or portions of the present counties of Barbour, Coffee, Covington, Crenshaw, Dale, Geneva, Houston, and Pike. When the youngest county of Houston was formed in 1903, Henry became the smallest.
After 1814, the colonial settlers' developed Franklin as the first white settlement in the Creek territory. The former river port served Abbeville on the Chattahoochee River. Much of the original Henry County was part of the original Alabama wiregrass region.
Geography
According to the U.S. Census Bureau, the county has a total area of 568 square miles (1,470 km2), of which 562 square miles (1,460 km2) is land and 6.6 square miles (17 km2) (1.2%) is water.[4] It is the fourth-smallest county in Alabama by total area.
Major highways
 U.S. Highway 431
 State Route 10
 State Route 27
 State Route 95
 State Route 134
 State Route 173
Adjacent counties
- Barbour County (north)
- Clay County, Georgia (northeast/EST Border)
- Early County, Georgia (southeast/EST Border)
- Houston County (south)
- Dale County (west)
Demographics
| Historical population | |||
|---|---|---|---|
| Census | Pop. | %± | |
| 1820 | 2,638 | — | |
| 1830 | 4,020 | 52.4% | |
| 1840 | 5,787 | 44.0% | |
| 1850 | 9,019 | 55.8% | |
| 1860 | 14,918 | 65.4% | |
| 1870 | 14,191 | −4.9% | |
| 1880 | 18,761 | 32.2% | |
| 1890 | 24,847 | 32.4% | |
| 1900 | 36,147 | 45.5% | |
| 1910 | 20,943 | −42.1% | |
| 1920 | 21,547 | 2.9% | |
| 1930 | 22,820 | 5.9% | |
| 1940 | 21,912 | −4.0% | |
| 1950 | 18,674 | −14.8% | |
| 1960 | 15,286 | −18.1% | |
| 1970 | 13,254 | −13.3% | |
| 1980 | 15,302 | 15.5% | |
| 1990 | 15,374 | 0.5% | |
| 2000 | 16,310 | 6.1% | |
| 2010 | 17,302 | 6.1% | |
| Est. 2015 | 17,221 | [5] | −0.5% |
| U.S. Decennial Census[6] 1790–1960[7] 1900–1990[8] 1990–2000[9] 2010–2015[1] | |||
As of the census[10] of 2000, there were 16,310 people, 6,525 households, and 4,730 families residing in the county. The population density was 29 people per square mile (11/km2). There were 8,037 housing units at an average density of 14 per square mile (6/km2). The racial makeup of the county was 65.67% White, 32.30% Black or African American, 0.21% Native American, 0.06% Asian, 0.02% Pacific Islander, 1.00% from other races, and 0.74% from two or more races. Nearly 1.53% of the population were Hispanic or Latino of any race.
There were 6,525 households out of which 30.50% had children under the age of 18 living with them, 53.90% were married couples living together, 14.70% had a female householder with no husband present, and 27.50% were non-families. Nearly 25.30% of all households were made up of individuals, and 12.30% had someone living alone who was 65 years of age or older. The average household size was 2.47, and the average family size was 2.95.
In the county, the population was spread out with 24.10% under the age of 18, 8.40% from 18 to 24, 25.70% from 25 to 44, 25.50% from 45 to 64, and 16.40% who were 65 years of age or older. The median age was 39 years. For every 100 females, there were 90.60 males. For every 100 females age 18 and over, there were 86.20 males.
The median income for a household in the county was $30,353, and the median income for a family was $36,555. Males had a median income of $29,189 versus $20,827 for females. The per capita income for the county was $15,681. About 14.50% of families and 19.10% of the population were below the poverty line, including 27.00% of those under age 18 and 20.60% of those age 65 or over.
2010 census
As of the census[11] of 2010, there were 17,302 people, 6,994 households, and 4,975 families residing in the county. The population density was 31 people per square mile (11.8/km2). There were 8,891 housing units at an average density of 15.6 per square mile (6/km2). The racial makeup of the county was 68.6% White, 28.6% Black or African American, 0.3% Native American, 0.3% Asian, 0.0% Pacific Islander, 1.2% from other races, and 1.0% from two or more races. Nearly 2.2% of the population were Hispanic or Latino of any race.
There were 6,994 households out of which 25.9% had children under the age of 18 living with them, 51.9% were married couples living together, 14.6% had a female householder with no husband present, and 28.9% were non-families. Nearly 25.9% of all households were made up of individuals, and 11.8% had someone living alone who was 65 years of age or older. The average household size was 2.45, and the average family size was 2.92.
In the county, the population was spread out with 22.6% under the age of 18, 6.9% from 18 to 24, 23.1% from 25 to 44, 29.7% from 45 to 64, and 17.6% who were 65 years of age or older. The median age was 42.8 years. For every 100 females, there were 92.2 males. For every 100 females age 18 and over, there were 93.1 males.
The median income for a household in the county was $38,379, and the median income for a family was $46,976. Males had a median income of $37,276 versus $26,771 for females. The per capita income for the county was $19,716. About 15.0% of families and 15.1% of the population were below the poverty line, including 19.7% of those under age 18 and 15.4% of those age 65 or over.
Government
| Year | GOP | DNC | Others |
|---|---|---|---|
| 2016 | 69.8% 5,623 | 28.4% 2,286 | 1.8% 148 |
| 2012 | 64.4% 5,605 | 35.0% 3,046 | 0.6% 49 |
| 2008 | 64.6% 5,585 | 34.9% 3,018 | 0.5% 45 |
| 2004 | 66.3% 4,881 | 33.3% 2,452 | 0.4% 28 |
| 2000 | 58.5% 4,054 | 40.1% 2,782 | 1.4% 96 |
Communities
Cities
- Abbeville (county seat)
- Dothan (partly in Dale County and Houston County)
- Headland
Towns
Unincorporated communities
See also
- American Brass Superfund site
- National Register of Historic Places listings in Henry County, Alabama
- Properties on the Alabama Register of Landmarks and Heritage in Henry County, Alabama
References
- 1 2 "State & County QuickFacts". United States Census Bureau. Retrieved May 16, 2014.
- ↑ "Find a County". National Association of Counties. Retrieved 2011-06-07.
- ↑ Gannett, Henry (1905). The Origin of Certain Place Names in the United States. Govt. Print. Off. p. 155.
- ↑ "2010 Census Gazetteer Files". United States Census Bureau. August 22, 2012. Retrieved August 22, 2015.
- ↑ "County Totals Dataset: Population, Population Change and Estimated Components of Population Change: April 1, 2010 to July 1, 2015". Retrieved July 2, 2016.
- ↑ "U.S. Decennial Census". United States Census Bureau. Retrieved August 22, 2015.
- ↑ "Historical Census Browser". University of Virginia Library. Retrieved August 22, 2015.
- ↑ Forstall, Richard L., ed. (March 24, 1995). "Population of Counties by Decennial Census: 1900 to 1990". United States Census Bureau. Retrieved August 22, 2015.
- ↑ "Census 2000 PHC-T-4. Ranking Tables for Counties: 1990 and 2000" (PDF). United States Census Bureau. April 2, 2001. Retrieved August 22, 2015.
- ↑ "American FactFinder". United States Census Bureau. Retrieved 2011-05-14.
- ↑ "American FactFinder". United States Census Bureau. Retrieved 2015-07-24.
- ↑ "Dave Leip's Atlas of U.S. Presidential Elections". Retrieved November 16, 2016.
External links
- Henry County Historical Group
- History of Henry County, Alabama, hosted at Rootsweb.
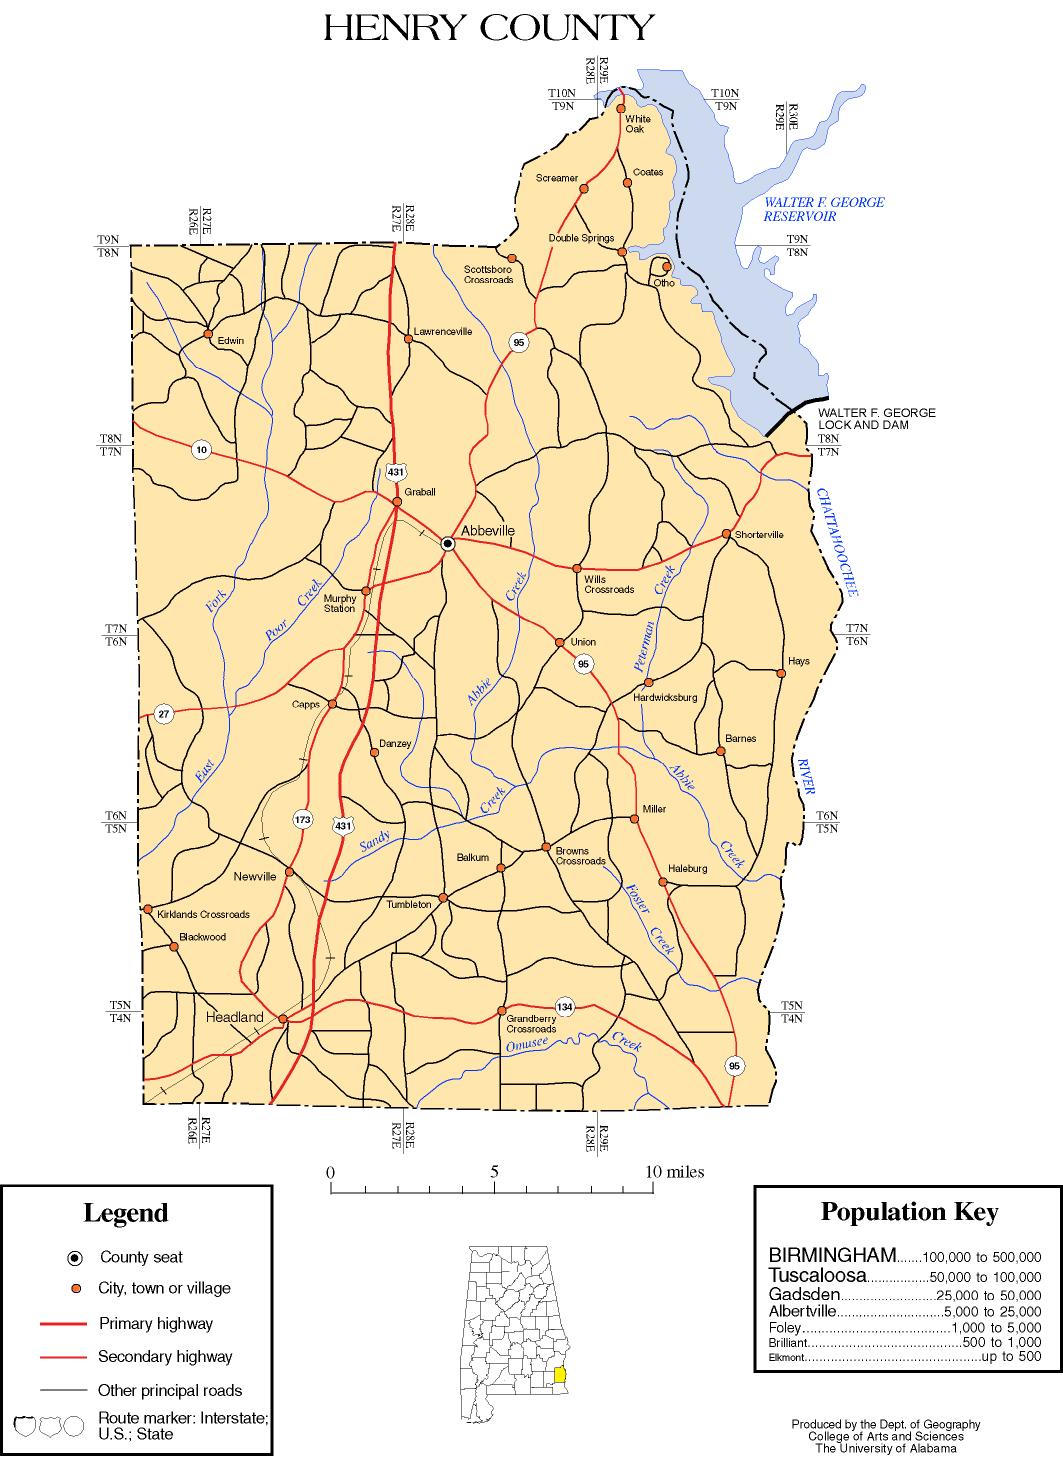
- Henry County map of roads/towns (map 2007 Univ. of Alabama).
 |
Barbour County | Clay County, Georgia | | |
| Dale County | |
|||
| ||||
| | ||||
| Houston County | Early County, Georgia |
Municipalities and communities of Henry County, Alabama, United States | ||
|---|---|---|
| Cities | | |
| Towns | ||
| Unincorporated communities | ||
| Footnotes | ‡This populated place also has portions in an adjacent county or counties | |
Coordinates: 31°30′46″N 85°14′04″W / 31.51278°N 85.23444°W