Rother Valley (UK Parliament constituency)
Coordinates: 53°25′48″N 1°21′25″W / 53.430°N 1.357°W
| Rother Valley | |
|---|---|
|
County constituency for the House of Commons | |
|
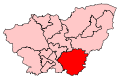
Boundary of Rother Valley in South Yorkshire. | |
|
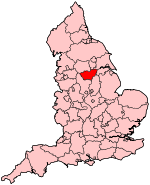
Location of South Yorkshire within England. | |
| County | South Yorkshire |
| Electorate | 73,068 (December 2010)[1] |
| Major settlements |
Maltby Rotherham (part) |
| Current constituency | |
| Created | 1918 |
| Member of parliament | Kevin Barron (Labour) |
| Number of members | One |
| Created from | Doncaster, Hallamshire and Rotherham |
| Overlaps | |
| European Parliament constituency | Yorkshire and the Humber |
Rother Valley is a constituency[n 1] represented in the House of Commons of the UK Parliament since 1983 by Kevin Barron, a member of the Labour Party.[n 2]
History
This constituency was created by the Representation of the People Act 1918. Unusually in the light of the events of the Labour Party's early 20th-century years, the seat has been represented by a member of that party continuously since the seat was formed. The size of the majorities never having been marginal[n 3] in the elections to date, this has been a safe seat for the party.
Boundaries
Rother Valley constituency covers an area in the Metropolitan Borough of Rotherham south of Rotherham itself. It is bordered by the constituencies of Bassetlaw, Bolsover, Derbyshire North East, Don Valley, Rotherham, Sheffield South East, and Wentworth and Dearne.
Boundary review
Parliament accepted the Boundary Commission's Fifth Periodic Review of Westminster constituencies which slightly altered this constituency for the 2010 general election since which it has electoral wards:
- Anston and Woodsetts, Dinnington, Hellaby, Holderness, Maltby, Rother Vale, Sitwell, and Wales in the Metropolitan Borough of Rotherham[2]
Constituency profile
The constituency consists of Census Output Areas of one local government district: a working population whose income is on average slightly below the national average and close to average reliance upon social housing.[3] At the end of 2012 the unemployment rate in the constituency stood as 4.0% of the population claiming jobseekers allowance, compared to the regional average of 4.7%. This was considerably lower than the rate in the Rotherham constituency of 7% and 9.6% male unemployment.[4]
The borough contributing to the seat has a relatively 26.6% of its population without a car compared to 20.1% in Bassetlaw and 30.3% in Sheffield. In terms of extremes of education 29.8% of the population in 2011 were without qualifications contrasted with 17.4% with level 4 qualifications or above.
In terms of tenure 65.2% of homes are owned outright or on a mortgage as at the 2011 census across the borough.[5] In the 10 years to the April 2011 Census the social rented sector saw a 4.9% reduction and the private rented sector a 5.3% increase; outright ownership saw a 3.8% increase.[5]
Members of Parliament
| Election | Member[6] | Party | |
|---|---|---|---|
| 1918 | Thomas Walter Grundy | Labour | |
| 1935 | Edward Dunn | Labour | |
| 1945 | David Griffiths | Labour | |
| 1970 | Peter Hardy | Labour | |
| 1983 | Sir Kevin Barron | Labour | |
Elections
Elections in the 2010s
| Party | Candidate | Votes | % | ± | |
|---|---|---|---|---|---|
| Labour | Kevin Barron | 20,501 | 43.6 | +2.7 | |
| UKIP | Allen Cowles | 13,204 | 28.1 | +22.5 | |
| Conservative | Gareth Streeter | 10,945 | 23.3 | -5.1 | |
| Liberal Democrat | Robert Teal | 1,992 | 4.2 | -13.1 | |
| English Democrat | Sharon Pilling | 377 | 0.8 | +0.8 | |
| Majority | 7,297 | 15.5 | +3.0 | ||
| Turnout | 47,019 | 63.3 | |||
| Labour hold | Swing | -9.9 | |||
| Party | Candidate | Votes | % | ± | |
|---|---|---|---|---|---|
| Labour | Kevin Barron | 19,147 | 40.9 | -10.6 | |
| Conservative | Lynda Donaldson | 13,281 | 28.4 | +5.3 | |
| Liberal Democrat | Wesley Paxton[12] | 8,111 | 17.3 | +1.2 | |
| BNP | William Blair | 3,616 | 7.7 | +2.8 | |
| UKIP | Tina Dowdall | 2,613 | 5.6 | +1.3 | |
| Majority | 5,866 | 12.5 | -23.5 | ||
| Turnout | 46,768 | 64.2 | +6.5 | ||
| Labour hold | Swing | -8.0 | |||
Elections in the 2000s
| Party | Candidate | Votes | % | ± | |
|---|---|---|---|---|---|
| Labour | Kevin Barron | 21,871 | 55.4 | -6.7 | |
| Conservative | Colin Phillips | 7,647 | 19.4 | -2.3 | |
| Liberal Democrat | Phil Bristow | 6,272 | 15.9 | +3.4 | |
| BNP | Nick Cass | 2,020 | 5.1 | N/A | |
| UKIP | Gordon Brown | 1,685 | 4.3 | +0.6 | |
| Majority | 14,224 | 36.0 | |||
| Turnout | 39,495 | 58.1 | +4.9 | ||
| Labour hold | Swing | -2.2 | |||
| Party | Candidate | Votes | % | ± | |
|---|---|---|---|---|---|
| Labour | Kevin Barron | 22,851 | 62.1 | −5.5 | |
| Conservative | James Duddridge | 7,969 | 21.7 | +5.0 | |
| Liberal Democrat | Win Knight | 4,603 | 12.5 | +0.9 | |
| UKIP | David Cutts | 1,380 | 3.7 | N/A | |
| Majority | 14,882 | 40.4 | |||
| Turnout | 36,803 | 53.2 | |||
| Labour hold | Swing | ||||
Elections in the 1990s
| Party | Candidate | Votes | % | ± | |
|---|---|---|---|---|---|
| Labour | Kevin Barron | 31,184 | 67.6 | ||
| Conservative | Steven Stanbury | 7,699 | 16.7 | ||
| Liberal Democrat | Stan Burgess | 5,342 | 11.6 | ||
| Referendum | Stephen Cook | 1,932 | 4.2 | ||
| Majority | 23,485 | 50.9 | |||
| Turnout | 67.3 | ||||
| Labour hold | Swing | ||||
| Party | Candidate | Votes | % | ± | |
|---|---|---|---|---|---|
| Labour | Kevin Barron | 30,977 | 60.5 | +4.1 | |
| Conservative | G. Toby A.W. Horton | 13,755 | 26.9 | +1.9 | |
| Liberal Democrat | Kevin A. Smith | 6,483 | 12.7 | −5.8 | |
| Majority | 17,222 | 33.6 | +2.2 | ||
| Turnout | 51,215 | 75.0 | −0.6 | ||
| Labour hold | Swing | +1.1 | |||
Elections in the 1980s
| Party | Candidate | Votes | % | ± | |
|---|---|---|---|---|---|
| Labour | Kevin Barron | 28,292 | 56.4 | ||
| Conservative | Paul Rupert Rayner | 12,502 | 24.9 | ||
| Social Democratic | John Redman Boddy | 9,240 | 18.4 | ||
| Workers Revolutionary | Michael Robert Driver | 145 | 0.3 | ||
| Majority | 15,790 | 31.5 | |||
| Turnout | 75.6 | ||||
| Labour hold | Swing | ||||
| Party | Candidate | Votes | % | ± | |
|---|---|---|---|---|---|
| Labour | Kevin Barron | 21,781 | 46.5 | ||
| Conservative | J. Derrick | 13,156 | 28.1 | ||
| Social Democratic | John Redman Boddy | 11,903 | 25.4 | ||
| Majority | 8,625 | 18.4 | |||
| Turnout | 71.9 | ||||
| Labour hold | Swing | ||||
Elections in the 1970s
| Party | Candidate | Votes | % | ± | |
|---|---|---|---|---|---|
| Labour | Peter Hardy | 45,986 | 62.2 | ||
| Conservative | R. Barber | 19,984 | 27.0 | ||
| Liberal | C. Sykes | 7,937 | 10.7 | ||
| Majority | 26,002 | 35.2 | |||
| Turnout | 74.6 | ||||
| Labour hold | Swing | ||||
| Party | Candidate | Votes | % | ± | |
|---|---|---|---|---|---|
| Labour | Peter Hardy | 44,670 | 67.3 | ||
| Conservative | Gary Peter Anthony Waller | 11,893 | 17.9 | ||
| Liberal | G. Reid | 9,828 | 14.8 | ||
| Majority | 32,777 | 49.4 | |||
| Turnout | 72.2 | ||||
| Labour hold | Swing | ||||
| Party | Candidate | Votes | % | ± | |
|---|---|---|---|---|---|
| Labour | Peter Hardy | 52,532 | 73.4 | ||
| Conservative | Gary Peter Anthony Waller | 19,058 | 26.6 | ||
| Majority | 33,474 | 46.7 | |||
| Turnout | 78.6 | ||||
| Labour hold | Swing | ||||
| Party | Candidate | Votes | % | ± | |
|---|---|---|---|---|---|
| Labour | Peter Hardy | 44,322 | 71.8 | ||
| Conservative | Robert Anthony Bevis Durant | 17,418 | 28.2 | ||
| Majority | 26,904 | 43.6 | |||
| Turnout | 70.6 | ||||
| Labour hold | Swing | ||||
Elections in the 1960s
| Party | Candidate | Votes | % | ± | |
|---|---|---|---|---|---|
| Labour | David Griffiths | 43,634 | 76.82 | +2.40 | |
| Conservative | J Michael Clarke | 13,167 | 23.18 | -2.40 | |
| Majority | 30,467 | 53.64 | +4.80 | ||
| Turnout | 56,801 | 73.46 | +3.93 | ||
| Registered electors | 77,320 | ||||
| Labour hold | Swing | +2.40 | |||
| Party | Candidate | Votes | % | ± | |
|---|---|---|---|---|---|
| Labour | David Griffiths | 43,101 | 74.4 | ||
| Conservative | Raymond Whitley Hadfield | 14,813 | 25.6 | ||
| Majority | 28,288 | 48.8 | |||
| Turnout | 77.4 | ||||
| Labour hold | Swing | ||||
Elections in the 1950s
| Party | Candidate | Votes | % | ± | |
|---|---|---|---|---|---|
| Labour | David Griffiths | 43,962 | 74.1 | ||
| Conservative | William Albert V Hoskins | 15,369 | 25.9 | ||
| Majority | 28,593 | 48.2 | |||
| Turnout | 82.8 | ||||
| Labour hold | Swing | ||||
| Party | Candidate | Votes | % | ± | |
|---|---|---|---|---|---|
| Labour | David Griffiths | 39,968 | 75.6 | ||
| Conservative | William Albert V Hoskins | 12,916 | 24.4 | ||
| Majority | 27,052 | 51.2 | |||
| Turnout | 78.8 | ||||
| Labour hold | Swing | ||||
| Party | Candidate | Votes | % | ± | |
|---|---|---|---|---|---|
| Labour | David Griffiths | 41,990 | 75.7 | ||
| Conservative | Ronald Hall | 13,470 | 24.3 | ||
| Majority | 28,520 | 51.4 | |||
| Turnout | 86.3 | ||||
| Labour hold | Swing | ||||
| Party | Candidate | Votes | % | ± | |
|---|---|---|---|---|---|
| Labour | David Griffiths | 42,222 | 76.6 | ||
| Conservative | William Robert Ackrill Breare | 12,887 | 23.4 | ||
| Majority | 29,335 | 53.2 | |||
| Turnout | 87.4 | ||||
| Labour hold | Swing | ||||
Elections in the 1940s
| Party | Candidate | Votes | % | ± | |
|---|---|---|---|---|---|
| Labour | David Griffiths | 44,449 | 75.2 | ||
| Conservative | J. H. Bull | 14,669 | 24.8 | ||
| Majority | 29,830 | 50.4 | |||
| Turnout | 75.2 | ||||
| Labour hold | Swing | ||||
Elections in the 1930s
| Party | Candidate | Votes | % | ± | |
|---|---|---|---|---|---|
| Labour | Edward Dunn | 33,271 | 72.0 | ||
| Conservative | Ahryne Gervase Olliver | 12,907 | 28.0 | ||
| Majority | 20,364 | 44.0 | |||
| Turnout | 73.8 | ||||
| Labour hold | Swing | ||||
| Party | Candidate | Votes | % | ± | |
|---|---|---|---|---|---|
| Labour | Edward Dunn | 26,185 | 62.3 | ||
| Conservative | Ahryne Gervase Olliver | 15,812 | 37.7 | ||
| Majority | 10,373 | 24.6 | |||
| Turnout | 77.5 | ||||
| Labour hold | Swing | ||||
Elections in the 1920s
| Party | Candidate | Votes | % | ± | |
|---|---|---|---|---|---|
| Labour | Thomas Walter Grundy | 30,405 | 76.3 | +11.0 | |
| Unionist | Cecil Frederick Pike | 9,460 | 23.7 | -11.0 | |
| Majority | 20,945 | 52.6 | +22.0 | ||
| Turnout | 77.8 | +1.9 | |||
| Labour hold | Swing | +11.0 | |||
| Party | Candidate | Votes | % | ± | |
|---|---|---|---|---|---|
| Labour | Thomas Walter Grundy | 18,750 | 65.3 | ||
| Unionist | Frances R. Wade | 9,985 | 34.7 | ||
| Majority | 8,765 | 30.6 | |||
| Turnout | 75.9 | ||||
| Labour hold | Swing | ||||
| Party | Candidate | Votes | % | ± | |
|---|---|---|---|---|---|
| Labour | Thomas Walter Grundy | 15,967 | 68.6 | n/a | |
| Unionist | Frances R. Wade | 7,323 | 31.4 | n/a | |
| Majority | 8,644 | 37.2 | n/a | ||
| Turnout | 64.0 | n/a | |||
| Labour hold | Swing | n/a | |||
In the 1922 general election, Thomas Walter Grundy was elected unopposed.
Elections in the 1910s
| Party | Candidate | Votes | % | ± | |
|---|---|---|---|---|---|
| Labour | Thomas Walter Grundy | 9,917 | 55.1 | ||
| National Democratic | Ernest George Bearcroft | 4,894 | 27.2 | ||
| Liberal | Albert Edward Mann Turner | 3,177 | 17.7 | ||
| Majority | 5,023 | 27.9 | |||
| Turnout | 56.3 | ||||
| Labour hold | Swing | ||||
See also
Notes and references
- Notes
- ↑ A borough constituency (for the purposes of election expenses and type of returning officer)
- ↑ As with all constituencies, the constituency elects one Member of Parliament (MP) by the first past the post system of election at least every five years.
- ↑ The closest result was in 2010 — still greater than a 10% majority
- References
- ↑ "Electorate Figures - Boundary Commission for England". 2011 Electorate Figures. Boundary Commission for England. 4 March 2011. Retrieved 13 March 2011.
- ↑ 2010 post-revision map Greater London and metropolitan areas of England
- ↑ 2001 Census
- ↑ Unemployment claimants by constituency The Guardian
- 1 2 2011 census interactive maps
- ↑ Leigh Rayment's Historical List of MPs – Constituencies beginning with "R" (part 2)
- ↑ "Election Data 2015". Electoral Calculus. Archived from the original on 17 October 2015. Retrieved 17 October 2015.
- ↑ "Rother Valley". BBC News. Retrieved 14 May 2015.
- ↑ "Election Data 2010". Electoral Calculus. Archived from the original on 17 October 2015. Retrieved 17 October 2015.
- ↑ Statement of Persons Nominated
- ↑ "Election 2010: Rother Valley Constituency Results". BBC News. Retrieved 10 May 2010.
- ↑ "Wesley Paxton". Liberal Democrats. Retrieved 22 April 2010.
- ↑ "Election Data 2005". Electoral Calculus. Archived from the original on 15 October 2011. Retrieved 18 October 2015.
- ↑ "Election Data 2001". Electoral Calculus. Archived from the original on 15 October 2011. Retrieved 18 October 2015.
- ↑ "Election Data 1997". Electoral Calculus. Archived from the original on 15 October 2011. Retrieved 18 October 2015.
- ↑ "Election Data 1992". Electoral Calculus. Archived from the original on 15 October 2011. Retrieved 18 October 2015.
- ↑ "Politics Resources". Election 1992. Politics Resources. 9 April 1992. Retrieved 2010-12-06.
- ↑ "Election Data 1987". Electoral Calculus. Archived from the original on 15 October 2011. Retrieved 18 October 2015.
- ↑ "Election Data 1983". Electoral Calculus. Archived from the original on 15 October 2011. Retrieved 18 October 2015.
- ↑ Kimber, Richard. "UK General Election results 1966". Political Science Resources. Retrieved 17 April 2016.
- ↑
Sources
- BBC News, Election 2005
- BBC News, Vote 2001
- Guardian Unlimited Politics
- Leigh Rayment's Historical List of MPs – Constituencies beginning with "R" (part 2)
- http://www.psr.keele.ac.uk/ (Election results from 1951 to the present)
- F. W. S. Craig, British Parliamentary Election Results 1918 - 1949
- F. W. S. Craig, British Parliamentary Election Results 1950 - 1970