Huddersfield (UK Parliament constituency)
| Huddersfield | |
|---|---|
|
Borough constituency for the House of Commons | |
|
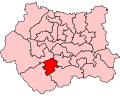
Boundary of Huddersfield in West Yorkshire. | |
|
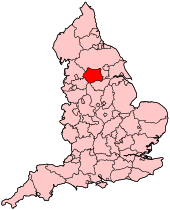
Location of West Yorkshire within England. | |
| County | West Yorkshire |
| Electorate | 66,681 (December 2010)[1] |
| Current constituency | |
| Created | 1983 |
| Member of parliament | Barry Sheerman (Labour Co-op) |
| Number of members | One |
| Created from |
Huddersfield East Huddersfield West |
| 1832–1950 | |
| Number of members | One |
| Type of constituency | Borough constituency |
| Replaced by |
Huddersfield East Huddersfield West |
| Created from | Yorkshire |
| Overlaps | |
| European Parliament constituency | Yorkshire and the Humber |
Huddersfield ![]() i/ˈhʌdərzˌfiːld/ is a constituency[n 1] represented in the House of Commons of the UK Parliament since 1983 by Barry Sheerman of the Labour Co-operative Party (which denotes he is a member of the Labour Party and Co-operative Party, one of 30 current Labour MPs, and requires members to contribute practically to a cooperative business).[n 2]
i/ˈhʌdərzˌfiːld/ is a constituency[n 1] represented in the House of Commons of the UK Parliament since 1983 by Barry Sheerman of the Labour Co-operative Party (which denotes he is a member of the Labour Party and Co-operative Party, one of 30 current Labour MPs, and requires members to contribute practically to a cooperative business).[n 2]
Boundaries
1983-2010: The Metropolitan Borough of Kirklees wards of Almondbury, Birkby, Dalton, Deighton, Newsome, and Paddock.
2010-present: The Metropolitan Borough of Kirklees wards of Almondbury, Ashbrow, Dalton, Greenhead, and Newsome.
Constituency profile
Apart from four years tenure as MP by Geoffrey Dickens for Huddersfield West (1979-1983), the area (including its divided halves for the 33 years to 1983) has returned a Labour Party MP since 1945.
The constituency is currently held by the Labour Party, although the Liberal Democrats made inroads by coming second in the 2005 general election and hold nearly as many local council seats across the constituency. In the 2010 general election Karen Tween of the Conservative Party narrowed the incumbent's lead to a relatively average 4,472 votes and the new Liberal Democrat candidate slipped into third place.
Members of Parliament
| Election | Member[2] | Party | |
|---|---|---|---|
| 1832 | Lewis Fenton | Whig | |
| 1834 by-election | John Blackburne | Whig | |
| 1837 by-election | Edward Ellice | Whig | |
| 1837 | William Rookes Crompton Stansfield | Whig | |
| 1853 by-election | Viscount Goderich | Whig | |
| 1857 | Edward Akroyd | Liberal | |
| 1859 | Edward Aldam Leatham | Liberal | |
| 1865 | Thomas Pearson Crosland | Liberal | |
| 1868 | Edward Aldam Leatham | Liberal | |
| 1886 | William Summers | Liberal | |
| 1893 by-election | Sir Joseph Crosland | Conservative | |
| 1895 | Sir James Thomas Woodhouse | Liberal | |
| 1906 by-election | Arthur James Sherwell | Liberal | |
| 1918 | Sir Charles Sykes | Coalition Liberal | |
| 1922 | Sir Arthur Harold Marshall | Liberal | |
| 1923 | James Hindle Hudson | Labour | |
| 1931 | William Mabane | National Liberal[n 3] | |
| 1945 | Joseph Mallalieu | Labour | |
| 1950 | constituency abolished: see Huddersfield East and Huddersfield West | ||
| 1983 | constituency reconstituted | ||
| 1983 | Barry Sheerman | Labour Co-operative | |
Elections
Elections in the 2010s
| Party | Candidate | Votes | % | ± | |
|---|---|---|---|---|---|
| Labour Co-op | Barry Sheerman | 18,186 | 44.9 | +6.1 | |
| Conservative | Itrat Ali | 10,841 | 26.8 | -1.0 | |
| UKIP | Rob Butler | 5,948 | 14.7 | +14.7 | |
| Green | Andrew Cooper | 2,798 | 6.9 | +2.9 | |
| Liberal Democrat | Zulfiqar Ali | 2,365 | 5.8 | -18.9 | |
| TUSC | Mike Forster | 340 | 0.8 | +0.1 | |
| Majority | 7,345 | 18.1 | |||
| Turnout | 40,478 | 62.0 | |||
| Labour Co-op hold | Swing | ||||
| Party | Candidate | Votes | % | ± | |
|---|---|---|---|---|---|
| Labour Co-op | Barry Sheerman | 15,725 | 38.8 | -7.6 | |
| Conservative | Karen Tweed | 11,253 | 27.8 | +6.7 | |
| Liberal Democrat | James Blanchard | 10,023 | 24.7 | +0.6 | |
| Green | Andrew Cooper | 1,641 | 4.0 | -0.6 | |
| BNP | Rachel Firth | 1,563 | 3.9 | +0.9 | |
| TUSC | Paul Cooney[7] | 319 | 0.8 | — | |
| Majority | 4,472 | 11.0 | |||
| Turnout | 40,524 | 61.1 | +4.5 | ||
| Labour Co-op hold | Swing | −7.1 | |||
Elections in the 2000s
| Party | Candidate | Votes | % | ± | |
|---|---|---|---|---|---|
| Labour Co-op | Barry Sheerman | 16,341 | 46.8 | −6.4 | |
| Liberal Democrat | Emma Bone | 7,990 | 22.9 | +7.9 | |
| Conservative | David Meacock | 7,597 | 21.7 | −3.2 | |
| Green | Julie Stewart-Turner | 1,651 | 4.7 | +1.2 | |
| BNP | Karl Hanson | 1,036 | 3.0 | N/A | |
| Independent | Theresa Quarmby | 325 | 0.9 | N/A | |
| Majority | 8,351 | 23.9 | |||
| Turnout | 34,940 | 56.6 | +1.6 | ||
| Labour Co-op hold | Swing | −7.1 | |||
| Party | Candidate | Votes | % | ± | |
|---|---|---|---|---|---|
| Labour Co-op | Barry Sheerman | 18,840 | 53.2 | −3.2 | |
| Conservative | Paul Baverstock | 8,794 | 24.9 | +3.9 | |
| Liberal Democrat | Neil Bentley | 5,300 | 15.0 | −2.2 | |
| Green | John Phillips | 1,254 | 3.5 | +1.4 | |
| UKIP | Judith Longman | 613 | 1.7 | N/A | |
| Socialist Alliance | Graham Hellawell | 374 | 1.1 | N/A | |
| Socialist Labour | George Randall | 208 | 0.6 | N/A | |
| Majority | 10,046 | 28.3 | |||
| Turnout | 35,383 | 55.0 | −12.7 | ||
| Labour Co-op hold | Swing | ||||
Elections in the 1990s
| Party | Candidate | Votes | % | ± | |
|---|---|---|---|---|---|
| Labour Co-op | Barry Sheerman | 25,171 | 56.5 | ||
| Conservative | Bill Forrow | 9,323 | 20.9 | ||
| Liberal Democrat | Gordon Beever | 7,642 | 17.2 | ||
| Referendum | Paul McNulty | 1,480 | 3.3 | ||
| Green | John Phillips | 938 | 2.1 | N/A | |
| Majority | 15,848 | 35.6 | |||
| Turnout | 67.0 | ||||
| Labour Co-op hold | Swing | ||||
| Party | Candidate | Votes | % | ± | |
|---|---|---|---|---|---|
| Labour Co-op | Barry Sheerman | 23,832 | 48.7 | +2.9 | |
| Conservative | Miss JM Kenyon | 16,574 | 33.9 | +2.5 | |
| Liberal Democrat | Mrs AE Denham | 7,777 | 15.9 | −5.6 | |
| Green | NAL Harvey | 576 | 1.2 | −0.1 | |
| Natural Law | M Cran | 135 | 0.3 | +0.3 | |
| Majority | 7,258 | 14.8 | +0.3 | ||
| Turnout | 48,894 | 72.4 | −3.2 | ||
| Labour Co-op hold | Swing | +0.2 | |||
Elections in the 1980s
| Party | Candidate | Votes | % | ± | |
|---|---|---|---|---|---|
| Labour Co-op | Barry Sheerman | 23,019 | 45.88 | ||
| Conservative | Nick Hawkins | 15,741 | 31.37 | ||
| Liberal | John Ralph Smithson | 10,773 | 21.47 | ||
| Green | Nicholas Andrew Lawton Harvey | 638 | 1.27 | ||
| Majority | 7,278 | 14.51 | |||
| Turnout | 75.54 | ||||
| Labour Co-op hold | Swing | ||||
| Party | Candidate | Votes | % | ± | |
|---|---|---|---|---|---|
| Labour Co-op | Barry Sheerman | 20,051 | 41.39 | ||
| Conservative | J Tweddle | 16,096 | 33.23 | ||
| Liberal | KJL Hasler | 12,027 | 24.83 | ||
| Independent | H Hirst | 271 | 0.56 | ||
| Majority | 3,955 | 8.16 | |||
| Turnout | 71.06 | ||||
| Labour Co-op win (new seat) | |||||
Elections in the 1940s
| Party | Candidate | Votes | % | ± | |
|---|---|---|---|---|---|
| Labour | Joseph Percival William Mallalieu | 33,362 | 48.3 | +9.1 | |
| Liberal National | Rt Hon. William Mabane | 24,496 | 35.5 | -25.3 | |
| Liberal | Roy Forbes Harrod | 11,119 | 16.2 | +16.2 | |
| Majority | 8,866 | 12.8 | |||
| Turnout | 78.4 | +5.2 | |||
| Labour gain from Liberal National | Swing | +17.2 | |||
General Election 1939/40:
Another general election was required to take place before the end of 1940. The political parties had been making preparations for an election to take place from 1939 and by the end of this year, the following candidates had been selected;
- Liberal National: William Mabane
- Labour: Joseph Mallalieu
- Liberal: Elliott Dodds
Elections in the 1930s
| Party | Candidate | Votes | % | ± | |
|---|---|---|---|---|---|
| Liberal National | William Mabane | 37,009 | 60.8 | -9.3 | |
| Labour | William Pickles | 23,844 | 39.2 | +9.3 | |
| Majority | 21.6 | ||||
| Turnout | 73.2 | -10.1 | |||
| Liberal National hold | Swing | -9.3 | |||
| Party | Candidate | Votes | % | ± | |
|---|---|---|---|---|---|
| Liberal National | William Mabane | 47,056 | 70.1 | +38.5 | |
| Labour | James Hindle Hudson | 20,034 | 29.9 | -8.4 | |
| Majority | 27,022 | 40.2 | |||
| Turnout | 83.3 | -2.7 | |||
| Liberal National gain from Labour | Swing | +23.5 | |||
Elections in the 1920s
| Party | Candidate | Votes | % | ± | |
|---|---|---|---|---|---|
| Labour | James Hindle Hudson | 25,966 | 38.3 | +2.0 | |
| Liberal | William Mabane | 21,398 | 31.6 | -0.1 | |
| Unionist | Sir Enoch Hill | 20,361 | 30.1 | -1.9 | |
| Majority | 4,568 | 6.7 | +2.4 | ||
| Turnout | 86.1 | -2.4 | |||
| Labour hold | Swing | +1.0 | |||
| Party | Candidate | Votes | % | ± | |
|---|---|---|---|---|---|
| Labour | James Hindle Hudson | 19,010 | 36.3 | -0.4 | |
| Unionist | Enoch Hill | 16,745 | 32.0 | +5.3 | |
| Liberal | Sir Arthur Harold Marshall | 16,626 | 31.7 | -4.9 | |
| Majority | 2,265 | 4.3 | 4.2 | ||
| Turnout | 88.5 | +6.6 | |||
| Labour hold | Swing | -2.8 | |||
| Party | Candidate | Votes | % | ± | |
|---|---|---|---|---|---|
| Labour | James Hindle Hudson | 17,430 | 36.7 | +3.2 | |
| Liberal | Sir Arthur Harold Marshall | 17,404 | 36.6 | +2.6 | |
| Unionist | Charles Tinker | 12,694 | 26.7 | +26.7 | |
| Majority | 26 | 0.1 | 0.6 | ||
| Turnout | 81.9 | -1.2 | |||
| Labour gain from Liberal | Swing | +0.3 | |||

| Party | Candidate | Votes | % | ± | |
|---|---|---|---|---|---|
| Liberal | Sir Arthur Harold Marshall | 15,879 | 34.0 | +5.3 | |
| Labour | James Hindle Hudson | 15,673 | 33.5 | +1.0 | |
| National Liberal | Sir Charles Sykes | 15,212 | 32.5 | -6.3 | |
| Majority | 206 | 0.5 | 11.6 | ||
| Turnout | 83.1 | +13.3 | |||
| Liberal gain from National Liberal | Swing | +5.8 | |||
Elections in the 1910s
| Party | Candidate | Votes | % | ± | |
|---|---|---|---|---|---|
| Coalition Liberal | 15,234 | 38.8 | |||
| Labour | Harry Snell | 12,737 | 32.5 | ||
| Liberal | Ernest Woodhead | 11,256 | 28.7 | ||
| Majority | 2,497 | 6.3 | |||
| Turnout | 69.8 | ||||
| Coalition Liberal hold | Swing | ||||
- endorsed by Coalition Government[15]
General Election 1914/15:
Another General Election was required to take place before the end of 1915. The political parties had been making preparations for an election to take place and by the July 1914, the following candidates had been selected;
- Liberal: Arthur James Sherwell
- Unionist:
- Socialist: Harry Snell (candidature not approved by Labour Party National Executive)
| Party | Candidate | Votes | % | ± | |
|---|---|---|---|---|---|
| Liberal | Arthur James Sherwell | 6,458 | 37.5 | ||
| Conservative | Joseph Henry Kaye | 5,777 | 33.5 | ||
| Labour | Harry Snell | 4,988 | 29.0 | ||
| Majority | |||||
| Turnout | 90.5 | ||||
| Liberal hold | Swing | ||||

| Party | Candidate | Votes | % | ± | |
|---|---|---|---|---|---|
| Liberal | Arthur James Sherwell | 7,158 | |||
| Labour | Harry Snell | 5,686 | |||
| Conservative | Harold Smith | 5,153 | |||
| Majority | |||||
| Turnout | |||||
| Liberal hold | Swing | ||||
Elections in the 1900s
| Party | Candidate | Votes | % | ± | |
|---|---|---|---|---|---|
| Liberal | Arthur James Sherwell | 5,762 | 36.0 | -2.2 | |
| Labour | Thomas Russell Williams | 5,422 | 33.8 | -1.4 | |
| Conservative | John Foster Fraser | 4,844 | 30.2 | +3.6 | |
| Majority | 340 | 2.2 | -0.8 | ||
| Turnout | 91.2 | -2.8 | |||
| Liberal hold | Swing | +0.4 | |||
| Party | Candidate | Votes | % | ± | |
|---|---|---|---|---|---|
| Liberal | Sir James Thomas Woodhouse | 6,302 | 38.2 | ||
| Labour | Thomas Russell Williams | 5,813 | 35.2 | ||
| Conservative | John Foster Fraser | 4,391 | 26.6 | ||
| Majority | 489 | 3.0 | |||
| Turnout | 94.0 | ||||
| Liberal hold | Swing | ||||
| Party | Candidate | Votes | % | ± | |
|---|---|---|---|---|---|
| Liberal | Sir James Thomas Woodhouse | 7,896 | 53.6 | +6.1 | |
| Conservative | Edward Hildred Carlile | 6,831 | 46.4 | +5.1 | |
| Majority | 1,065 | 7.2 | +1.0 | ||
| Turnout | 87.8 | ||||
| Liberal hold | Swing | +0.5 | |||
Elections in the 1890s
| Party | Candidate | Votes | % | ± | |
|---|---|---|---|---|---|
| Liberal | Sir James Thomas Woodhouse | 6,755 | 47.5 | ||
| Conservative | Sir Joseph Crosland | 5,868 | 41.3 | ||
| Ind. Labour Party | Hyman Russell Smart | 1,594 | 11.2 | ||
| Majority | 687 | 6.2 | |||
| Turnout | 89.8 | ||||
| Liberal gain from Conservative | Swing | ||||
| Party | Candidate | Votes | % | ± | |
|---|---|---|---|---|---|
| Conservative | Sir Joseph Crosland | 7,068 | |||
| Liberal | J Woodhead | 7,033 | |||
| Majority | 35 | ||||
| Turnout | |||||
| Conservative gain from Liberal | Swing | ||||
| Party | Candidate | Votes | % | ± | |
|---|---|---|---|---|---|
| Liberal | William Summers | 7,098 | 50.9 | ||
| Conservative | Sir Joseph Crosland | 6,837 | 49.1 | ||
| Majority | 1.8 | ||||
| Turnout | 90.1 | +8.5 | |||
| Liberal hold | Swing | ||||
Elections in the 1880s
| Party | Candidate | Votes | % | ± | |
|---|---|---|---|---|---|
| Liberal | William Summers | 6,210 | 50.8 | -2.1 | |
| Conservative | Joseph Crosland | 6,026 | 49.2 | +2.1 | |
| Majority | 184 | 1.6 | -4.2 | ||
| Turnout | 81.6 | ||||
| Liberal hold | Swing | -2.1 | |||
| Party | Candidate | Votes | % | ± | |
|---|---|---|---|---|---|
| Liberal | Edward Aldam Leatham | 6,960 | 52.9 | ||
| Conservative | Joseph Crosland | 6,194 | 47.1 | ||
| Majority | 4.8 | ||||
| Turnout | 87.7 | ||||
| Liberal hold | Swing | ||||
See also
Notes and references
- Notes
- ↑ A borough constituency (for the purposes of election expenses and type of returning officer)
- ↑ As with all constituencies, the constituency elects one Member of Parliament (MP) by the first past the post system of election at least every five years.
- ↑ Mabane's exact party label was confused for much of his time in the Commons before becoming Lord Mabane (first Baron). His local Liberal association was affiliated to the official Liberals until 1939, but Mabane was frequently listed as being a National Liberal, which he repeatedly sought to deny, despite supporting the National Government when the official Liberals ceased to. However the authoritative F.W.S. Craig volume and the contemporary Times Guide to the House of Commons have him as a National Liberal
- References
- ↑ "Electorate Figures - Boundary Commission for England". 2011 Electorate Figures. Boundary Commission for England. 4 March 2011. Retrieved 13 March 2011.
- ↑ Leigh Rayment's Historical List of MPs – Constituencies beginning with "H" (part 4)
- ↑ "Election Data 2015". Electoral Calculus. Archived from the original on 17 October 2015. Retrieved 17 October 2015.
- ↑ "Huddersfield". BBC News. Retrieved 13 May 2015.
- ↑ "Election Data 2010". Electoral Calculus. Archived from the original on 17 October 2015. Retrieved 17 October 2015.
- ↑ "UK > England > Yorkshire & the Humber > Huddersfield". Election 2010. BBC. 7 May 2010. Retrieved 12 May 2010.
- ↑ http://www.tusc.org.uk/candidates.php
- ↑ "Election Data 2005". Electoral Calculus. Archived from the original on 15 October 2011. Retrieved 18 October 2015.
- ↑ "Election Data 2001". Electoral Calculus. Archived from the original on 15 October 2011. Retrieved 18 October 2015.
- ↑ "Election Data 1997". Electoral Calculus. Archived from the original on 15 October 2011. Retrieved 18 October 2015.
- ↑ "Election Data 1992". Electoral Calculus. Archived from the original on 15 October 2011. Retrieved 18 October 2015.
- ↑ "Politics Resources". Election 1992. Politics Resources. 9 April 1992. Retrieved 2010-12-06.
- ↑ "Election Data 1987". Electoral Calculus. Archived from the original on 15 October 2011. Retrieved 18 October 2015.
- ↑ "Election Data 1983". Electoral Calculus. Archived from the original on 15 October 2011. Retrieved 18 October 2015.
- ↑ Craig, F. W. S. (1983). British parliamentary election results 1918-1949 (3 ed.). Chichester: Parliamentary Research Services. ISBN 0-900178-06-X.
- 1 2 3 4 5 6 7 8 9 10 British parliamentary election results, 1885-1918 (Craig)