Barnsley Central (UK Parliament constituency)
Coordinates: 53°33′14″N 1°28′48″W / 53.554°N 1.480°W
| Barnsley Central | |
|---|---|
|
Borough constituency for the House of Commons | |
|
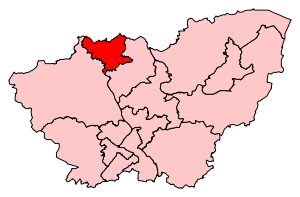
Boundary of Barnsley Central in South Yorkshire. | |
|
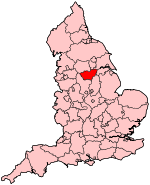
Location of South Yorkshire within England. | |
| County | South Yorkshire |
| Population | 85,714 (2011 census)[1] |
| Electorate | 64,732 (December 2010)[2] |
| Major settlements | Barnsley, Royston |
| Current constituency | |
| Created | 1983 |
| Member of parliament | Dan Jarvis[3] (Labour) |
| Number of members | One |
| Created from | Barnsley, Wakefield |
| Overlaps | |
| European Parliament constituency | Yorkshire and the Humber |
Barnsley Central is a constituency[n 1] in South Yorkshire represented in the House of Commons of the UK Parliament since 2011 by Dan Jarvis of the Labour Party.[n 2]
Constituency profile
Barnsley Central is generally an urban seat and has a large majority of its population on middle or low incomes, with most of the large former mining towns social housing contained within it.[4] It has been held by the Labour Party since 1983 on large majorities, like its main predecessor, making it a safe seat.
History
Created in 1983, Barnsley Central covers a similar area to that of the former Barnsley constituency. The seat was held by almost a year from May 2010 by Eric Illsley as an independent MP after he was suspended from the Labour party over the expenses row and he led to its becoming vacant on 8 February 2011.[5]
On 12 January 2011 having admitted the crime of fraud over his expenses, Illsley announced the intention to stand down from Parliament, necessitating a by-election in early 2011.[6] On 8 February 2011 Ilsley resigned his seat[n 3] before he was due to be sentenced for fraudulently claiming parliamentary expenses.[7] The by-election was held on 3 March 2011 and was won by Dan Jarvis for the Labour Party. The Labour majority and share of the vote rose to give an absolute majority, on a turnout 20% lower than in the General Election, meanwhile the Conservative share of the vote fell steeply to just 8.3%, less than UKIP on 12.2%.[3]
Boundaries
1983-1997: The Metropolitan Borough of Barnsley wards of Ardsley, Athersley, Central, Monk Bretton, North West, Royston, and South West.
1997-2010: The Metropolitan Borough of Barnsley wards of Ardsley, Athersley, Central, Cudworth, Monk Bretton, North West, Royston, and South West.
2010-present: The Metropolitan Borough of Barnsley wards of Central, Darton East, Darton West, Kingstone, Monk Bretton, Old Town, Royston, and St Helens.
Barnsley Central constituency covers most of the town of Barnsley. It is bordered by the constituencies of Wakefield, Hemsworth, Barnsley East, and Penistone and Stocksbridge.
Members of Parliament
The constituency has had three Members of Parliament since its creation in 1983, all of whom have been from the Labour Party.
| Election | Member[8] | Party | |
|---|---|---|---|
| 1983 | Roy Mason | Labour | |
| 1987 | Eric Illsley | Labour | |
| 2010 | Independent[5] | ||
| 2011 by-election | Dan Jarvis | Labour | |
Elections
| Party | Candidate | Votes | % | ± | |
|---|---|---|---|---|---|
| Labour | Dan Jarvis | 20,376 | 55.7 | +8.5 | |
| UKIP | Lee Hunter | 7,941 | 21.7 | +17.1 | |
| Conservative | Kay Carter | 5,485 | 15.0 | -2.3 | |
| Green | Michael Short | 938 | 2.6 | N/A | |
| Liberal Democrat | John Ridgway | 770 | 2.1 | -15.2 | |
| TUSC | Dave Gibson | 573 | 1.6 | N/A | |
| English Democrat | Ian Sutton | 477 | 1.3 | N/A | |
| Majority | 12,435 | 34.0 | +4.0 | ||
| Turnout | 36,560 | 56.7 | +0.2 | ||
| Labour hold | Swing | -4.3 | |||

| Election | Political result | Candidate | Party | Votes | % | ±% | ||
|---|---|---|---|---|---|---|---|---|
| Barnsley Central by-election, 2011 [11] Turnout: 24,219 (36.5%) -19.6 | Labour hold Majority: 11,771 (48.6%) +18.6 | Dan Jarvis | Labour | 14,724 | 60.8 | +13.5 | ||
| Jane Collins | UKIP | 2,953 | 12.2 | +7.5 | ||||
| James Hockney | Conservative | 1,999 | 8.3 | -9.0 | ||||
| Enis Dalton | BNP | 1,463 | 6.0 | -2.9 | ||||
| Tony Devoy | Independent | 1,266 | 5.2 | +3.6 | ||||
| Dominic Carman | Liberal Democrat | 1,012 | 4.2 | -13.1 | ||||
| Kevin Riddiough | English Democrat | 544 | 2.2 | N/A | ||||
| Howling Laud Hope | Monster Raving Loony | 198 | 0.8 | N/A | ||||
| Michael Val Davies | Independent | 60 | 0.2 | N/A | ||||
| General Election 2010 [12][13] Turnout: 37,001 (56.5%) +8.8 | Labour hold Majority: 11,093 (30.0%) −14.5 Swing: 5.5% from Lab to Lib Dem | Eric Illsley | Labour | 17,487 | 47.3 | −10.4 | ||
| Christopher Wiggin | Liberal Democrat | 6,394 | 17.3 | +0.7 | ||||
| Piers Tempest | Conservative | 6,388 | 17.3 | +2.5 | ||||
| Ian Sutton | BNP | 3,307 | 8.9 | +4.4 | ||||
| David Silver | UKIP | 1,727 | 4.7 | N/A | ||||
| Donald Wood | Independent | 732 | 2.0 | -2.1 | ||||
| Tony Devoy | Independent | 610 | 1.6 | N/A | ||||
| Terence Robinson | Socialist Labour | 356 | 1.0 | N/A | ||||
| General Election 2005 [14][15] Turnout: 28,615 (47.2%) +1.4 | Labour hold Majority: 12,732 (44.5%) −10.4 Swing: 5.2% from Lab to Lib Dem | Eric Illsley | Labour | 17,478 | 61.1 | −8.5 | ||
| Miles Crompton | Liberal Democrat | 4,746 | 16.6 | +1.9 | ||||
| Peter Morel | Conservative | 3,813 | 13.3 | +0.2 | ||||
| Geoffrey Broadley | BNP | 1,403 | 4.9 | N/A | ||||
| Donald Wood | Independent | 1,175 | 4.1 | N/A | ||||
| General Election 2001 [16][17] Turnout: 27,543 (45.8%) −13.8 | Labour hold Majority: 15,130 (54.9%) −12.7 Swing: 6.3% from Lab to Con | Eric Illsley | Labour | 19,181 | 69.6 | −7.4 | ||
| Alan Hartley | Liberal Democrat | 4,051 | 14.7 | +5.2 | ||||
| Ian McCord | Conservative | 3,608 | 13.1 | +3.3 | ||||
| Henry Rajch | Socialist Alliance | 703 | 2.6 | N/A | ||||
| General Election 1997 [18][19][20][21] Turnout: 36,485 (59.7%) −10.8 | Labour hold Majority: 24,501 (67.2%) +17.6 Swing: 7.5% from Con to Lab | Eric Illsley | Labour | 28,090 | 77.0 | +6.2 | ||
| Simon Gutteridge | Conservative | 3,589 | 9.8 | −8.7 | ||||
| Darren Finlay | Liberal Democrat | 3,481 | 9.5 | −1.2 | ||||
| James Walsh | Referendum | 1,325 | 3.6 | N/A | ||||
| General Election 1992 [22][23] Turnout: 39,056 (70.5%) +0.5 | Labour hold Majority: 19,361 (49.6%) +0.9 Swing: 0.5% from Con to Lab | Eric Illsley | Labour | 27,048 | 69.3 | +2.5 | ||
| David N. Senior | Conservative | 7,687 | 19.7 | +1.6 | ||||
| Stephen R. Cowton | Liberal Democrat | 4,321 | 11.1 | −4.1 | ||||
| General Election 1987 [24][25] Turnout: 37,548 (70.0%) +3.7 | Labour hold Majority: 19,051 (48.7%) +9.9 | Eric Illsley | Labour | 26,139 | 66.8 | +7.0 | ||
| Mrs. Vivien Prais | Conservative | 7,088 | 18.1 | −2.9 | ||||
| Mrs. Susan Anne Maxwell Holland | Liberal | 4,321 | 15.1 | −4.1 | ||||
| General Election 1983 [26][27] New constituency Turnout: 36,532 (66.3%) N/A | Labour win Majority: 14,173 (38.8%) N/A | Roy Mason | Labour | 21,847 | 59.8 | N/A | ||
| Howard S. Oldfield | Conservative | 7,674 | 21.0 | N/A | ||||
| Rev. Geoffrey C. Reid | Liberal | 7,011 | 19.2 | N/A | ||||
See also
Notes and references
- Notes
- ↑ A borough constituency (for the purposes of election expenses and type of returning officer)
- ↑ As with all constituencies, the constituency elects one Member of Parliament (MP) by the first past the post system of election at least every five years.
- ↑ By the time-honoured tradition of accepting appointment as Steward of the Chiltern Hundreds
- References
- ↑ "Usual Resident Population, 2011". Neighbourhood Statistics. Office for National Statistics. Retrieved 27 January 2015.
- ↑ "Electorate Figures - Boundary Commission for England". 2011 Electorate Figures. Boundary Commission for England. 4 March 2011. Archived from the original on 6 November 2010. Retrieved 13 March 2011.
- 1 2 "Labour win Barnsley Central by-election". BBC News. BBC. 3 March 2011. Archived from the original on 4 March 2011. Retrieved 2011-03-03.
- ↑
- 1 2 "Labour MP charged over expenses". BBC News. BBC. 19 May 2010. Retrieved 2011-01-12.
- ↑ BBC News Website, 12 January 2011
- ↑ "Expenses fraud Barnsley Central MP Eric Illsley resigns" (Press release). BBC. 8 February 2011. Archived from the original on 9 February 2011. Retrieved 8 February 2011.
- ↑
- ↑ "Election Data 2015". Electoral Calculus. Archived from the original on 17 October 2015. Retrieved 17 October 2015.
- ↑ "Barnsley Central". BBC News. Retrieved 14 May 2015.
- ↑ "By election result for Barnsley Central". BBC. 4 March 2011. Archived from the original on 4 March 2011. Retrieved 4 March 2011.
- ↑ "Election Data 2010". Electoral Calculus. Archived from the original on 17 October 2015. Retrieved 17 October 2015.
- ↑ "UK general election 2010: Results for Barnsley Central". Electoral Commission. Archived from the original on 28 December 2010. Retrieved 12 January 2011.
- ↑ "Election Data 2005". Electoral Calculus. Archived from the original on 15 October 2011. Retrieved 18 October 2015.
- ↑ "Vote 2005". Vote 2005. BBC News. 5 May 2005. Retrieved 2011-01-13.
- ↑ "Election Data 2001". Electoral Calculus. Archived from the original on 15 October 2011. Retrieved 18 October 2015.
- ↑ "Vote 2001". Vote 2001. BBC News. 7 June 2001. Retrieved 2011-01-13.
- ↑ "Election Data 1997". Electoral Calculus. Archived from the original on 15 October 2011. Retrieved 18 October 2015.
- ↑ "Politics Resources". Election 1997. Politics Resources. 1 May 1997. Retrieved 2011-01-07.
- ↑ C. Rallings & M. Thrasher, The Media Guide to the New Parliamentary Constituencies, p.25 (Plymouth: LGC Elections Centre, 1995)
- ↑ The 1997 election result is calculated relative to the notional, not the actual, 1992 result.
- ↑ "Election Data 1992". Electoral Calculus. Archived from the original on 15 October 2011. Retrieved 18 October 2015.
- ↑ "Politics Resources". Election 1992. Politics Resources. 9 April 1992. Retrieved 2010-12-06.
- ↑ "Election Data 1987". Electoral Calculus. Archived from the original on 15 October 2011. Retrieved 18 October 2015.
- ↑ "Politics Resources". Election 1987. Politics Resources. 11 June 1987. Retrieved 2011-01-13.
- ↑ "Election Data 1983". Electoral Calculus. Archived from the original on 15 October 2011. Retrieved 18 October 2015.
- ↑ "Politics Resources". Election 1983. Politics Resources. 9 June 1983. Retrieved 2011-01-13.
Sources
- Guardian Unlimited Politics (Election results from 1992 to the present)