Bradford West (UK Parliament constituency)
Coordinates: 53°48′N 1°47′W / 53.8°N 1.79°W
| Bradford West | |
|---|---|
|
Borough constituency for the House of Commons | |
|
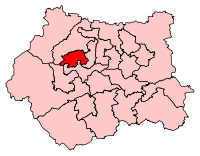
Boundary of Bradford West in West Yorkshire. | |
|
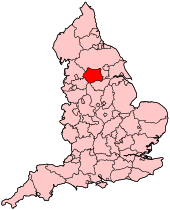
Location of West Yorkshire within England. | |
| County | West Yorkshire |
| Population | 114,761 (2011 census)[1] |
| Electorate | 63,425 (December 2010)[2] |
| Major settlements | Bradford |
| Current constituency | |
| Created | 1955 |
| Member of parliament | Naz Shah (Labour) |
| Created from | Bradford Central, Bradford North and Bradford South |
| 1885–1918 | |
| Number of members | One |
| Type of constituency | Borough constituency |
| Created from | Bradford |
| Overlaps | |
| European Parliament constituency | Yorkshire and the Humber |
Bradford West is a constituency[n 1] of the city of Bradford represented in the House of Commons of the UK Parliament since 2015 by Naz Shah, of the Labour Party.[n 2]
History
Before 1974, the Labour and Conservative Parties held the seat marginally in various years, since which time the Labour Party always won the seat until 2012. In 1981 though, Edward Lyons, the sitting Bradford West MP joined the newly established Social Democratic Party, but he lost the seat at the 1983 general election.
George Galloway of the Respect Party won the seat in the Bradford West by-election, 2012. He received 55.9% of the votes cast.
Boundaries
1885-1918: The Municipal Borough of Bradford wards of Allerton, Bolton, Great Horton, Heaton, and Manningham.
1955-1974: The County Borough of Bradford wards of Allerton, Great Horton, Heaton, Manningham, and Thornton.
1974-1983: The County Borough of Bradford wards of Allerton, Heaton, Little Horton, Manningham, Thornton, and University.
1983-2010: The City of Bradford wards of Clayton, Heaton, Little Horton, Thornton, Toller, and University.
2010–present: The City of Bradford wards of City, Clayton and Fairweather Green, Heaton, Manningham, Thornton and Allerton, and Toller.
Members of Parliament
The constituency was originally created in 1885, but was abolished in 1918. For the 1955 general election the constituency was recreated, following a boundary review.[3]
| Election | Member[4][5][6][7] | Party | Notes | |
|---|---|---|---|---|
| 1885 | Alfred Illingworth | Liberal | MP for Knaresborough 1868–1874, for Bradford 1880–1885 | |
| 1895 | Ernest Flower | Conservative | Defeated in 1906 | |
| 1906 | Fred Jowett | Labour Party | MP for Bradford East 1922–24, 1929–31 | |
| 1918 | constituency abolished | |||
| 1955 | constituency recreated | |||
| 1955 | Arthur Tiley | Conservative | Defeated in 1966 | |
| 1966 | Norman Haseldine | Labour Co-operative | Defeated in 1970 | |
| 1970 | John Wilkinson | Conservative | Defeated in Feb 1974. MP for Ruislip-Northwood from 1979 to 2005 | |
| Feb 1974 | Edward Lyons | Labour | Elected as a Labour MP, defected to the SDP in 1981. Defeated in 1983 | |
| 1981 | Social Democratic | |||
| 1983 | Max Madden | Labour | MP for Sowerby from 1974 to 1979. De-selected as Labour Candidate for 1997 | |
| 1997 | Marsha Singh | Labour | Resigned due to ill health in 2012. | |
| 2012 by-election | George Galloway | Respect | Labour MP for Glasgow Hillhead, 1987–97, and Glasgow Kelvin, 1997–2005. Expelled from Labour Party in 2003. Respect MP for Bethnal Green & Bow, 2005–10 | |
| 2015 | Naz Shah | Labour | Elected as a Labour MP; suspended from the Labour Party 27 April - 5 July 2016. | |
| Apr 2016 | Independent | |||
| July 2016 | Labour | |||
Elections 1955-2015
| Election | Political result | Candidate | Party | Votes | % | ±% | ||
|---|---|---|---|---|---|---|---|---|
| General Election 2015 [8][9] Turnout: 40,290 (63.6%) −1.3 | Labour hold Majority: 11,420 (28.3%) | Naz Shah | Labour | 19,977 | 49.6 | +4.3 | ||
| George Galloway | Respect | 8,557 | 21.2 | +18.1 | ||||
| George Grant | Conservative | 6,160 | 15.3 | −15.8 | ||||
| Harry Boota | UKIP | 3,140 | 7.8 | +5.8 | ||||
| Alun Griffiths | Liberal Democrat | 1,173 | 2.9 | −8.8 | ||||
| Celia Hickson | Green | 1,085 | 2.7 | +0.5 | ||||
| James Kirkcaldy | Independent | 100 | 0.2 | N/A | ||||
| Therese Muchewicz | English Democrat | 98 | 0.2 | N/A | ||||
| Bradford West by-election, 2012 Resignation of Marsha Singh Turnout: 32,905 (50.0%) −14.9 | Respect gain from Labour Majority: 10,140 (30.9%) Swing: 36.6% from Lab to Respect | George Galloway | Respect | 18,341 | 55.9 | +52.8 | ||
| Imran Hussain | Labour | 8,201 | 25.0 | −20.3 | ||||
| Jackie Whiteley | Conservative | 2,746 | 8.4 | −22.7 | ||||
| Jeanette Sunderland | Liberal Democrat | 1,505 | 4.6 | −7.1 | ||||
| Sonja McNally | UKIP | 1,085 | 3.3 | +1.3 | ||||
| Dawud Islam | Green | 481 | 1.5 | −0.8 | ||||
| Neil Craig | Democratic Nationalists | 344 | 1.0 | −0.1 | ||||
| Howling Laud Hope | Monster Raving Loony | 111 | 0.3 | N/A | ||||
| General Election 2010 [10][11] New boundaries Turnout: 40,576 (64.9%) +10.9 | Labour hold Majority: 5,763 (14.2%) Swing: 2.9% from Con to Lab | Marsha Singh | Labour | 18,401 | 45.3 | +5.6 | ||
| Zahid Iqbal | Conservative | 12,638 | 31.1 | −0.2 | ||||
| David Hall-Matthews | Liberal Democrat | 4,732 | 11.7 | −7.4 | ||||
| Jenny Sampson | BNP | 1,370 | 3.4 | −3.5 | ||||
| Arshad Ali | Respect | 1,245 | 3.1 | +3.1 | ||||
| David Ford | Green | 940 | 2.3 | −0.7 | ||||
| Jason Smith | UKIP | 812 | 2.0 | +2.0 | ||||
| Neil Craig | Democratic Nationalists | 438 | 1.1 | +1.1 | ||||
| General Election 2005 [12][13] Turnout: 36,369 (54.0%) +0.4 | Labour hold Majority: 3,026 (8.3%) | Marsha Singh | Labour | 14,570 | 40.1 | −7.9 | ||
| Haroon Rashid | Conservative | 11,544 | 31.7 | −5.4 | ||||
| Mukhtar Ali | Liberal Democrat | 6,620 | 18.2 | +11.8 | ||||
| Paul Cromie | BNP | 2,525 | 6.9 | N/A | ||||
| Parvez Darr | Green | 1,110 | 3.1 | −3.9 | ||||
| General Election 2001 [14][15] Turnout: 38,370 (53.6%) −9.7 | Labour hold Majority: 4,165 (10.9%) | Marsha Singh | Labour | 18,401 | 48.0 | +6.4 | ||
| Mohammed Riaz | Conservative | 14,236 | 37.1 | +4.1 | ||||
| John Robinson | Green | 2,672 | 7.0 | +5.1 | ||||
| Abdul Khan | Liberal Democrat | 2,437 | 6.4 | −8.4 | ||||
| Imran Hussain | UKIP | 427 | 1.1 | N/A | ||||
| Farhan Khokhar | Asian League | 197 | 0.5 | N/A | ||||
| General Election 1997 [16][15] Turnout: 45,568 (63.3%) | Labour hold Majority: 3,877 (8.6%) | Marsha Singh | Labour | 18,932 | 41.6 | −11.7 | ||
| Mohammed Riaz | Conservative | 15,055 | 33.0 | −0.8 | ||||
| Helen Wright | Liberal Democrat | 6,737 | 14.8 | +4.0 | ||||
| Abdul R. Khan | Socialist Labour | 1,551 | 3.4 | |||||
| Christopher Royston | Referendum | 1,348 | 3.0 | |||||
| John Robinson | Green | 861 | 1.9 | |||||
| Gary Osborn | BNP | 839 | 1.8 | |||||
| Sajjad Shah | Socialist Alternative | 245 | 0.5 | |||||
| General election 1992 [17][18] Electorate: 70,016 Turnout: 48,946 (69.91%) | Labour hold Majority: 9,502 (19.41%) | Maxwell Francis Madden | Labour | 26,046 | 53.2 | |||
| Dr. Andrew J. Ashworth | Conservative | 16,544 | 33.8 | |||||
| Alun O. Griffiths | Liberal Democrat | 5,150 | 10.5 | |||||
| Peter Braham | Green | 735 | 1.5 | |||||
| David Musa Pidcock | Islamic Party | 471 | 1.0 | |||||
| General election 1987 [19][20] Electorate: 70,763 Turnout: 70.2% | Labour hold Majority: 7,551 (15.2%) | Maxwell Francis Madden | Labour | 25,775 | 51.9 | |||
| George Iain Duncan Smith | Conservative | 18,224 | 36.7 | |||||
| Manzoor Moghal | Social Democratic | 5,657 | 11.4 | |||||
| General election 1983 [21][22] Electorate: 71,296 Turnout: 68.9% | Labour hold Majority: 3,337 (6.8%) | Maxwell Francis Madden | Labour | 19,499 | 39.7 | |||
| Stephen Richard Day | Conservative | 16,162 | 32.9 | |||||
| Edward Lyons | Social Democratic | 13,301 | 27.1 | |||||
| Ms. B. Slaughter | Workers Revolutionary | 139 | 0.3 | |||||
| General election 1979 [23] Electorate: 65,407 Turnout: 69.1% | Labour hold Majority: 7,755 (17.2%) | Edward Lyons | Labour | 24,309 | 53.8 | |||
| Thomas Stow | Conservative | 16,554 | 36.7 | |||||
| Nicholas Flood | Liberal | 3,668 | 8.1 | |||||
| G. Brown | National Front | 633 | 1.4 | |||||
| General election October 1974 [24] Electorate: 62,684 Turnout: 69.5% | Labour hold Majority: 4,941 (11.35%) | Edward Lyons | Labour | 21,133 | 48.5 | |||
| John Arbuthnot Du Cane Wilkinson | Conservative | 16,192 | 37.2 | |||||
| S. Harris | Liberal | 5,884 | 13.5 | |||||
| Harold Smith | More Prosperous Britain | 339 | 0.8 | |||||
| General election February 1974 [25] New boundaries Electorate: 62,157 Turnout: 77.1% | Labour gain from Conservative Majority: 2,219 (4.6%) | Edward Lyons | Labour | 20,787 | 43.4 | |||
| John Arbuthnot Du Cane Wilkinson | Conservative | 18,568 | 38.7 | |||||
| Roderick Francis Hutton Taylor | Liberal | 7,216 | 15.1 | |||||
| Jim Merrick | Anti-Immigration | 1,164 | 2.4 | |||||
| Ralph Oakden Herbert | Ind Democratic Alliance | 200 | 0.4 | |||||
| General election 1970 [26] Electorate: 53,371 Turnout: 73.8% | Conservative gain from Labour Majority: 1,539 (3.9%) | John Arbuthnot Du Cane Wilkinson | Conservative | 20,475 | 52.0 | |||
| Norman Haseldine | Labour | 18,936 | 48.0 | |||||
| General election 1966 Turnout: 76.61% | Labour Co-op gain from Conservative Majority: 1,543 (4.05%) | Norman Haseldine | Labour Co-op | 19,704 | 52.03 | |||
| Arthur Tiley | Conservative | 18,170 | 47.97 | |||||
| General election 1964 Turnout: 76.79% | Conservative hold Majority: 3,147 (8.05%) | Arthur Tiley | Conservative | 21,121 | 54.02 | |||
| Norman Haseldine | Labour Co-op | 17,974 | 45.98 | |||||
| General election 1959 Turnout: 81.76% | Conservative hold Majority: 5,106 (12.48%) | Arthur Tiley | Conservative | 23,012 | 56.24 | |||
| Sydney Hyam | Labour | 17,906 | 43.76 | |||||
| General election 1955 Turnout: 81.72% | Conservative hold Majority: 3,159 (7.62%) | Arthur Tiley | Conservative | 22,306 | 53.81 | |||
| Mrs. Muriel Ferguson | Labour | 19,147 | 46.19 | |||||
Election results 1885-1918
Elections in the 1880s
| Party | Candidate | Votes | % | ± | |
|---|---|---|---|---|---|
| Liberal | Alfred Illingworth | 4,688 | 57.9 | n/a | |
| Conservative | Henry Byron Reed | 3,408 | 42.1 | n/a | |
| Majority | 1,280 | 15.8 | n/a | ||
| Turnout | 8,092 | 85.9 | n/a | ||
| Liberal win (new seat) | |||||
| Party | Candidate | Votes | % | ± | |
|---|---|---|---|---|---|
| Liberal | Alfred Illingworth | 3,975 | 60.2 | ||
| Liberal Unionist | Archibald William Stirling | 2,623 | 39.8 | -2.3 | |
| Majority | 1,352 | 20.4 | +4.6 | ||
| Turnout | 70.0 | -15.9 | |||
| Liberal hold | Swing | +2.3 | |||
Elections in the 1890s
| Party | Candidate | Votes | % | ± | |
|---|---|---|---|---|---|
| Liberal | Alfred Illingworth | 3,306 | 36.3 | -23.9 | |
| Conservative | Ernest Francis Swan Flower | 3,053 | 33.5 | -6.3 | |
| Independent Labour | Benjamin Tillett | 2,749 | 30.2 | n/a | |
| Majority | 253 | 2.8 | -17.6 | ||
| Turnout | 83.5 | +13.5 | |||
| Liberal hold | Swing | -8.8 | |||
| Party | Candidate | Votes | % | ± | |
|---|---|---|---|---|---|
| Conservative | Ernest Francis Swan Flower | 3,936 | 40.7 | +7.2 | |
| Liberal | John Cousin Horsfall | 3,471 | 35.9 | -0.4 | |
| Ind. Labour Party | Benjamin Tillett | 2,264 | 23.4 | -6.8 | |
| Majority | 465 | 4.8 | 7.6 | ||
| Turnout | 86.3 | +2.8 | |||
| Conservative gain from Liberal | Swing | +3.8 | |||
Elections in the 1900s
| Party | Candidate | Votes | % | ± | |
|---|---|---|---|---|---|
| Conservative | Ernest Francis Swan Flower | 4,990 | 50.2 | +9.5 | |
| Labour | Frederick William Jowett | 4,949 | 49.9 | +26.5 | |
| Majority | 41 | 0.4 | -4.4 | ||
| Turnout | 9,939 | 80.5 | -5.8 | ||
| Conservative hold | Swing | -8.5 | |||
| Party | Candidate | Votes | % | ± | |
|---|---|---|---|---|---|
| Labour | Frederick William Jowett | 4,957 | 39.1 | -10.7 | |
| Conservative | Sir Ernest Francis Swan Flower | 4,147 | 32.7 | -17.5 | |
| Liberal | William Claridge | 3,580 | 28.2 | n/a | |
| Majority | 810 | 6.4 | 6.8 | ||
| Turnout | 90.8 | +10.3 | |||
| Labour gain from Conservative | Swing | +3.4 | |||
Elections in the 1910s
| Party | Candidate | Votes | % | ± | |
|---|---|---|---|---|---|
| Labour | Frederick William Jowett | 8,880 | 66.6 | +27.5 | |
| Conservative | Sir Ernest Francis Swan Flower | 4,461 | 33.4 | +0.7 | |
| Majority | 4,319 | 33.2 | +26.8 | ||
| Turnout | 90.0 | -0.8 | |||
| Labour hold | Swing | +13.4 | |||
| Party | Candidate | Votes | % | ± | |
|---|---|---|---|---|---|
| Labour | Frederick William Jowett | 7,729 | 64.0 | -2.6 | |
| Conservative | Sir Ernest Francis Swan Flower | 4,339 | 36.0 | +2.6 | |
| Majority | 3,390 | 28.0 | -5.2 | ||
| Turnout | 81.4 | -8.6 | |||
| Labour hold | Swing | -2.6 | |||
General Election 1914/15:
Another General Election was required to take place before the end of 1915. The political parties had been making preparations for an election to take place and by the July 1914, the following candidates had been selected;
- Labour: Frederick William Jowett
- Unionist: Sir Ernest Francis Swan Flower
See also
Notes and references
- Notes
- ↑ A borough constituency (for the purposes of election expenses and type of returning officer)
- ↑ As with all constituencies, the constituency elects one Member of Parliament (MP) by the first past the post system of election at least every five years.
- References
- ↑ "Bradford West: Usual Resident Population, 2011". Neighbourhood Statistics. Office for National Statistics. Retrieved 1 February 2015.
- ↑ "Electorate Figures - Boundary Commission for England". 2011 Electorate Figures. Boundary Commission for England. 4 March 2011. Archived from the original on 6 November 2010. Retrieved 13 March 2011.
- ↑ The Bradford West Constituency was created in 1955 after a boundary review. In previous elections the city was divided into four constituencies: Bradford Central, Bradford East, Bradford North and Bradford South.
- ↑ "Hansard 1803-2005". Bradford West 1885-1918. UK Parliament. Retrieved 1 February 2015.
- ↑ "Hansard 1803-2005". Bradford West 1955-. UK Parliament. Retrieved 1 February 2015.
- ↑ Leigh Rayment's Historical List of MPs – Constituencies beginning with "B" (part 5)
- ↑ Craig, F. W. S. (1989) [1974]. British parliamentary election results 1885–1918 (2nd ed.). Chichester: Parliamentary Research Services. p. 81. ISBN 0-900178-27-2.
- ↑ "Election Data 2015". Electoral Calculus. Archived from the original on 17 October 2015. Retrieved 17 October 2015.
- ↑ "Bradford West". BBC News. Retrieved 13 May 2015.
- ↑ "Election Data 2010". Electoral Calculus. Archived from the original on 26 July 2013. Retrieved 17 October 2015.
- ↑ "UK > England > Yorkshire & the Humber > Bradford West". Election 2010. BBC. 7 May 2010. Retrieved 13 May 2010.
- ↑ "Election Data 2005". Electoral Calculus. Archived from the original on 15 October 2011. Retrieved 18 October 2015.
- ↑ "UK General Election results May 2005, part3". Richard Kimber's political science resources. Retrieved 5 July 2010.
- ↑ "Election Data 2001". Electoral Calculus. Archived from the original on 15 October 2011. Retrieved 18 October 2015.
- 1 2 "Bradford West, 1997 & 2001". Richard Kimber's political science resources. Retrieved 5 July 2010.
- ↑ "Election Data 1997". Electoral Calculus. Archived from the original on 15 October 2011. Retrieved 18 October 2015.
- ↑ "Election Data 1992". Electoral Calculus. Archived from the original on 15 October 2011. Retrieved 18 October 2015.
- ↑ "UK General Election results April 1992, part 3". Richard Kimber's political science resources. Retrieved 5 July 2010.
- ↑ "Election Data 1987". Electoral Calculus. Archived from the original on 15 October 2011. Retrieved 18 October 2015.
- ↑ "UK General Election results June 1987, part 3". Richard Kimber's political science resources. Retrieved 6 July 2010.
- ↑ "Election Data 1983". Electoral Calculus. Archived from the original on 15 October 2011. Retrieved 18 October 2015.
- ↑ "UK General Election results June 1983, part 3". Richard Kimber's political science resources. Retrieved 6 July 2010.
- ↑ "UK General Election results May 1979, part 4". Richard Kimber's political science resources. Retrieved 6 July 2010.
- ↑ "UK General Election results October 1974, part 4". Richard Kimber's political science resources. Retrieved 6 July 2010.
- ↑ "UK General Election results February 1974, part 4". Richard Kimber's political science resources. Retrieved 6 July 2010.
- ↑ "UK General Election results 1970, part 4". Richard Kimber's political science resources. Retrieved 6 July 2010.
- 1 2 3 4 5 6 7 8 British Parliamentary Election Results 1885-1918, FWS Craig
- 1 2 3 4 5 6 The Liberal Year Book, 1907
- ↑ Debrett's House of Commons & Judicial Bench, 1886
- ↑ Debrett's House of Commons & Judicial Bench, 1901
- ↑ Debrett's House of Commons & Judicial Bench, 1901
- ↑ Debrett's House of Commons & Judicial Bench, 1916
- ↑ Debrett's House of Commons & Judicial Bench, 1916
External links
- nomis Constituency Profile for Bradford West — presenting data from the ONS annual population survey and other official statistics.