Don Valley (UK Parliament constituency)
Coordinates: 53°29′31″N 1°07′59″W / 53.492°N 1.133°W
| Don Valley | |
|---|---|
|
County constituency for the House of Commons | |
|
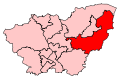
Boundary of Don Valley in South Yorkshire. | |
|
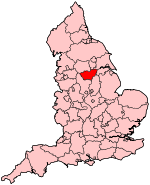
Location of South Yorkshire within England. | |
| County | South Yorkshire |
| Electorate | 73,674 (December 2010)[1] |
| Major settlements | Hatfield, Thorne, and Conisbrough. |
| Current constituency | |
| Created | 1918 |
| Member of parliament | Caroline Flint (Labour) |
| Number of members | One |
| Created from | Doncaster |
| Overlaps | |
| European Parliament constituency | Yorkshire and the Humber |
Don Valley is a constituency[n 1] represented in the House of Commons of the UK Parliament since 1997 by Caroline Flint of the Labour Party.[n 2]
Constituency profile
Created in 1918, Don Valley is a former coal mining area which has elected only Labour MPs since 1922. The current MP is Caroline Flint, first elected in 1997 who is Shadow Secretary of State for Energy and Climate Change and through the Blair Ministry and Brown Ministry served successively as a Health, Employment/Welfare, Housing and Europe Minister of State, her current shadow secretary of state position follows Ed Davey in his cabinet role.
Boundaries
1918-1950: The Urban Districts of Mexborough and Tickhill, and the Rural Districts of Doncaster and Thorne.
1950-1983: The Urban Districts of Adwick-le-Street, Bentley with Arksey, and Tickhill, and the Rural District of Doncaster.
1983-1997: The Metropolitan Borough of Doncaster wards of Conisbrough, Edlington and Warmsworth, Mexborough, Richmond, Rossington, South East, and Southern Parks.
1997-2010: The Metropolitan Borough of Doncaster wards of Conisbrough, Edlington and Warmsworth, Hatfield, Rossington, South East, and Southern Parks.
2010-present: The Metropolitan Borough of Doncaster wards of Conisbrough and Denaby, Edlington and Warmsworth, Finningley, Hatfield, Rossington, Thorne, and Torne Valley.
The current constituency consists of the southern Borough of Doncaster, from Hatfield and the Humberhead Peatlands Nature Reserve in the north and northeast, through Branton, Auckley, and Rossington, to the Torne Valley electoral ward which consists of Wadworth, Tickhill, Braithwell, and in the west Conisbrough.
In boundary changes which took effect at the 2010 election, Sprotbrough was moved to Doncaster North, while in the east the town of Thorne was moved from Doncaster North into Don Valley.
Members of Parliament
| Election | Member[2] | Party | |
|---|---|---|---|
| 1918 | James Walton | National Democratic | |
| 1922 | Tom Williams | Labour | |
| 1959 | Richard Kelley | Labour | |
| 1979 | Michael Welsh | Labour | |
| 1983 | Martin Redmond | Labour | |
| 1997 | Caroline Flint | Labour | |
Elections

Elections in the 2010s
| Party | Candidate | Votes | % | ± | |
|---|---|---|---|---|---|
| Labour | Caroline Flint | 19,621 | 46.2 | +8.2 | |
| Conservative | Carl Jackson | 10,736 | 25.3 | -4.4 | |
| UKIP | Guy Aston | 9,963 | 23.5 | +19.1 | |
| Liberal Democrat | Rene Paterson | 1,487 | 3.5 | -13.6 | |
| TUSC | Steve Williams | 437 | 1.0 | +1.0 | |
| English Democrat | Louise Dutton | 242 | 0.6 | -3.5 | |
| Majority | 8,885 | 20.9 | +12.6 | ||
| Turnout | 42,486 | 59.6 | +0.3 | ||
| Labour hold | Swing | ||||
| Party | Candidate | Votes | % | ± | |
|---|---|---|---|---|---|
| Labour | Caroline Flint | 16,472 | 37.9 | -18.6 | |
| Conservative | Matt Stephens | 12,877 | 29.7 | +2.7 | |
| Liberal Democrat | Edwin Simpson | 7,422 | 17.1 | +0.6 | |
| BNP | Erwin Toseland | 2,112 | 4.9 | N/A | |
| UKIP | William Shaw | 1,904 | 4.4 | N/A | |
| English Democrat | Bernie Aston | 1,756 | 4.0 | N/A | |
| Independent | Martin Williams | 887 | 2.0 | N/A | |
| Majority | 3,595 | 8.3 | -15 | ||
| Turnout | 43,430 | 59.3 | +4.3 | ||
| Labour hold | Swing | ||||
Elections in the 2000s
| Party | Candidate | Votes | % | ± | |
|---|---|---|---|---|---|
| Labour | Caroline Flint | 19,418 | 52.7 | -1.9 | |
| Conservative | Adam Duguid | 10,820 | 29.4 | +0.8 | |
| Liberal Democrat | Stewart Arnold | 6,626 | 18.0 | +6.8 | |
| Majority | 8,598 | 23.3 | -2.7 | ||
| Turnout | 36,864 | 55 | -0.2 | ||
| Labour hold | Swing | -1.3 | |||
| Party | Candidate | Votes | % | ± | |
|---|---|---|---|---|---|
| Labour | Caroline Flint | 20,009 | 54.6 | -3.6 | |
| Conservative | James Browne | 10,489 | 28.6 | +4.0 | |
| Liberal Democrat | Philip Smith | 4,089 | 11.2 | +1.4 | |
| Independent | Terry Wilde | 800 | 2.2 | N/A | |
| UKIP | David Cooper | 777 | 2.1 | N/A | |
| Socialist Labour | Nigel Ball | 466 | 1.3 | -1.1 | |
| Majority | 9,520 | 26.0 | -7.7 | ||
| Turnout | 36,630 | 54.8 | -11.5 | ||
| Labour hold | Swing | ||||
Elections in the 1990s
| Party | Candidate | Votes | % | ± | |
|---|---|---|---|---|---|
| Labour | Caroline Flint | 25,376 | 58.3 | ||
| Conservative | Clare H. Gledhill | 10,717 | 24.6 | ||
| Liberal Democrat | Paul Johnston | 4,238 | 9.7 | ||
| Referendum | Paul R. Davis | 1,379 | 3.2 | ||
| Socialist Labour | Nigel Ball | 1,024 | 2.4 | ||
| Green | Stephen Platt | 493 | 1.1 | ||
| ProLife Alliance | Claire D. Johnson | 330 | 0.8 | ||
| Majority | 14,659 | 33.7 | +10.4 | ||
| Turnout | 43,557 | 66.4 | -9.9 | ||
| Labour hold | Swing | ||||
| Party | Candidate | Votes | % | ± | |
|---|---|---|---|---|---|
| Labour | Martin Redmond | 32,008 | 55.0 | +1.9 | |
| Conservative | N Paget-Brown | 18,474 | 31.7 | −0.5 | |
| Liberal Democrat | M Jevons | 6,920 | 11.9 | −2.7 | |
| Green | TS Platt | 803 | 1.4 | +1.4 | |
| Majority | 13,534 | 23.3 | +2.4 | ||
| Turnout | 58,205 | 76.3 | +2.5 | ||
| Labour hold | Swing | +1.2 | |||
Elections in the 1980s
| Party | Candidate | Votes | % | ± | |
|---|---|---|---|---|---|
| Labour | Martin Redmond | 29,200 | 53.1 | ||
| Conservative | C. H. Gallagher | 17,733 | 32.3 | ||
| Liberal | W. K. Whitaker | 8,027 | 11.9 | ||
| Majority | 11,467 | 20.9 | |||
| Turnout | 73.8 | ||||
| Labour hold | Swing | ||||
| Party | Candidate | Votes | % | ± | |
|---|---|---|---|---|---|
| Labour | Martin Redmond | 23,036 | 45.1 | ||
| Conservative | B. Utting | 16,570 | 32.4 | ||
| Liberal | D. Lange | 11,482 | 22.5 | ||
| Majority | 6,466 | 12.7 | |||
| Turnout | 69.9 | ||||
| Labour hold | Swing | ||||
Elections in the 1970s
| Party | Candidate | Votes | % | ± | |
|---|---|---|---|---|---|
| Labour | Michael Welsh | 39,603 | 55.6 | ||
| Conservative | Roger Freeman | 22,243 | 31.2 | ||
| Liberal | E. Simpson | 8,238 | 11.6 | ||
| Workers Party | I. Connelly | 720 | 1.0 | ||
| Workers Revolutionary | T. McCabe | 398 | 0.6 | ||
| Majority | 17,360 | 24.4 | |||
| Turnout | 74.7 | ||||
| Labour hold | Swing | ||||
| Party | Candidate | Votes | % | ± | |
|---|---|---|---|---|---|
| Labour | Richard Kelley | 41,187 | 63.3 | ||
| Conservative | P. J. Le Bosquet | 13,767 | 21.1 | ||
| Liberal | E. Simpson | 10,161 | 15.6 | ||
| Majority | 27,420 | 42.1 | |||
| Turnout | 73.6 | ||||
| Labour hold | Swing | ||||
| Party | Candidate | Votes | % | ± | |
|---|---|---|---|---|---|
| Labour | Richard Kelley | 48,737 | 70.1 | ||
| Conservative | P. J. Le Bosquet | 20,792 | 29.9 | ||
| Majority | 27,945 | 40.2 | |||
| Turnout | 79.1 | ||||
| Labour hold | Swing | ||||
| Party | Candidate | Votes | % | ± | |
|---|---|---|---|---|---|
| Labour | Richard Kelley | 42,496 | 69.5 | ||
| Conservative | Timothy Walter G Jackson | 18,673 | 30.5 | ||
| Majority | 23,823 | 39.0 | |||
| Turnout | 73.1 | ||||
| Labour hold | Swing | ||||
Elections in the 1960s
| Party | Candidate | Votes | % | ± | |
|---|---|---|---|---|---|
| Labour | Richard Kelley | 43,973 | 74.9 | ||
| Conservative | Richard Storey | 14,738 | 25.1 | ||
| Majority | 29,235 | 49.8 | |||
| Turnout | 78.3 | ||||
| Labour hold | Swing | ||||
| Party | Candidate | Votes | % | ± | |
|---|---|---|---|---|---|
| Labour | Richard Kelley | 42,452 | 71.9 | ||
| Conservative | David Philip Jeffcock | 16,593 | 28.1 | ||
| Majority | 25,859 | 43.8 | |||
| Turnout | 80.8 | ||||
| Labour hold | Swing | ||||
Elections in the 1950s
| Party | Candidate | Votes | % | ± | |
|---|---|---|---|---|---|
| Labour | Richard Kelley | 40,935 | 70.9 | ||
| Conservative | Geoffrey Hugh Dodsworth | 16,787 | 29.1 | ||
| Majority | 24,148 | 41.8 | |||
| Turnout | 83.8 | ||||
| Labour hold | Swing | ||||
| Party | Candidate | Votes | % | ± | |
|---|---|---|---|---|---|
| Labour | Rt Hon. Thomas Williams | 38,433 | 73.7 | ||
| Conservative | Jack Victor Thornton | 13,701 | 26.3 | ||
| Majority | 24,732 | 47.4 | |||
| Turnout | 81.2 | ||||
| Labour hold | Swing | ||||
| Party | Candidate | Votes | % | ± | |
|---|---|---|---|---|---|
| Labour | Rt Hon. Thomas Williams | 39,687 | 74.1 | ||
| Conservative | David S B Hopkins | 13,862 | 25.9 | ||
| Majority | 25,825 | 48.2 | |||
| Turnout | 85.9 | ||||
| Labour hold | Swing | ||||
| Party | Candidate | Votes | % | ± | |
|---|---|---|---|---|---|
| Labour | Rt Hon. Thomas Williams | 39,789 | |||
| Conservative | Douglas Graham | 12,982 | |||
| Communist | Samuel Taylor | 1,007 | |||
| Majority | 26,807 | 49.9 | |||
| Turnout | 87.7 | ||||
| Labour hold | Swing | ||||
Elections in the 1940s
| Party | Candidate | Votes | % | ± | |
|---|---|---|---|---|---|
| Labour | Thomas Williams | 40,153 | 71.7 | ||
| Conservative | J. J. A. N. Ross | 15,832 | 28.3 | ||
| Majority | 24,321 | 43.4 | |||
| Turnout | 73.2 | ||||
| Labour hold | Swing | ||||
Elections in the 1930s
| Party | Candidate | Votes | % | ± | |
|---|---|---|---|---|---|
| Labour | Thomas Williams | 33,220 | 68.9 | ||
| Conservative | John Sinclair Wemyss Arbuthnot | 14,961 | 31.1 | ||
| Majority | 18,259 | 37.8 | |||
| Turnout | 70.0 | ||||
| Labour hold | Swing | ||||
| Party | Candidate | Votes | % | ± | |
|---|---|---|---|---|---|
| Labour | Thomas Williams | 27,599 | 58.6 | ||
| Conservative | Samuel Hardwick | 19,506 | 41.4 | ||
| Majority | 8,093 | 17.2 | |||
| Turnout | 71.2 | ||||
| Labour hold | Swing | ||||
Elections in the 1920s
| Party | Candidate | Votes | % | ± | |
|---|---|---|---|---|---|
| Labour | Thomas Williams | 31,466 | 73.3 | +19.4 | |
| Unionist | Walter Sydney Liddall | 11,467 | 26.7 | -19.4 | |
| Majority | 19,999 | 46.6 | +38.6 | ||
| Turnout | 69.7 | -3.1 | |||
| Labour hold | Swing | +19.4 | |||
| Party | Candidate | Votes | % | ± | |
|---|---|---|---|---|---|
| Labour | Thomas Williams | 14,958 | 53.9 | ||
| Unionist | John Wells Reynolds | 12,463 | 46.1 | ||
| Majority | 2,135 | 7.8 | |||
| Turnout | 72.8 | ||||
| Labour hold | Swing | ||||
| Party | Candidate | Votes | % | ± | |
|---|---|---|---|---|---|
| Labour | Thomas Williams | 12,898 | 60.4 | +13.4 | |
| Unionist | John Wells Reynolds | 8,451 | 39.6 | n/a | |
| Majority | 4,447 | 20.8 | +1.4 | ||
| Turnout | 62.2 | -3.2 | |||
| Labour hold | Swing | n/a | |||
| Party | Candidate | Votes | % | ± | |
|---|---|---|---|---|---|
| Labour | Thomas Williams | 9,903 | 47.0 | ||
| National Liberal | James Walton | 5,793 | 27.6 | ||
| Liberal | John Henry Freeborough | 5,332 | 25.4 | ||
| Majority | 4,106 | 19.4 | |||
| Turnout | 65.4 | ||||
| Labour gain from National Democratic | Swing | ||||
Elections in the 1910s
| Party | Candidate | Votes | % | ± | |
|---|---|---|---|---|---|
| Coalition National Democratic | James Walton | 6,095 | 46.2 | ||
| Liberal | Hastings Lees-Smith | 3,868 | 29.3 | ||
| Labour | Edward Hough | 3,226 | 24.5 | ||
| Majority | 2,227 | 16.9 | |||
| Turnout | 45.9 | ||||
| Coalition National Democratic hold | Swing | ||||
See also
Notes and references
- Notes
- ↑ A county constituency (for the purposes of election expenses and type of returning officer)
- ↑ As with all constituencies, the constituency elects one Member of Parliament (MP) by the first past the post system of election at least every five years.
- References
- ↑ "Electorate Figures - Boundary Commission for England". 2011 Electorate Figures. Boundary Commission for England. 4 March 2011. Retrieved 13 March 2011.
- ↑ Leigh Rayment's Historical List of MPs – Constituencies beginning with "D" (part 2)
- ↑ "Election Data 2015". Electoral Calculus. Archived from the original on 17 October 2015. Retrieved 17 October 2015.
- ↑ "Don Valley". BBC News. Retrieved 14 May 2015.
- ↑ "Election Data 2010". Electoral Calculus. Archived from the original on 17 October 2015. Retrieved 17 October 2015.
- ↑ "Don Valley". BBC News, election 2010. BBC. 2010-05-06. Retrieved 8 May 2010.
- ↑ "Election Data 2005". Electoral Calculus. Archived from the original on 15 October 2011. Retrieved 18 October 2015.
- ↑ "Election Data 2001". Electoral Calculus. Archived from the original on 15 October 2011. Retrieved 18 October 2015.
- ↑ "Election Data 1997". Electoral Calculus. Archived from the original on 15 October 2011. Retrieved 18 October 2015.
- ↑ "Election Data 1992". Electoral Calculus. Archived from the original on 15 October 2011. Retrieved 18 October 2015.
- ↑ "Politics Resources". Election 1992. Politics Resources. 9 April 1992. Retrieved 2010-12-06.
- ↑ "Election Data 1987". Electoral Calculus. Archived from the original on 15 October 2011. Retrieved 18 October 2015.
- ↑ "Election Data 1983". Electoral Calculus. Archived from the original on 15 October 2011. Retrieved 18 October 2015.
Sources
- Guardian Unlimited Politics (Election results from 1992 to the present)
- http://www.psr.keele.ac.uk/ (Election results from 1951 to the present)
- F. W. S. Craig, British Parliamentary Election Results 1918 - 1949
- F. W. S. Craig, British Parliamentary Election Results 1950 - 1970