Putney (UK Parliament constituency)
| Putney | |
|---|---|
|
Borough constituency for the House of Commons | |
|
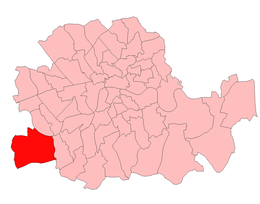
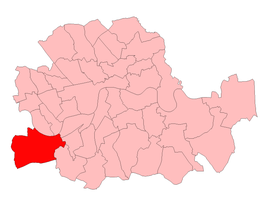
Boundary of Putney in Greater London. | |
| County | Greater London |
| Electorate | 62,153 (December 2010)[1] |
| Current constituency | |
| Created | 1918 |
| Member of parliament | Justine Greening (Conservative) |
| Number of members | One |
| Created from | Wandsworth |
| Overlaps | |
| European Parliament constituency | London |

Putney (Contemp. RP) /pʰʌtni/, (Cons. RP) /-nɪ/, (Est. Eng.) /pʰʌʔni/ is a constituency[n 1] represented in the House of Commons of the UK Parliament since 2005 by Justine Greening of the Conservative Party, who has served as Secretary of State for Education since 14 July 2016.
The Putney constituency is usually among the earliest to return a result on many general election nights.[2]
Boundaries
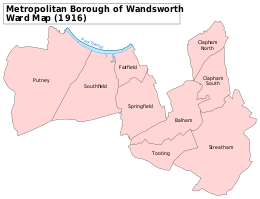
1918-1950: The Metropolitan Borough of Wandsworth wards of Putney and Southfields.
1950-1974: The Metropolitan Borough of Wandsworth wards of Fairfield, Putney, and Southfields.
1983-2010: The London Borough of Wandsworth wards of East Putney, Parkside, Roehampton, Southfields, Thamesfield, West Hill, and West Putney.
2010-present: The London Borough of Wandsworth wards of East Putney, Roehampton, Southfields, Thamesfield, West Hill, and West Putney.
History
When created in 1918 officially as the Putney division of Wandsworth, the constituency was carved out of the former constituency of Wandsworth. The rest of the Wandsworth constituency was divided into Wandsworth Central, Balham and Tooting and Streatham. As across the country, the largely neglected[3] four-word name was officially abolished in 1983 on boundary alterations and replaced by the more commonplace shorthand, Putney.
Putney was held by former Conservative Secretary of State for National Heritage David Mellor from 1979 until 1997, when it was gained by Tony Colman for Labour. This received further media attention as it led to a verbal argument between Mellor and Referendum Party candidate Sir James Goldsmith, who held contrasting views on European integration, during Mellor's vote of thanks.
Putney is also of note for being the first Conservative gain on election night in 2005, when Justine Greening took back the seat from Labour on a two-party swing (Lab-Con) of 6.5%.
Constituency profile
Putney has long had many desirable properties of South-West London[4] with Southfields to the south and the River Thames to the north with Fulham lying across the river.
The majority of the area as in the 19th century is covered by mid-to-high income neighbourhoods[5] whereas the eastern boundary of the seat eating into Wandsworth town centre is more mixed, and Roehampton which has its University consists of, in terms of housing, by a small majority, a diverse council stock that owing to its cost has only fractionally been acquired under the Right to Buy — much of this ward remains in one form or another reliant on social housing.[5]
The local council is not a bellwether of who will win the Putney seat, and for a considerable time has imposed the lowest council tax in the country.[6] Between 1998 and 2005 Putney had a unique attribute of being the only seat in the country where every single component ward elected a full slate of Conservative councillors, yet the constituency had a Labour MP, Tony Colman.
Members of Parliament
Elections
Elections in the 2010s
| Party | Candidate | Votes | % | ± | |
|---|---|---|---|---|---|
| Conservative | Justine Greening | 23,018 | 53.8 | +0.8 | |
| Labour | Sheila Mary Boswell | 12,838 | 30.0 | +2.6 | |
| Liberal Democrat | Andrew James Hallett | 2,717 | 6.3 | −10.6 | |
| Green | Christopher Edward Poole[10] | 2,067 | 4.8 | +3.4 | |
| UKIP | Patricia Mary Ward | 1,989 | 4.6 | +3.5 | |
| Animal Welfare | Guy Richard Dessoy | 184 | 0.4 | N/A | |
| Majority | 10,180 | 23.8 | -0.8 | ||
| Turnout | 42,813 | 67.0 | +2.6 | ||
| Conservative hold | Swing | -0.9 | |||
| Party | Candidate | Votes | % | ± | |
|---|---|---|---|---|---|
| Conservative | Justine Greening | 21,223 | 53.0 | +9.7 | |
| Labour | Stuart King | 11,170 | 27.4 | -10.2 | |
| Liberal Democrat | James Sandbach | 6,907 | 16.9 | +0.6 | |
| Green | Bruce Mackenzie | 591 | 1.4 | -1.3 | |
| BNP | Peter Darby | 459 | 1.1 | N/A | |
| UKIP | Hugo Wareham | 435 | 1.1 | +0.0 | |
| Majority | 10,053 | 24.6 | +19.8 | ||
| Turnout | 40,785 | 64.4 | +4.9 | ||
| Conservative hold | Swing | +9.95 | |||
Elections in the 2000s
| Party | Candidate | Votes | % | ± | |
|---|---|---|---|---|---|
| Conservative | Justine Greening | 15,497 | 42.4 | +4.0 | |
| Labour | Tony Colman | 13,731 | 37.5 | -9.0 | |
| Liberal Democrat | Jeremy Ambache | 5,965 | 16.3 | +2.7 | |
| Green | Keith Magnum | 993 | 2.7 | N/A | |
| UKIP | Anthony Gahan | 388 | 1.1 | +0.1 | |
| Majority | 1,766 | 4.8 | N/A | ||
| Turnout | 36,574 | 59.5 | +3.0 | ||
| Conservative gain from Labour | Swing | +6.50 | |||
| Party | Candidate | Votes | % | ± | |
|---|---|---|---|---|---|
| Labour | Tony Colman | 15,911 | 46.5 | +0.8 | |
| Conservative | Michael Simpson | 13,140 | 38.4 | -0.5 | |
| Liberal Democrat | Anthony Burrett | 4,671 | 13.6 | +2.9 | |
| UKIP | Pat Wild | 347 | 1.0 | +0.5 | |
| ProLife Alliance | Yvonne Windsor | 185 | 0.5 | N/A | |
| Majority | 2,771 | 8.1 | +1.3 | ||
| Turnout | 34,254 | 56.5 | -16.8 | ||
| Labour hold | Swing | +0.65 | |||
Elections in the 1990s
| Party | Candidate | Votes | % | ± | |
|---|---|---|---|---|---|
| Labour | Tony Colman | 20,084 | 45.6 | +9.0 | |
| Conservative | David Mellor | 17,108 | 38.9 | -13.3 | |
| Liberal Democrat | Russell Pyne | 4,739 | 10.8 | +1.2 | |
| Referendum | Sir James Goldsmith | 1,518 | 3.5 | N/A | |
| UKIP | Bill Jamieson | 233 | 0.5 | N/A | |
| Happiness Stan's Freedom to Party | Lenny Beige (AKA Steve Furst) | 101 | 0.2 | N/A | |
| Sportsman's Alliance: Anything but Mellow | Michael Yardley | 90 | 0.2 | N/A | |
| Natural Law | John Small | 66 | 0.2 | -0.1 | |
| Independently Beautiful Party | Ateeka Poole | 49 | 0.1 | N/A | |
| Renaissance Democrat | Dorian Van Braam | 7 | 0.02 | N/A | |
| Majority | 2,976 | 6.8 | N/A | ||
| Turnout | 43,994 | 73.3 | -4.6 | ||
| Labour gain from Conservative | Swing | +11.15 | |||
| Party | Candidate | Votes | % | ± | |
|---|---|---|---|---|---|
| Conservative | David Mellor | 25,188 | 52.2 | +1.7 | |
| Labour | Judith Chegwidden | 17,662 | 36.6 | +0.5 | |
| Liberal Democrat | John Martyn | 4,636 | 9.6 | -2.8 | |
| Green | Keith Hagenbach | 618 | 1.3 | +0.2 | |
| Natural Law | Paul Levy | 139 | 0.3 | N/A | |
| Majority | 7,526 | 15.6 | +1.2 | ||
| Turnout | 48,243 | 77.9 | +2.0 | ||
| Conservative hold | Swing | +0.6 | |||
Elections in the 1980s
| Party | Candidate | Votes | % | ± | |
|---|---|---|---|---|---|
| Conservative | David Mellor | 24,197 | 50.5 | +4.0 | |
| Labour | Peter Hain | 17,290 | 36.1 | +0.2 | |
| Liberal | Sally Harlow | 5,934 | 12.4 | -3.9 | |
| Green | Simon Desorgher | 508 | 1.1 | +0.7 | |
| Majority | 6,907 | 14.4 | +3.7 | ||
| Turnout | 47,929 | 76.0 | +2.4 | ||
| Conservative hold | Swing | +1.9 | |||
| Party | Candidate | Votes | % | ± | |
|---|---|---|---|---|---|
| Conservative | David Mellor | 21,863 | 46.5 | -0.3 | |
| Labour | Peter Hain | 16,844 | 35.9 | -5.6 | |
| Liberal | Charles Welchman | 7,668 | 16.3 | +6.0 | |
| National Front | Michael Connolly | 290 | 0.6 | -0.8 | |
| Ecology | Rose Baillie-Grohman | 190 | 0.4 | N/A | |
| Socialist (GB) | Leonard Chalk | 88 | 0.2 | N/A | |
| Independent | William Williams | 41 | 0.1 | N/A | |
| Majority | 5,019 | 10.7 | +5.3 | ||
| Turnout | 46,984 | 73.6 | -2.5 | ||
| Conservative hold | Swing | +2.65 | |||
Elections in the 1970s
| Party | Candidate | Votes | % | ± | |
|---|---|---|---|---|---|
| Conservative | David Mellor | 23,040 | 46.8 | +7.4 | |
| Labour | Hugh Gater Jenkins | 20,410 | 41.49 | -3.8 | |
| Liberal | Nicholas Couldrey | 5,061 | 10.3 | -3.7 | |
| National Front | James Webster | 685 | 1.4 | N/A | |
| Majority | 2,630 | 5.4 | N/A | ||
| Turnout | 49,196 | 76.1 | +4.3 | ||
| Conservative gain from Labour | Swing | +5.6 | |||
| Party | Candidate | Votes | % | ± | |
|---|---|---|---|---|---|
| Labour | Hugh Gater Jenkins | 21,611 | 45.28 | +4.0 | |
| Conservative | Gerard Wade | 18,836 | 39.5 | +0.9 | |
| Liberal | Adrian Carnegie Slade | 7,159 | 15.0 | -5.2 | |
| More Prosperous Britain | Thomas Keen | 125 | 0.3 | N/A | |
| Majority | 2,775 | 5.8 | +3.1 | ||
| Turnout | 47,731 | 71.8 | -7.8 | ||
| Labour hold | Swing | +1.55 | |||
| Party | Candidate | Votes | % | ± | |
|---|---|---|---|---|---|
| Labour | Hugh Gater Jenkins | 21,680 | 41.3 | -5.1 | |
| Conservative | Gerard Wade | 20,241 | 38.5 | -7.7 | |
| Liberal | Adrian Carnegie Slade | 10,629 | 20.2 | +12.7 | |
| Majority | 1,439 | 2.7 | +0.1 | ||
| Turnout | 52,550 | 79.6 | +10.8 | ||
| Labour hold | Swing | +1.3 | |||
| Party | Candidate | Votes | % | ± | |
|---|---|---|---|---|---|
| Labour | Hugh Gater Jenkins | 25,162 | 47.6 | -0.6 | |
| Conservative | John Wakeham | 23,768 | 45.0 | +3.1 | |
| Liberal | Geoffrey Broughton | 3,887 | 7.4 | -2.5 | |
| Majority | 1,394 | 2.6 | -3.7 | ||
| Turnout | 52,727 | 68.8 | +10.1 | ||
| Labour hold | Swing | -1.95 | |||
Elections in the 1960s
| Party | Candidate | Votes | % | ± | |
|---|---|---|---|---|---|
| Labour | Hugh Gater Jenkins | 26,601 | 48.3 | +3.3 | |
| Conservative | Sir Hugh Nicholas Linstead | 23,114 | 41.9 | -0.6 | |
| Liberal | Adrian Carnegie Slade | 5,420 | 9.8 | -2.7 | |
| Majority | 3,487 | 6.3 | +3.9 | ||
| Turnout | 55,135 | 78.9 | +1.9 | ||
| Labour hold | Swing | +1.95 | |||
| Party | Candidate | Votes | % | ± | |
|---|---|---|---|---|---|
| Labour | Hugh Gater Jenkins | 24,581 | 44.9 | +4.7 | |
| Conservative | Sir Hugh Nicholas Linstead | 23,274 | 42.54 | -6.5 | |
| Liberal | Anthony Cowen | 6,856 | 12.5 | +1.8 | |
| Majority | 1,307 | 2.4 | N/A | ||
| Turnout | 54,711 | 77.0 | -3.2 | ||
| Labour gain from Conservative | Swing | +5.6 | |||
Elections in the 1950s
| Party | Candidate | Votes | % | ± | |
|---|---|---|---|---|---|
| Conservative | Sir Hugh Nicholas Linstead | 28,236 | 49.1 | -8.0 | |
| Labour | Dick Taverne | 23,115 | 40.2 | -2.7 | |
| Liberal | Michael Francis Burns | 6,166 | 10.7 | N/A | |
| Majority | 5,121 | 8.9 | -5.2 | ||
| Turnout | 57,517 | 80.1 | +4.2 | ||
| Conservative hold | Swing | -2.65 | |||
| Party | Candidate | Votes | % | ± | |
|---|---|---|---|---|---|
| Conservative | Sir Hugh Nicholas Linstead | 28,969 | 57.1 | +1.3 | |
| Labour | Bernard Bagnari | 21,774 | 42.9 | -1.3 | |
| Majority | 7,195 | 14.2 | +2.5 | ||
| Turnout | 50,743 | 76.0 | -5.9 | ||
| Conservative hold | Swing | +1.3 | |||
| Party | Candidate | Votes | % | ± | |
|---|---|---|---|---|---|
| Conservative | Sir Hugh Nicholas Linstead | 29,686 | 55.83 | +4.07 | |
| Labour | Eric Hutchison | 23,489 | 44.17 | +2.93 | |
| Majority | 6,197 | 11.7 | +1.1 | ||
| Turnout | 53,175 | 81.9 | +0.1 | ||
| Conservative hold | Swing | +0.57 | |||
| Party | Candidate | Votes | % | ± | |
|---|---|---|---|---|---|
| Conservative | Sir Hugh Nicholas Linstead | 28,007 | 51.76 | +3.22 | |
| Labour | Irene Chaplin | 22,315 | 41.24 | +4.24 | |
| Liberal | Beresford Alton | 3,785 | 7.0 | +0.9 | |
| Majority | 5,692 | 10.52 | -1.0 | ||
| Turnout | 54,107 | 81.8 | +8.2 | ||
| Conservative hold | Swing | -0.51 | |||
Elections in the 1940s
| Party | Candidate | Votes | % | ± | |
|---|---|---|---|---|---|
| Conservative | Hugh Nicholas Linstead | 16,356 | 48.5 | -16.6 | |
| Labour | Percy D. Stewart | 12,469 | 37.0 | +5.1 | |
| Common Wealth | Sir Richard Thomas Dyke Acland | 2,686 | 8.0 | N/A | |
| Liberal | Isaac Joseph Hyam | 2,041 | 6.1 | N/A | |
| Independent | Eleonara Tennant | 144 | 0.4 | N/A | |
| Majority | 3,887 | 11.5 | -21.7 | ||
| Turnout | 33,696 | 75.6 | +5.1 | ||
| Conservative hold | Swing | -10.85 | |||
| Party | Candidate | Votes | % | ± | |
|---|---|---|---|---|---|
| Conservative | Hugh Nicholas Linstead | 8,788 | 74.9 | +9.8 | |
| Independent | Bernard Acworth | 2,939 | 25.1 | N/A | |
| Majority | 5,849 | 49.8 | +16.6 | ||
| Turnout | 11,727 | 23.0 | -43.5 | ||
| Conservative hold | Swing | +20.85 | |||
Elections in the 1930s
| Party | Candidate | Votes | % | ± | |
|---|---|---|---|---|---|
| Conservative | Marcus Reginald Anthony Samuel | 22,288 | 65.1 | -16.5 | |
| Labour | Andrew Aiken Watson | 10,895 | 31.9 | +13.5 | |
| Independent | Violet Van der Elst | 1,021 | 3.0 | N/A | |
| Majority | 11,393 | 33.2 | -30.0 | ||
| Turnout | 34,204 | 68.5 | +2.2 | ||
| Conservative hold | Swing | -15.00 | |||
| Party | Candidate | Votes | % | ± | |
|---|---|---|---|---|---|
| Conservative | Marcus Reginald Anthony Samuel | 15,599 | 54.7 | -26.9 | |
| Labour | Edith Summerskill | 12,936 | 45.3 | +26.9 | |
| Majority | 2,663 | 9.4 | -53.8 | ||
| Turnout | 28,535 | 57.5 | -8.8 | ||
| Conservative hold | Swing | -26.9 | |||
| Party | Candidate | Votes | % | ± | |
|---|---|---|---|---|---|
| Conservative | Samuel Samuel | 27,318 | 81.6 | +17.8 | |
| Labour | John Lawder | 6,172 | 18.4 | -17.8 | |
| Majority | 21,146 | 63.2 | +25.6 | ||
| Turnout | 33,490 | 66.3 | +4.2 | ||
| Conservative hold | Swing | +17.8 | |||
Elections in the 1920s
| Party | Candidate | Votes | % | ± | |
|---|---|---|---|---|---|
| Conservative | Samuel Samuel | 19,657 | 63.8 | -8.6 | |
| Labour | John Lawder | 11,136 | 36.2 | +8.6 | |
| Majority | 8,521 | 27.6 | -17.2 | ||
| Turnout | 30,793 | 62.1 | -6.3 | ||
| Conservative hold | Swing | -8.6 | |||
| Party | Candidate | Votes | % | ± | |
|---|---|---|---|---|---|
| Conservative | Samuel Samuel | 17,341 | 72.4 | N/A | |
| Labour | John Allen | 6,609 | 27.6 | N/A | |
| Majority | 10,732 | 44.8 | N/A | ||
| Turnout | 23,950 | 68.4 | N/A | ||
| Conservative hold | Swing | N/A | |||
| Party | Candidate | Votes | % | ± | |
|---|---|---|---|---|---|
| Conservative | Samuel Samuel | Unopposed | N/A | N/A | |
| Majority | N/A | N/A | N/A | ||
| Turnout | N.A | N/A | N/A | ||
| Conservative hold | Swing | N/A | |||
| Party | Candidate | Votes | % | ± | |
|---|---|---|---|---|---|
| Conservative | Samuel Samuel | 9,739 | 47.2 | -16.4 | |
| Independent Conservative | Brigadier-General Cyril Prescott-Decie | 5,556 | 27.0 | N/A | |
| Liberal | Henry Higgs | 5,317 | 25.8 | N/A | |
| Majority | 4,183 | 20.2 | -7.0 | ||
| Turnout | 20,612 | 61.8 | +18.4 | ||
| Conservative hold | Swing | -16.4 | |||
Elections in the 1910s
| Party | Candidate | Votes | % | ± | |
|---|---|---|---|---|---|
| Coalition Conservative | Samuel Samuel | 8,677 | 63.6 | N/A | |
| National Party | Hon. John Henkins | 4,968 | 36.4 | N/A | |
| Majority | 3,709 | 27.2 | N/A | ||
| Turnout | 13,645 | 43.4 | N/A | ||
| Coalition Conservative win (new seat) | |||||
See also
Notes and references
- Notes
- ↑ A borough constituency (for the purposes of election expenses and type of returning officer)
- References
- ↑ "Electorate Figures - Boundary Commission for England". 2011 Electorate Figures. Boundary Commission for England. 4 March 2011. Retrieved 13 March 2011.
- ↑ BBC1 Election Night 2005 programme, Thursday 5 May 2005
- ↑ Hansard 1803–2005: contributions in Parliament by Hugh Jenkins for example, contributions
- ↑ Booth's Poverty Map of London 1898-99 See Gold/yellow and Red categorisations
- 1 2 2001 Census
- ↑ 'Council Tax in England to Rise by Record Low'BBC News 24 March 2010
- ↑ Leigh Rayment's Historical List of MPs – Constituencies beginning with "P" (part 2)
- ↑ "Election Data 2015". Electoral Calculus. Archived from the original on 17 October 2015. Retrieved 17 October 2015.
- ↑ http://www.wandsworth.gov.uk/info/200327/election_results/1991/parliamentary_election_results_may_2015/2
- ↑ "Wandsworth Green Party". Retrieved 8 December 2014.
- ↑ "Election Data 2010". Electoral Calculus. Archived from the original on 17 October 2015. Retrieved 17 October 2015.
- ↑ "UK General Election results May 2010". Political Science Resourcess. Richard Kimber. Retrieved 5 February 2011.
- ↑ "Election Data 2005". Electoral Calculus. Archived from the original on 15 October 2011. Retrieved 18 October 2015.
- ↑ "UK General Election results May 2005". Political Science Resources. Richard Kimber. Retrieved 5 February 2011.
- ↑ "Election Data 2001". Electoral Calculus. Archived from the original on 15 October 2011. Retrieved 18 October 2015.
- ↑ "Putney: General Election result, June 2001". Political Science Resources. Richard Kimber. Retrieved 5 February 2011.
- ↑ "Election Data 1997". Electoral Calculus. Archived from the original on 15 October 2011. Retrieved 18 October 2015.
- ↑ "Putney: General Election result, May 1997". Political Science Resources. Richard Kimber. Retrieved 5 February 2011.
- ↑ "Election Data 1992". Electoral Calculus. Archived from the original on 15 October 2011. Retrieved 18 October 2015.
- ↑ "UK General Election results April 1992". Political Science Resourcess. Richard Kimber. Retrieved 5 February 2011.
- ↑ "Election Data 1987". Electoral Calculus. Archived from the original on 15 October 2011. Retrieved 18 October 2015.
- ↑ "UK General Election results June 1987". Political Science Resources. Richard Kimber. Retrieved 5 February 2011.
- ↑ "Election Data 1983". Electoral Calculus. Archived from the original on 15 October 2011. Retrieved 18 October 2015.
- ↑ "UK General Election results June 1983". Political Science Resources. Richard Kimber. Retrieved 5 February 2011.
- ↑ "UK General Election results May 1979". Political Science Resources. Richard Kimber. Retrieved 5 February 2011.
- ↑ "UK General Election results October 1974". Political Science Resources. Richard Kimber. Retrieved 5 February 2011.
- ↑ "UK General Election results February 1974". Political Science Resources. Richard Kimber. Retrieved 5 February 2011.
- ↑ "UK General Election results June 1970". Political Science Resources. Richard Kimber. Retrieved 5 February 2011.
- ↑ "UK General Election results March 1966". Political Science Resources. Richard Kimber. Retrieved 5 February 2011.
- ↑ "UK General Election results October 1964". Political Science Resources. Richard Kimber. Retrieved 5 February 2011.
- ↑ "UK General Election results October 1959". Political Science Resources. Richard Kimber. Retrieved 5 February 2011.
- ↑ "UK General Election results May 1955". Political Science Resources. Richard Kimber. Retrieved 5 February 2011.
- ↑ "UK General Election results October 1951". Political Science Resources. Richard Kimber. Retrieved 5 February 2011.
- ↑ "UK General Election results February 1950". Political Science Resources. Richard Kimber. Retrieved 5 February 2011.
- ↑ "UK General Election results July 1945". Political Science Resources. Richard Kimber. Retrieved 5 February 2011.
- 1 2 3 4 5 6 7 8 9 10 Craig, F. W. S. (1983) [1969]. British parliamentary election results 1918–1949 (3rd ed.). Chichester: Parliamentary Research Services. p. 58. ISBN 0-900178-06-X.
Coordinates: 51°27′14″N 0°13′26″W / 51.454°N 0.224°W