Tottenham (UK Parliament constituency)
| Tottenham | |
|---|---|
|
Borough constituency for the House of Commons | |
|
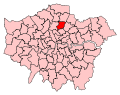
Boundary of Tottenham in Greater London. | |
| County | Greater London |
| Electorate | 79,172 (December 2010)[1] |
| Major settlements | Tottenham |
| Current constituency | |
| Created | 1950 |
| Member of parliament | Rt Hon David Lammy (Labour) |
| Number of members | One |
| Created from | Tottenham North and Tottenham South |
| 1885–1918 | |
| Number of members | One |
| Type of constituency | Borough constituency |
| Replaced by | Tottenham North and Tottenham South |
| Created from | Middlesex |
| Overlaps | |
| European Parliament constituency | London |
Tottenham /ˈtɒtᵊnəm/[2][3] is a constituency[n 1] represented in the House of Commons of the UK Parliament since 2000 by Rt Hon David Lammy, a member of the Labour Party.[n 2]
Boundaries
1885-1918: The parish of Tottenham, and the area included in the Parliamentary Boroughs of Bethnal Green, Hackney, Shoreditch, and Tower Hamlets.
1950-1974: The Municipal Borough of Tottenham wards of Bruce Grove and Stoneleigh, Chestnuts, Green Lanes, Stamford Hill, Town Hall, and West Green.
1974-1983: The London Borough of Haringey wards of Bruce Grove, Green Lanes, High Cross, Seven Sisters, South Tottenham, Tottenham Central, and West Green.
1983-2010: The London Borough of Haringey wards of Bruce Grove, Coleraine, Green Lanes, Harringay, High Cross, Park, Seven Sisters, South Tottenham, Tottenham Central, West Green, and White Hart Lane.
2010-present: The London Borough of Haringey wards of Bruce Grove, Harringay, Northumberland Park, St Ann’s, Seven Sisters, Tottenham Green, Tottenham Hale, West Green, and White Hart Lane.
From 2018 (proposed): The London Borough of Haringey wards of Bruce Grove, Harringay, Northumberland Park, St Ann’s, Stroud Green, Seven Sisters, Tottenham Green, Tottenham Hale, West Green, and White Hart Lane.[4]
The constituency is in the London Borough of Haringey in north London, covering the borough's central and eastern area.
History
1950-date
This constituency was recreated to allow for a narrower, more focussed seat on the largest town or London District itself, of Tottenham. Parts of two wards were in the former Borough of Hornsey which had a seat, abolished in 1983 to make way for Hornsey and Wood Green.
- Political history
During this modern period of existence, Tottenham has been a safe Labour seat,[n 3] however one member in the early 1960s, Alan Brown, defected to become independent in opposition[n 4] and then, crossing the floor, a Conservative but failed by a wide margin to win re-election in 1964 under this new party status. The closest result in the whole period was in 1987 when the Labour candidate won by 8.2% of the vote ahead of the Conservative runner-up.
Since 2005, and reflecting a gradual swing, the runner-up in general elections has been a Liberal Democrat.
- Prominent frontbenchers
Rt Hon David Lammy, the present member was Minister of State for Innovation, Universities and Skills until the change of government in 2010.
Constituency profile
A cosmopolitan, inner-city seat in the London Borough of Haringey, Tottenham has a large ethnic minority population - around a fifth of the residents are black, and there is a large Muslim population. Excluding the South of the Constituency, The percentage of white residents understates the ethnic variety of this constituency, similar to the borough as a whole[5] which includes major Cypriot, Irish, Eastern European, Jewish and Russian communities. The seat has a large central shopping area and the major London football club, Tottenham Hotspur F.C. ('Spurs').
The seat covers Tottenham a large town in north London. To the east is the River Lea with its valley trail and the Tottenham marshes, while to the south the seat takes in Finsbury Park. The constituency includes the Broadwater Farm estate, notorious for the 1985 riots, following which the estate underwent a massive facelift and is no longer a crime blackspot, but other areas of the seat like Northumberland Park continue to be blighted by social problems, including overcrowding.
The proportion of people workless and registered as jobseekers was in November 2012 significantly higher than the national average of 3.8%, at 8.0% of the population based on a statistical compilation by The Guardian. Though this is not the case in the southern side of the constituency. At that time the London average was similar to the national average, at 4.0%.[6]
Members of Parliament
MPs 1885-1918
| Election | Member[7] | Party | |
|---|---|---|---|
| 1885 | Joseph Howard | Conservative | |
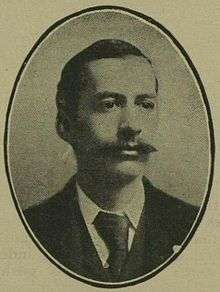
| 1906 | Percy Alden | Liberal | |
| 1918 | constituency abolished: see Tottenham North and Tottenham South | ||
MPs 1950-present
| Election | Member[7] | Party | |
|---|---|---|---|
| 1950 | Frederick Messer | Labour Co-op | |
| 1959 | Alan Grahame Brown | Labour | |
| 1961 | Independent | ||
| 1962 | Conservative | ||
| 1964 | Norman Atkinson | Labour | |
| 1987 | Bernie Grant | Labour | |
| 2000 by-election | Rt Hon David Lammy | Labour | |
Election results
Elections in the 2010s
| Party | Candidate | Votes | % | ± | |
|---|---|---|---|---|---|
| Labour | David Lammy | 28,654 | 67.3 | +8.0 | |
| Conservative | Stefan Mrozinski | 5,090 | 12.0 | −2.9 | |
| Green | Dee Searle[10] | 3,931 | 9.2 | +6.8 | |
| Liberal Democrat | Turhan Ozen | 1,756 | 4.1 | −13.6 | |
| UKIP | Tariq Saeed | 1,512 | 3.6 | +2.4 | |
| TUSC | Jenny Sutton[11] | 1,324 | 3.1 | +0.5 | |
| Peace | Tania Mahmood[12] | 291 | 0.7 | +0.7 | |
| Majority | 23,564 | 55.4 | +13.8 | ||
| Turnout | 42,558 | 60.1 | +1.9 | ||
| Labour hold | Swing | +5.4 | |||
| Party | Candidate | Votes | % | ± | |
|---|---|---|---|---|---|
| Labour | David Lammy | 24,128 | 59.3 | +1.4 | |
| Liberal Democrat | David Schmitz | 7,197 | 17.7 | +0.9 | |
| Conservative | Sean Sullivan | 6,064 | 14.9 | +1.4 | |
| TUSC | Jenny Sutton | 1,057 | 2.6 | N/A | |
| Green | Anne Gray | 980 | 2.4 | −2.2 | |
| UKIP | Winston McKenzie | 466 | 1.1 | N/A | |
| Independent People Together | Neville Watson | 265 | 0.7 | N/A | |
| Christian | Abimbola Kadara | 262 | 0.6 | N/A | |
| Independent | Sheik Thompson | 143 | 0.4 | N/A | |
| Independent | Errol Carr | 125 | 0.3 | N/A | |
| Majority | 16,931 | 41.6 | +0.5 | ||
| Turnout | 40,687 | 58.2 | +10.4 | ||
| Labour hold | Swing | +0.2 | |||
Elections in the 2000s
| Party | Candidate | Votes | % | ± | |
|---|---|---|---|---|---|
| Labour | David Lammy | 18,343 | 57.9 | −9.6 | |
| Liberal Democrat | Wayne Hoban | 5,309 | 16.8 | +7.3 | |
| Conservative | William F. MacDougall | 4,278 | 13.5 | −0.4 | |
| Respect | Miss Janet Alder | 2,014 | 6.4 | N/A | |
| Green | Pete H. McAskie | 1,457 | 4.6 | 0.0 | |
| Socialist Labour | Jaamit Durrani | 263 | 0.8 | N/A | |
| Majority | 13,034 | 41.1 | |||
| Turnout | 31,664 | 47.8 | −0.4 | ||
| Labour hold | Swing | −8.4 | |||
| Party | Candidate | Votes | % | ± | |
|---|---|---|---|---|---|
| Labour | David Lammy | 21,317 | 67.5 | −1.8 | |
| Conservative | Mrs. Uma N. Fernandes | 4,401 | 13.9 | −1.8 | |
| Liberal Democrat | Mrs. Meher Khan | 3,008 | 9.5 | −1.3 | |
| Green | Peter Budge | 1,443 | 4.6 | +1.8 | |
| Socialist Alliance | Weyman Bennett | 1,162 | 3.7 | N/A | |
| Reform 2000 | Unver T. Shefki | 270 | 0.9 | N/A | |
| Majority | 16,916 | 53.6 | |||
| Turnout | 31,601 | 48.2 | −8.7 | ||
| Labour hold | Swing | ||||
| Party | Candidate | Votes | % | ± | |
|---|---|---|---|---|---|
| Labour | David Lammy | 8,785 | 53.5 | −15.8 | |
| Liberal Democrat | Duncan Hames | 3,139 | 19.1 | +7.3 | |
| Conservative | Jane Ellison | 2,634 | 16.0 | +0.3 | |
| Socialist Alliance | Weyman Bennett | 885 | 5.4 | N/A | |
| Green | Peter Budge | 606 | 3.7 | +0.9 | |
| Reform 2000 | Erol Basarik | 177 | 1.1 | N/A | |
| UKIP | Ashwin Tanna | 136 | 0.8 | N/A | |
| Independent Conservative | Dorian L.D. de Braâm | 55 | 0.3 | N/A | |
| Majority | 5,646 | 34.4 | |||
| Turnout | 16,417 | 25.4 | |||
| Labour hold | Swing | ||||
Elections in the 1990s
| Party | Candidate | Votes | % | ± | |
|---|---|---|---|---|---|
| Labour | Bernie Grant | 26,121 | 69.3 | +12.8 | |
| Conservative | Andrew R. Scantlebury | 5,921 | 15.7 | −14.1 | |
| Liberal Democrat | Neil Hughes | 4,064 | 10.8 | −0.6 | |
| Green | Peter Budge | 1,059 | 2.8 | +0.8 | |
| ProLife Alliance | Mrs. Leelan L.E. Tay | 210 | 0.5 | N/A | |
| Workers Revolutionary | Christopher F. Anglin | 181 | 0.5 | N/A | |
| Socialist Equality | Mrs. Tania Kent | 148 | 0.4 | N/A | |
| Majority | 20,200 | 53.6 | |||
| Turnout | 37,704 | 56.9 | |||
| Labour hold | Swing | +14.3 | |||
| Party | Candidate | Votes | % | ± | |
|---|---|---|---|---|---|
| Labour | Bernie Grant | 25,309 | 56.5 | +12.9 | |
| Conservative | Andrew L. Charalambous | 13,341 | 29.8 | −5.6 | |
| Liberal Democrat | Alex S.G. l'Estrange | 5,120 | 11.4 | −6.4 | |
| Green | Peter Budge | 903 | 2.0 | +0.5 | |
| Natural Law | Mrs. Margaret Obomanu | 150 | 0.3 | N/A | |
| Majority | 11,698 | 26.7 | |||
| Turnout | 44,823 | 65.6 | |||
| Labour hold | Swing | ||||
Elections in the 1980s
| Party | Candidate | Votes | % | ± | |
|---|---|---|---|---|---|
| Labour | Bernie Grant | 21,921 | 43.6 | −8.4 | |
| Conservative | Peter Laurence Murphy | 17,780 | 35.4 | +5.2 | |
| Liberal | Stuart James Etherington | 8,983 | 17.8 | +1.6 | |
| Green | Darren John Nicholls | 744 | 1.5 | N/A | |
| Gaitskell Labour | Peter Joseph Nealon | 638 | 1.3 | N/A | |
| Workers Revolutionary | Miss Claire Louise Dixon | 205 | 0.4 | N/A | |
| Majority | 4,141 | 8.2 | |||
| Turnout | 50,271 | 66.1 | |||
| Labour hold | Swing | ||||
| Party | Candidate | Votes | % | ± | |
|---|---|---|---|---|---|
| Labour | Norman Atkinson | 22,423 | 52.0 | −4.9 | |
| Conservative | Peter L. Murphy | 13,027 | 30.2 | −1.8 | |
| Liberal | Alex S.G. l'Estrange | 6,990 | 16.2 | +8.6 | |
| Independent Conservative | W.G. Hurry | 652 | 1.5 | N/A | |
| Majority | 9,396 | 21.8 | |||
| Turnout | 43,092 | 63.4 | +2.2 | ||
| Labour hold | Swing | −1.6 | |||
Elections in the 1970s
| Party | Candidate | Votes | % | ± | |
|---|---|---|---|---|---|
| Labour | Norman Atkinson | 16,299 | 56.9 | −1.9 | |
| Conservative | Matthew Hadrian Marshall Carrington | 9,166 | 32.0 | +7.7 | |
| Liberal | Katherine Alexander | 2,177 | 7.6 | −1.0 | |
| National Front | C.S. Mates | 833 | 2.9 | −5.4 | |
| Workers Revolutionary | Eric D.J. Gutteridge | 94 | 0.3 | N/A | |
| Fellowship | Geoffrey A. Rolph | 71 | 0.3 | N/A | |
| Majority | 7,133 | 24.9 | |||
| Turnout | 28,640 | 61.2 | +5.0 | ||
| Labour hold | Swing | −4.8 | |||
| Party | Candidate | Votes | % | ± | |
|---|---|---|---|---|---|
| Labour | Norman Atkinson | 15,708 | 58.8 | +4.0 | |
| Conservative | Peter Lilley | 6,492 | 24.3 | −1.1 | |
| Liberal | Katherine Alexander | 2,288 | 8.6 | +0.6 | |
| National Front | Roy Painter | 2,211 | 8.3 | +4.2 | |
| Majority | 9,216 | 34,5 | |||
| Turnout | 26,699 | 56.2 | −9.4 | ||
| Labour hold | Swing | ||||
| Party | Candidate | Votes | % | ± | |
|---|---|---|---|---|---|
| Labour | Norman Atkinson | 16,999 | 54.8 | −6.5 | |
| Conservative | J.A. Croft | 7,873 | 25.4 | −13.3 | |
| Liberal | K. Papatheodotou | 2,478 | 8.0 | N/A | |
| National Independence | P. Coney | 1,373 | 4.2 | N/A | |
| National Front | Roy Painter | 1,270 | 4.1 | N/A | |
| Social Democrat | J. Martin | 763 | 2.5 | N/A | |
| Independent Conservative | K. Squire | 274 | 0.9 | N/A | |
| Majority | 9.126 | 29.4 | |||
| Turnout | 48,029 | 65.6 | +10.4 | ||
| Labour hold | Swing | +3.4 | |||
| Party | Candidate | Votes | % | ± | |
|---|---|---|---|---|---|
| Labour | Norman Atkinson | 17,367 | 61.3 | −4.0 | |
| Conservative | Leo T Simmonds | 10,975 | 38.7 | +4.0 | |
| Majority | 6,392 | 22.5 | |||
| Turnout | 28,342 | 55.2 | −4.6 | ||
| Labour hold | Swing | −4.0 | |||
Elections in the 1960s
| Party | Candidate | Votes | % | ± | |
|---|---|---|---|---|---|
| Labour | Norman Atkinson | 17,367 | 65.3 | +10.6 | |
| Conservative | Hugh John Maxwell Dykes | 11,222 | 34.7 | +2.1 | |
| Majority | 9,889 | 30.6 | |||
| Turnout | 28,589 | 59.8 | −4.1 | ||
| Labour hold | Swing | +4.3 | |||
| Party | Candidate | Votes | % | ± | |
|---|---|---|---|---|---|
| Labour | Norman Atkinson | 19,458 | 54.7 | +2.8 | |
| Conservative | Alan Grahame Brown | 11,577 | 32.6 | −3.9 | |
| Liberal | Laurence G Lepley | 4,526 | 12.7 | +1.0 | |
| Majority | 7,881 | 22.2 | |||
| Turnout | 35,561 | 63.9 | −8.1 | ||
| Labour hold | Swing | +3.4 | |||
Elections in the 1950s
| Party | Candidate | Votes | % | ± | |
|---|---|---|---|---|---|
| Labour | Alan Grahame Brown | 22,325 | 51.9 | −8.1 | |
| Conservative | David James George Hennessy | 15,688 | 36.5 | −3.5 | |
| Liberal | Laurence G Lepley | 5,030 | 11.7 | N/A | |
| Majority | 6,637 | 15.4 | |||
| Turnout | 43,043 | 72.0 | +1.8 | ||
| Labour hold | Swing | −2.3 | |||
| Party | Candidate | Votes | % | ± | |
|---|---|---|---|---|---|
| Labour Co-op | Frederick Messer | 26,363 | 60.0 | −2.4 | |
| Conservative | Ian Montagu Fraser | 17,753 | 40.0 | +2.4 | |
| Majority | 8,883 | 20.0 | |||
| Turnout | 44,116 | 70.2 | −9.6 | ||
| Labour hold | Swing | −2.4 | |||
| Party | Candidate | Votes | % | ± | |
|---|---|---|---|---|---|
| Labour Co-op | Frederick Messer | 33,312 | 62.4 | +5.5 | |
| Conservative | Patrick J Faulkner | 20,061 | 37.6 | +6.5 | |
| Majority | 13,251 | 24.8 | |||
| Turnout | 53,373 | 79.8 | −1.2 | ||
| Labour hold | Swing | −0.5 | |||
| Party | Candidate | Votes | % | ± | |
|---|---|---|---|---|---|
| Labour Co-op | Frederick Messer | 30,901 | 56.9 | N/A | |
| Conservative | Patrick J Faulkner | 16,862 | 31.1 | N/A | |
| Liberal | Richard De Courcy Allen | 5,665 | 10.4 | N/A | |
| Communist | G. Cross | 802 | 1.5 | N/A | |
| Majority | 14,039 | 25.9 | N/A | ||
| Turnout | 54,230 | 81.0 | N/A | ||
| Labour win (new seat) | |||||
Elections in the 1910s
| Party | Candidate | Votes | % | ± | |
|---|---|---|---|---|---|
| Liberal | Percy Alden | 12,046 | 52.4 | +1.3 | |
| Conservative | Edward Vyse Sturdy | 10,945 | 47.6 | -1.3 | |
| Majority | 1,101 | 4.8 | +2.6 | ||
| Turnout | 78.6 | -3.7 | |||
| Liberal hold | Swing | +1.3 | |||
| Party | Candidate | Votes | % | ± | |
|---|---|---|---|---|---|
| Liberal | Percy Alden | 12,302 | 51.1 | -7.6 | |
| Conservative | Edward Vyse Sturdy | 11,787 | 48.9 | +7.6 | |
| Majority | 515 | 2.2 | -15.2 | ||
| Turnout | 82.3 | +9.7 | |||
| Liberal hold | Swing | -7.6 | |||
Elections in the 1900s
| Party | Candidate | Votes | % | ± | |
|---|---|---|---|---|---|
| Liberal | Percy Alden | 9,956 | 58.7 | +21.3 | |
| Conservative | Horace Whitehead Chatterton | 7,009 | 41.3 | -21.3 | |
| Majority | 2,947 | 17.4 | -7.8 | ||
| Turnout | 72.5 | ||||
| Liberal gain from Conservative | Swing | +21.3 | |||
| Party | Candidate | Votes | % | ± | |
|---|---|---|---|---|---|
| Conservative | Joseph Howard | 6,721 | 62.6 | ||
| Liberal | George Hay Morgan | 4,009 | 37.4 | ||
| Majority | 2,712 | 25.2 | |||
| Turnout | |||||
| Conservative hold | Swing | ||||
See also
Notes and references
- Notes
- ↑ A borough constituency (for the purposes of election expenses and type of returning officer)
- ↑ As with all constituencies, the constituency elects one Member of Parliament (MP) by the first past the post system of election at least every five years.
- ↑ Most often since 1950 the Labour party candidate has achieved an absolute majority.
- ↑ During the Conservative Government 1957-1964
- References
- ↑ "Electorate Figures - Boundary Commission for England". 2011 Electorate Figures. Boundary Commission for England. 4 March 2011. Archived from the original on 6 November 2010. Retrieved 13 March 2011.
- ↑ "Tottenham". Oxford English Dictionary (3rd ed.). Oxford University Press. September 2005. (Subscription or UK public library membership required.)
- ↑ "How to pronounce place names with "ham" in them". Pronunciationlondon.co.uk. Retrieved 2016-07-27.
- ↑ Boundary Commission for England (12 Aug 2016), Initial proposals for new Parliamentary constituency boundaries in London
- ↑ 2011 census interactive maps Archived January 29, 2016, at the Wayback Machine.
- ↑ Unemployment claimants by constituency The Guardian
- 1 2 Leigh Rayment's Historical List of MPs – Constituencies beginning with "T" (part 2)
- ↑ "Election Data 2015". Electoral Calculus. Archived from the original on 17 October 2015. Retrieved 17 October 2015.
- ↑ "Tottenham parliamentary constituency - Election 2015". BBC News. Retrieved 2016-07-27.
- ↑ "London Green Party general election results". Retrieved 2016-08-20.
- ↑ "Jenny Sutton for Tottenham next May". Harringay online. Retrieved 2016-07-27.
- ↑ "tottenham-parliamentary-constituency". Retrieved 11 April 2015.
- ↑ "Election Data 2010". Electoral Calculus. Archived from the original on 17 October 2015. Retrieved 17 October 2015.
- ↑ "Election Data 2005". Electoral Calculus. Archived from the original on 15 October 2011. Retrieved 18 October 2015.
- ↑ "Election Data 2001". Electoral Calculus. Archived from the original on 15 October 2011. Retrieved 18 October 2015.
- ↑ "Election Data 1997". Electoral Calculus. Archived from the original on 15 October 2011. Retrieved 18 October 2015.
- ↑ "Election Data 1992". Electoral Calculus. Archived from the original on 15 October 2011. Retrieved 18 October 2015.
- ↑ "Election Data 1987". Electoral Calculus. Archived from the original on 15 October 2011. Retrieved 18 October 2015.
- ↑ "Election Data 1983". Electoral Calculus. Archived from the original on 15 October 2011. Retrieved 18 October 2015.
- 1 2 3 4 British parliamentary election results, 1885-1918 (Craig)