Chislehurst (UK Parliament constituency)
| Chislehurst | |
|---|---|
|
Former County constituency for the House of Commons | |
| County | Kent |
| 1918–1997 | |
| Replaced by | Bromley and Chislehurst |
| Created from | Sevenoaks |
Chislehurst was a parliamentary constituency in what is now the London Borough of Bromley. It returned one Member of Parliament to the House of Commons of the Parliament of the United Kingdom.
The constituency was created for the 1918 general election, and abolished for the 1997 general election, when it was partly replaced by the new Bromley and Chislehurst constituency. From 1885, most of the area of this constituency had been included in the Sevenoaks seat.
Boundaries
1918-1945: The Urban Districts of Chislehurst and Foot's Cray, the Rural District of Bromley, and part of the Rural District of Dartford.
1945-1950: The Urban Districts of Chislehurst, and Sidcup and Swanscombe, and part of the Rural District of Dartford.
1950-1974: The Urban Districts of Chislehurst and Sidcup.
1974-1997: The London Borough of Bromley wards of Bickley, Chislehurst, Mottingham, Plaistow and Sundridge, and St Paul's Cray.
Members of Parliament
| Election | Member | Party | |
|---|---|---|---|
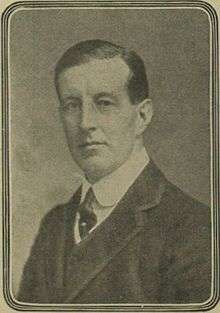
| 1918 | Sir Alfred Smithers | Unionist | |
| 1922 | Robert Nesbitt | Unionist | |
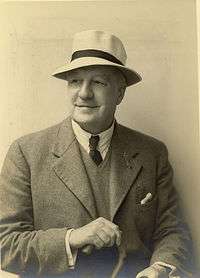
| 1924 | Sir Waldron Smithers | Conservative | |
| 1945 | George Wallace | Labour | |
| 1950 | Patricia Hornsby-Smith | Conservative | |
| 1966 | Alistair Macdonald | Labour | |
| 1970 | Patricia Hornsby-Smith | Conservative | |
| Feb 1974 | Roger Sims | Conservative | |
| 1997 | constituency abolished | ||
Elections
Elections in the 1990s
| Party | Candidate | Votes | % | ± | |
|---|---|---|---|---|---|
| Conservative | Roger Sims | 24,761 | 58.4 | +0.7 | |
| Labour | R. Ian Wingfield | 9,485 | 22.4 | +3.0 | |
| Liberal Democrat | T. William M. Hawthorne | 6,683 | 15.8 | −7.3 | |
| Liberal | I Richmond | 849 | 2.0 | −21.0 | |
| Green | Mrs Frances M. Speed | 652 | 1.5 | +1.5 | |
| Majority | 15,276 | 36.0 | +1.4 | ||
| Turnout | 42,430 | 78.9 | +3.4 | ||
| Conservative hold | Swing | −1.1 | |||
Elections in the 1980s
| Party | Candidate | Votes | % | ± | |
|---|---|---|---|---|---|
| Conservative | Roger Sims | 24,165 | 57.62 | +1.9 | |
| Liberal | Richard Younger-Ross | 9,658 | 23.03 | -2.29 | |
| Labour | Selwyn Hilary Ward | 8,115 | 19.35 | +0.9 | |
| Majority | 14,507 | 34.59 | |||
| Turnout | 41,938 | 75.52 | |||
| Conservative hold | Swing | ||||
| Party | Candidate | Votes | % | ± | |
|---|---|---|---|---|---|
| Conservative | Roger Sims | 22,108 | 55.72 | +1.19 | |
| Liberal | Philip Lingard | 10,047 | 25.32 | +12.81 | |
| Labour | Alistair Huistean MacDonald | 7,320 | 18.45 | -13.18 | |
| BNP | Alfred Waite | 201 | 0.51 | N/A | |
| Majority | 12,061 | 30.4 | |||
| Turnout | 39,676 | 72.71 | |||
| Conservative hold | Swing | ||||
Elections in the 1970s
| Party | Candidate | Votes | % | ± | |
|---|---|---|---|---|---|
| Conservative | Roger Edward Sims | 23,259 | 54.53 | +8.21 | |
| Labour | Christopher Howes | 13,494 | 31.64 | -5.15 | |
| Liberal | Brian Harry Taylor | 5,335 | 12.51 | -4.38 | |
| National Front | Raymond Frederick George Hoy | 564 | 1.32 | N/A | |
| Majority | 9,765 | 22.89 | |||
| Turnout | 42,652 | 78.95 | |||
| Conservative hold | Swing | +6.68 | |||
| Party | Candidate | Votes | % | ± | |
|---|---|---|---|---|---|
| Conservative | Roger Edward Sims | 18,926 | 46.32 | +0.38 | |
| Labour | Alistair Huistean MacDonald | 15,032 | 36.79 | +3.10 | |
| Liberal | John Martin Crowley | 6,900 | 16.89 | -3.47 | |
| Majority | 3,894 | 9.53 | |||
| Turnout | 40,858 | 76.11 | |||
| Conservative hold | Swing | -1.36 | |||
| Party | Candidate | Votes | % | ± | |
|---|---|---|---|---|---|
| Conservative | Roger Edward Sims | 20,595 | 45.95 | ||
| Labour | Alistair Huistean MacDonald | 15,102 | 33.69 | ||
| Liberal | Robert Frank Webster | 9,127 | 20.36 | ||
| Majority | 5,493 | 12.25 | |||
| Turnout | 44,824 | 84.31 | |||
| Conservative hold | Swing | ||||
| Party | Candidate | Votes | % | ± | |
|---|---|---|---|---|---|
| Conservative | Margaret Patricia Hornsby-Smith | 24,650 | 49.10 | ||
| Labour | Alistair Huistean MacDonald | 21,287 | 42.40 | ||
| Liberal | Ron Coverson | 4,268 | 8.50 | ||
| Majority | 3,363 | 6.70 | |||
| Turnout | 75.43 | ||||
| Conservative gain from Labour | Swing | ||||
Elections in the 1960s
| Party | Candidate | Votes | % | ± | |
|---|---|---|---|---|---|
| Labour | Alistair Huistean Macdonald | 22,757 | 45.09 | +3.85 | |
| Conservative | Margaret Patricia Hornsby-Smith | 21,947 | 43.49 | -0.77 | |
| Liberal | Paul Hayden | 5,761 | 11.42 | -3.08 | |
| Majority | 810 | 1.61 | N/A | ||
| Turnout | 50,465 | 84.26 | +1.40 | ||
| Registered electors | 59,895 | ||||
| Labour gain from Conservative | Swing | +2.31 | |||
| Party | Candidate | Votes | % | ± | |
|---|---|---|---|---|---|
| Conservative | Margaret Patricia Hornsby-Smith | 22,251 | 44.26 | -6.05 | |
| Labour | Ronald W Huzzard | 20,736 | 41.24 | +3.98 | |
| Liberal | Sheilagh M Hobday | 7,291 | 14.50 | +2.06 | |
| Majority | 1,515 | 3.01 | -10.04 | ||
| Turnout | 50,278 | 82.86 | -2.95 | ||
| Registered electors | 60,678 | ||||
| Conservative hold | Swing | -5.02 | |||
Elections in the 1950s
| Party | Candidate | Votes | % | ± | |
|---|---|---|---|---|---|
| Conservative | Margaret Patricia Hornsby-Smith | 25,748 | 50.31 | +0.56 | |
| Labour | Margaret Reid | 19,069 | 37.26 | -4.63 | |
| Liberal | David C Blackburn | 6,366 | 12.44 | +4.08 | |
| Majority | 6,679 | 13.05 | +5.20 | ||
| Turnout | 51,183 | 85.81 | +0.94 | ||
| Registered electors | 59,646 | ||||
| Conservative hold | Swing | +2.60 | |||
| Party | Candidate | Votes | % | ± | |
|---|---|---|---|---|---|
| Conservative | Margaret Patricia Hornsby-Smith | 24,514 | 49.75 | -1.04 | |
| Labour | George Douglas Wallace | 20,644 | 41.89 | -7.32 | |
| Liberal | David C Blackburn | 4,120 | 8.36 | N/A | |
| Majority | 3,870 | 7.85 | +6.28 | ||
| Turnout | 49,278 | 84.87 | -3.10 | ||
| Registered electors | 58,063 | ||||
| Conservative hold | Swing | +3.14 | |||
| Party | Candidate | Votes | % | ± | |
|---|---|---|---|---|---|
| Conservative | Margaret Patricia Hornsby-Smith | 31,679 | 50.79 | +6.0 | |
| Labour | George Douglas Wallace | 30,699 | 49.21 | +4.72 | |
| Majority | 980 | 1.57 | +1.27 | ||
| Turnout | 62,378 | 87.97 | +1.66 | ||
| Registered electors | 70,906 | ||||
| Conservative hold | Swing | +0.64 | |||
| Party | Candidate | Votes | % | ± | |
|---|---|---|---|---|---|
| Conservative | Margaret Patricia Hornsby-Smith | 25,215 | 44.79 | +7.49 | |
| Labour | George Douglas Wallace | 25,048 | 44.49 | -4.98 | |
| Liberal | David A Hughes | 6,039 | 10.73 | -2.50 | |
| Majority | 167 | 0.30 | N/A | ||
| Turnout | 56,302 | 86.31 | +13.90 | ||
| Registered electors | 65,231 | ||||
| Conservative gain from Labour | Swing | +6.24 | |||
Elections in the 1940s
| Party | Candidate | Votes | % | ± | |
|---|---|---|---|---|---|
| Labour | George Douglas Wallace | 25,522 | 49.47 | +27.67 | |
| Conservative | Nigel Thomas Loveridge Fisher | 19,243 | 37.30 | -31.61 | |
| Liberal | Ernest Charles Gendall Hawkins | 6,824 | 13.23 | +3.90 | |
| Majority | 6,279 | 12.17 | N/A | ||
| Turnout | 51,589 | 72.41 | +6.35 | ||
| Registered electors | 71,246 | ||||
| Labour gain from Conservative | Swing | +29.64 | |||
Elections in the 1930s
| Party | Candidate | Votes | % | ± | |
|---|---|---|---|---|---|
| Conservative | Sir Waldron Smithers | 38,705 | 68.91 | -16.05 | |
| Labour | WT Colyer | 12,227 | 21.77 | +6.73 | |
| Liberal | J Alun Williams | 5,238 | 9.33 | N/A | |
| Majority | 26,478 | 47.14 | -22.78 | ||
| Turnout | 56,170 | 66.06 | -3.74 | ||
| Registered electors | 85,024 | ||||
| Conservative hold | Swing | -11.39 | |||
| Party | Candidate | Votes | % | ± | |
|---|---|---|---|---|---|
| Conservative | Waldron Smithers | 32,371 | 84.96 | +31.2 | |
| Labour | WT Colyer | 5,731 | 15.04 | -2.4 | |
| Majority | 26,640 | 69.92 | +44.9 | ||
| Turnout | 38,102 | 69.80 | +0.2 | ||
| Registered electors | 54,589 | ||||
| Conservative hold | Swing | +16.8 | |||
Elections in the 1920s
| Party | Candidate | Votes | % | ± | |
|---|---|---|---|---|---|
| Unionist | Waldron Smithers | 16,909 | 53.8 | -12.3 | |
| Liberal | James Douglas Bateman | 9,025 | 28.8 | +12.1 | |
| Labour | James Lamb Thomson | 5,445 | 17.4 | +0.2 | |
| Majority | 7,884 | 25.0 | -23.9 | ||
| Turnout | 69.6 | -3.1 | |||
| Unionist hold | Swing | -12.2 | |||
| Party | Candidate | Votes | % | ± | |
|---|---|---|---|---|---|
| Unionist | Waldron Smithers | 14,440 | 66.1 | ||
| Labour | John Lamb Thomson | 3,757 | 17.2 | ||
| Liberal | Robert Charles Reginald Nevill | 3,647 | 16.7 | ||
| Majority | 10,683 | 48.9 | |||
| Turnout | 72.7 | ||||
| Unionist hold | Swing | ||||
| Party | Candidate | Votes | % | ± | |
|---|---|---|---|---|---|
| Unionist | Robert Chancellor Nesbitt | 9,725 | 55.5 | -9.9 | |
| Liberal | Robert Charles Reginald Nevill | 7,806 | 44.5 | +9.9 | |
| Majority | 1,919 | 11.0 | -19.8 | ||
| Turnout | 60.5 | ||||
| Unionist hold | Swing | -9.9 | |||
| Party | Candidate | Votes | % | ± | |
|---|---|---|---|---|---|
| Unionist | Robert Chancellor Nesbitt | 11,801 | 65.4 | -11.4 | |
| Liberal | David Marshall Mason | 6,256 | 34.6 | n/a | |
| Majority | 5,545 | 30.8 | |||
| Turnout | 63.7 | +13.3 | |||
| Unionist hold | Swing | n/a | |||
Elections in the 1910s
| Party | Candidate | Votes | % | ± | |
|---|---|---|---|---|---|
| Unionist | 8,314 | 76.8 | n/a | ||
| National Party | Alfred Edmunds | 2,507 | 23.2 | n/a | |
| Majority | 5,807 | 53.6 | n/a | ||
| Turnout | 40.4 | n/a | |||
| Unionist win | |||||
- endorsed by the Coalition Government
See also
References
- ↑ "Politics Resources". Election 1992. Politics Resources. 9 April 1992. Retrieved 6 Dec 2010.
- 1 2 "'Chislehurst', June 1983 up to May 1997". ElectionWeb Project. Cognitive Computing Limited. Retrieved 4 March 2016.
- 1 2 3 "'Chislehurst', Feb 1974 - May 1983". ElectionWebProject. Cognitive Computing Limited. Retrieved 20 March 2016.
- ↑ "UK General Election results May 1979". Politics Resources. Retrieved 20 March 2016.
- ↑ "UK General Election results October 1974". Politics Resources. Retrieved 20 March 2016.
- ↑ "UK General Election results February 1974". Politics Resources. Retrieved 20 March 2016.
- ↑ "UK General Election results 1970". Politics Resources. Retrieved 20 March 2016.
- ↑ Kimber, Richard. "UK General Election results 1966". Political Science Resources. Retrieved 14 April 2016.
- ↑
- ↑ Kimber, Richard. "UK General Election results 1964". Political Science Resources. Retrieved 14 April 2016.
- ↑
- ↑ Kimber, Richard. "UK General Election results 1959". Political Science Resources. Retrieved 14 April 2016.
- ↑
- ↑ Kimber, Richard. "UK General Election results 1955". Political Science Resources. Retrieved 14 April 2016.
- ↑
- ↑ Kimber, Richard. "UK General Election results 1951". Political Science Resources. Retrieved 14 April 2016.
- ↑
- ↑ Kimber, Richard. "UK General Election results 1950". Political Science Resources. Retrieved 14 April 2016.
- ↑
- 1 2 3 4 5 6 7 British Parliamentary Election Results 1918-1949, FWS Craig
- ↑ Kimber, Richard. "UK General Election results 1945". Political Science Resources. Retrieved 14 April 2016.
- ↑ Kimber, Richard. "UK General Election results 1935". Political Science Resources. Retrieved 14 April 2016.
- ↑ Kimber, Richard. "UK General Election results 1931". Political Science Resources. Retrieved 14 April 2016.
- ↑ British Parliamentary Election Results 1918-1949, FWS Craig