Acton (UK Parliament constituency)
| Acton | |
|---|---|
|
Former Borough constituency for the House of Commons | |
| County |
1918–1965: Middlesex 1965–1983: Greater London |
| 1950–1983 | |
| Number of members | One |
| Replaced by | Ealing Acton |
| 1918–1950 | |
| Number of members | One |
| Type of constituency | County constituency |
| Created from | Ealing |
Acton was a constituency of the House of Commons of the Parliament of the United Kingdom, created for the 1918 general election. It elected one Member of Parliament (MP) by the first-past-the-post system of election.
The constituency was abolished for the 1983 general election, and replaced by the new Ealing Acton constituency.
Boundaries
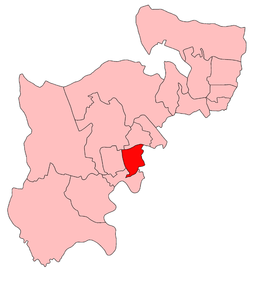
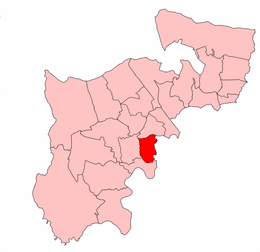
The constituency came into existence in 1918, as a division of the county of Middlesex, to the west of the County of London. It was based on the town of Acton, which like most of Middlesex in the twentieth century became part of the London conurbation. The seat consisted of the Acton Urban District, which became a Municipal Borough in 1921.
In the redistribution of Parliamentary seats, which took effect at the United Kingdom general election, 1950, there was no change to the boundaries. However the constituency was re-classified as a borough constituency.
In 1965 the area became part of the London Borough of Ealing and Greater London.
In the redistribution which took effect at the February 1974 general election, the constituency became a division of Ealing (although it is not customary to use the London Borough prefix for the 1974-1983 period). The constituency consisted of six wards of the London Borough of Ealing - Central, East, Hanger Hill, Heathfield, Southfield and Springfield.
Members of Parliament
| Election | Member | Party | |
|---|---|---|---|
| 1918 | Sir Harry Brittain | Unionist | |
| 1929 | James Shillaker | Labour | |
| 1931 | Hubert Duggan | Conservative | |
| 1943 | Henry Longhurst | Conservative | |
| 1945 | Joseph Sparks | Labour | |
| 1959 | Philip Holland | Conservative | |
| 1964 | Bernard Floud | Labour | |
| 1968 | Kenneth Baker | Conservative | |
| 1970 | Nigel Spearing | Labour | |
| 1974 | Sir George Young | Conservative | |
| 1983 | constituency abolished | ||
Elections
Elections in the 1910s
| Party | Candidate | Votes | % | ± | |
|---|---|---|---|---|---|
| Unionist | 11,671 | n/a | |||
| Labour | Robert Dunsmore | 4,241 | n/a | ||
| Majority | n/a | ||||
| Turnout | n/a | ||||
| Unionist win | |||||
- endorsed by Coalition Government
Elections in the 1920s
| Party | Candidate | Votes | % | ± | |
|---|---|---|---|---|---|
| Unionist | Sir Harry Ernest Brittain | 10,208 | 50.0 | ||
| Labour | Mary Richardson | 5,342 | 26.1 | ||
| Liberal | Charles Neville Douglas Dixey | 4,877 | 23.9 | ||
| Majority | 4,866 | 23.9 | |||
| Turnout | 20,427 | ||||
| Unionist hold | Swing | ||||
| Party | Candidate | Votes | % | ± | |
|---|---|---|---|---|---|
| Unionist | Sir Harry Ernest Brittain | 8,943 | 42.6 | ||
| Labour | Herbert Alphonsus Baldwin | 6,069 | 28.9 | ||
| Liberal | Bertram Arthur Levinson | 5,981 | 28.5 | ||
| Majority | 2,874 | 13.7 | |||
| Turnout | 20,993 | 66.9 | |||
| Unionist hold | Swing | ||||
| Party | Candidate | Votes | % | ± | |
|---|---|---|---|---|---|
| Labour | James Frederick Shillaker | 13,206 | 41.4 | +17.4 | |
| Unionist | Sir Harry Ernest Brittain | 12,739 | 39.9 | -14.2 | |
| Liberal | Frank Medlicott | 5,981 | 18.7 | +5.5 | |
| Majority | 467 | 1.5 | 31.6 | ||
| Turnout | 31,926 | 75.5 | |||
| Labour gain from Unionist | Swing | +15.8 | |||
Elections in the 1930s
| Party | Candidate | Votes | % | ± | |
|---|---|---|---|---|---|
| Conservative | Hubert John Duggan | 24,196 | 66.99 | ||
| Labour | William McLaine | 11,924 | 33.01 | ||
| Majority | 12,272 | 33.98 | |||
| Turnout | 75.5 | ||||
| Conservative gain from Labour | Swing | ||||
| Party | Candidate | Votes | % | ± | |
|---|---|---|---|---|---|
| Conservative | Hubert John Duggan | 19,137 | 58.5 | ||
| Labour | William McLaine | 13,559 | 41.5 | ||
| Majority | 5,578 | 17.1 | |||
| Turnout | 67.8 | ||||
| Conservative hold | Swing | ||||
Elections in the 1940s
| Party | Candidate | Votes | % | ± | |
|---|---|---|---|---|---|
| Conservative | Henry Carpenter Longhurst | 5,014 | 60.3 | ||
| Ind. Labour Party | Walter Padley | 2,336 | 28.1 | N/A | |
| Independent | Dorothy Crisp | 707 | 8.5 | N/A | |
| Independent | Edward Godfrey | 258 | 3.1 | N/A | |
| Majority | 2,678 | 32.2 | |||
| Turnout | 8,315 | ||||
| Conservative hold | Swing | ||||
| Party | Candidate | Votes | % | ± | |
|---|---|---|---|---|---|
| Labour | Joseph Alfred Sparks | 19,950 | 56.1 | ||
| Conservative | Henry Carpenter Longhurst | 12,134 | 34.8 | ||
| Liberal | Francis Joseph Halpin | 3,172 | 9.1 | ||
| Majority | 7,456 | 21.4 | |||
| Turnout | 77.8 | ||||
| Labour gain from Conservative | Swing | ||||
Elections in the 1950s
| Party | Candidate | Votes | % | ± | |
|---|---|---|---|---|---|
| Labour | Joseph Sparks | 21,751 | 49.1 | ||
| Conservative | George F Willment | 19,116 | 43.1 | ||
| Liberal | Miss Pauline Furniss | 2,781 | 6.3 | ||
| Communist | Albert F Papworth | 663 | 1.5 | ||
| Majority | 2,635 | 6.0 | |||
| Turnout | 87.8 | ||||
| Labour hold | Swing | ||||
| Party | Candidate | Votes | % | ± | |
|---|---|---|---|---|---|
| Labour | Joseph Sparks | 23,287 | 52.2 | ||
| Conservative | Lieutenant-Commander Leslie Frank Ramseyer | 21,296 | 47.8 | ||
| Majority | 1,991 | 4.5 | |||
| Turnout | 86.9 | ||||
| Labour hold | Swing | ||||
| Party | Candidate | Votes | % | ± | |
|---|---|---|---|---|---|
| Labour | Joseph Sparks | 20,645 | 50.6 | ||
| Conservative | John Leslie Bott | 20,120 | 49.4 | ||
| Majority | 525 | 1.3 | |||
| Turnout | 82.6 | ||||
| Labour hold | Swing | ||||
| Party | Candidate | Votes | % | ± | |
|---|---|---|---|---|---|
| Conservative | Philip Holland | 19,358 | 51.2 | ||
| Labour | Joseph Sparks | 18,438 | 48.8 | ||
| Majority | 920 | 2.4 | |||
| Turnout | 80.7 | ||||
| Conservative gain from Labour | Swing | ||||
Elections in the 1960s
| Party | Candidate | Votes | % | ± | |
|---|---|---|---|---|---|
| Labour | Bernard Floud | 17,022 | 49.3 | ||
| Conservative | Philip Holland | 14,423 | 41.8 | ||
| Liberal | Barwys Niel Martin-Kaye | 3,049 | 8.8 | ||
| Majority | 2,599 | 7.5 | |||
| Turnout | 77.4 | ||||
| Labour hold | Swing | ||||
| Party | Candidate | Votes | % | ± | |
|---|---|---|---|---|---|
| Labour | Bernard Floud | 18,541 | 57.7 | ||
| Conservative | Kenneth Baker | 13,600 | 42.3 | ||
| Majority | 4,941 | 15.4 | |||
| Turnout | 74.0 | ||||
| Labour hold | Swing | ||||
| Party | Candidate | Votes | % | ± | |
|---|---|---|---|---|---|
| Conservative | Kenneth Baker | 12,242 | 48.67 | +6.36 | |
| Labour | Walter Hamlet Johnson | 8,522 | 33.88 | -23.81 | |
| Liberal | Frank Davis | 2,868 | 11.40 | N/A | |
| National Front | Andrew Fountaine | 1,400 | 5.57 | N/A | |
| Independent | Harold Fox | 75 | 0.30 | N/A | |
| Independent | William Gold | 44 | 0.17 | N/A | |
| Majority | 3,720 | 14.79 | |||
| Turnout | 25,151 | ||||
| Conservative gain from Labour | Swing | ||||
Elections in the 1970s
| Party | Candidate | Votes | % | ± | |
|---|---|---|---|---|---|
| Labour | Nigel John Spearing | 13,960 | 48.0 | -9.7 | |
| Conservative | Kenneth Wilfred Baker | 13,300 | 45.7 | +3.4 | |
| Liberal | Dion Scherer | 1,583 | 5.44 | N/A | |
| Communist | Maurice Costin | 258 | 0.9 | N/A | |
| Majority | 660 | 2.3 | -13.1 | ||
| Turnout | 29,101 | 66.1 | |||
| Labour gain from Conservative | Swing | ||||
| Party | Candidate | Votes | % | ± | |
|---|---|---|---|---|---|
| Conservative | George Samuel Knatchbull Young | 18,492 | 43.3 | ||
| Labour | Nigel John Spearing | 17,041 | 39.9 | ||
| Liberal | Mario Reginald Uziell-Hamilton | 7,160 | 16.8 | ||
| Majority | 1,451 | 3.4 | |||
| Turnout | 75.4 | ||||
| Conservative gain from Labour | Swing | ||||
| Party | Candidate | Votes | % | ± | |
|---|---|---|---|---|---|
| Conservative | George Samuel Knatchbull Young | 17,669 | 45.2 | ||
| Labour | Glen Alexander Barnham | 16,861 | 43.1 | ||
| Liberal | Mario Reginald Uziell-Hamilton | 4,569 | 11.7 | ||
| Majority | 808 | 2.1 | |||
| Turnout | 69.9 | ||||
| Conservative hold | Swing | ||||
| Party | Candidate | Votes | % | ± | |
|---|---|---|---|---|---|
| Conservative | George Samuel Knatchbull Young | 21,056 | 51.9 | ||
| Labour | Glen Alexander Barnham | 15,258 | 37.6 | ||
| Liberal | S Rowley | 3,549 | 8.7 | ||
| National Front | C Wakley | 501 | 1.2 | ||
| Irish National Party | J O'Leary | 243 | 0.6 | ||
| Majority | 5,798 | 14.3 | |||
| Turnout | 71.4 | ||||
| Conservative hold | Swing | ||||