2015 Pacific hurricane season
 | |
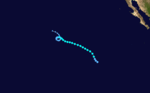
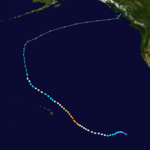
| Season summary map | |
| First system formed | May 28, 2015 |
|---|---|
| Last system dissipated | January 1, 2016 (record latest) |
| Strongest storm1 | Patricia (Most intense hurricane in the Western Hemisphere) – 872 mbar (hPa) (25.75 inHg), 215 mph (345 km/h) |
| Total depressions | 31 (record high) |
| Total storms | 26 |
| Hurricanes | 16 (record high, tied with 1990, 1992, and 2014) |
| Major hurricanes (Cat. 3+) | 11 (record high) |
| Total fatalities | 39 direct, 5 indirect |
| Total damage | $562.63 million (2015 USD) |
| 1Strongest storm is determined by lowest pressure | |
2013, 2014, 2015, 2016, 2017 | |
| Related article | |
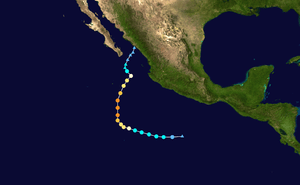
The 2015 Pacific hurricane season is the second-most active Pacific hurricane season on record with 26 named storms, only behind the 1992 season. A record-tying 16 of these storms became hurricanes, and a record 11 storms became major hurricanes throughout the season. The central Pacific, the portion of the eastern Pacific between the International Dateline and 140°W, had its most active year on record, with fifteen tropical cyclones forming in or entering the basin.[1] Moreover, the season was the second most active season in terms of Accumulated Cyclone Energy, with a total of 286 ACE units. The season officially started on May 15 in the East Pacific Ocean and on June 1 in the Central Pacific; they both ended on November 30. These dates conventionally delimit the period of each year when most tropical cyclones form in the Pacific basin.[2] However, the formation of tropical cyclones is possible at any time of the year. This was shown when a tropical depression formed on December 30, dissipating on January 1. The above-average activity during the season was attributed in part to the strong 2014–16 El Niño event.
The season featured Hurricane Patricia, the most intense hurricane ever recorded in the Western Hemisphere, with a central pressure of 872 mbar and 1-minute sustained winds of 215 mph. Patricia was also the strongest landfalling Pacific hurricane on record.
Seasonal forecasts
| Record | Named storms |
Hurricanes | Major hurricanes |
Ref | |
|---|---|---|---|---|---|
| Average (1981-2010): | 15.4 | 7.6 | 3.2 | [3] | |
| Record high activity: | 1992: 27 | 2015: 16 | 2015: 11 | [4] | |
| Record low activity: | 2010: 8 | 2010: 3 | 2003: 0 | [4] | |
| Date | Source | Named storms |
Hurricanes | Major hurricanes |
Ref |
| April 10, 2015 | SMN | 19 | 11 | 4 | [5] |
| May 27, 2015 | CPC | 15-22 | 7-12 | 5-8 | [6] |
| Area | Named storms | Hurricanes | Major hurricanes | Ref | |
| Actual activity: | EPAC | 18 | 13 | 10 | |
| Actual activity: | CPAC | 8 | 3 | 1 | |
| Actual activity: | 26 | 16 | 11 | ||
On April 10, 2015, the Servicio Meteorológico Nacional (SMN) issued its first outlook for the Pacific hurricane season, forecasting 19 named storms, 11 hurricanes, and 4 major hurricanes. The organization listed a set of seasons with similar atmospheric and oceanic conditions, including 1982, 1986, 1991, 1994, 2002, and 2014.[5] On May 27, the National Oceanic and Atmospheric Administration's Climate Prediction Center (CPC) released its forecast for the year, highlighting a 70% chance of an above-average season with 15–22 named storms, 7–12 hurricanes, 5–8 major hurricanes, and an Accumulated Cyclone Energy (ACE) index range of 110–190% of the median. While both organizations cited an intensifying El Niño as a cause of increased activity, the CPC also highlighted the difference in global sea surface temperature patterns in 2015 versus the 1995–2014 period.[5][6] The season ended up exceeding all of these forecasts with 26 named storms, 16 hurricanes, 11 major hurricanes, and an ACE index at more than 200% of the median.
Seasonal summary
The Accumulated Cyclone Energy (ACE) index for the season is 160.4825 units in the East Pacific and 125.55 units in the Central Pacific. The total ACE in each basin amounts to 286.0325.[nb 1]
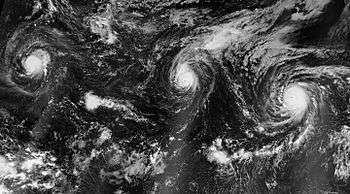
The season's first named storm, Andres, developed two weeks after the official start of the season. Andres later reached peak intensity as a Category 4 hurricane on June 1.[7] On June 3, Blanca became both earliest second hurricane and second major hurricane in the basin since reliable records began.[8][9] This broke the previous record set by Hurricane Cristina the previous year which reached major status on June 12, 2014.[10] On June 13, Hurricane Carlos became the second earliest third hurricane on record.[11] After an inactive period for about a month, activity resumed in mid-July with five systems forming in short succession (three in the central Pacific and two in the east Pacific). One of these systems, Tropical Storm Ela, became the third earliest forming Central Pacific storm on record at the time. Tropical Storm Halola crossed the International Date Line two days later. Next month, hurricanes Guillermo and Hilda both affected Hawaii, while Hurricane Loke became the record breaking fifth named storm in the Central Pacific. Soon after Loke dissipated, Tropical Storm Kilo (which formed before Loke) strengthened into a hurricane while Ignacio and Jimena were being named. Late on August 29th, all three storms exploded into Category 4 major hurricanes. These three major hurricanes were all active on August 29, being the first time in the historical record that three or more major hurricanes existed simultaneously in the Pacific, east of the International Date Line (180ºW).[12][13]
| Most intense Pacific hurricanes[4] | ||||
|---|---|---|---|---|
| Hurricane | Year | Pressure | ||
| hPa | inHg | |||
| 1 | Patricia | 2015 | 872 | 25.75 |
| 2 | Linda | 1997 | 902 | 26.64 |
| 3 | Rick | 2009 | 906 | 26.76 |
| 4 | Kenna | 2002 | 913 | 26.96 |
| 5 | Ava | 1973 | 915 | 27.02 |
| Ioke | 2006 | |||
| 7 | Marie | 2014 | 918 | 27.11 |
| Odile | ||||
| 9 | Guillermo | 1997 | 919 | 27.14 |
| 10 | Gilma | 1994 | 920 | 27.17 |
| Listing is only for tropical cyclones in the Pacific Ocean north of the equator and east of the International Dateline | ||||
Tropical Storm Kevin formed, but was short-lived, and Kevin and Ignacio dissipated on September 5. Hurricane Linda formed on September 6 and peaked as a Category 3 major hurricane, yet dissipated four days later. After Jimena and Linda dissipated on September 10, a short 9 day pause of tropical activity occurred, the first since June. Then, on September 19, Malia developed, with Sixteen-E developing the day after. Sixteen-E quickly moved over Baja California and mainland Mexico before dissipating on September 21. Malia dissipated on September 22, but was followed three days later by Tropical Depression Six-C, which intensified into Tropical Storm Niala southeast of Hawaii, prompting a tropical storm watch for Hawaii County, the "big island" or "Hawai'i". Marty developed, became a hurricane just off Mexico, yet dissipated out to sea. With the formation of Oho on October 3, the 2015 season surpassed 1992 and 1994 as the most active year on record in the Central Pacific.[14] On October 18 Olaf strengthened to a hurricane at 9.4°N making it the southernmost-forming hurricane in the east Pacific basin. Then it strengthened to a major hurricane at 9.9°N, making it the southernmost-forming major hurricane in the basin.[15] In comparison, the southernmost-forming tropical cyclone in the basin is Adolph of 1983 which became a tropical depression at 7.1°N.[16]
When Patricia rapidly intensified into a Category 4 hurricane on October 22, the season became only the second – after 1992 – in the East Pacific satellite era to see the formation of a record ten major hurricanes. Not only did Patricia tie the record for the 2015 East Pacific hurricane season with 1992, it became the strongest hurricane in the basin with a pressure of 892 millibars, breaking the previous record of 902 millibars, set by 1997's Hurricane Linda.[17] Patricia subsequently became the strongest tropical cyclone on record in the Western Hemisphere in terms of barometric pressure. It had a central pressure of 872 millibars, the lowest ever observed by the National Hurricane Center which has jurisdiction in the East Pacific and Atlantic, and the second-lowest pressure globally, behind Typhoon Tip of 1979 which had a central pressure of 870 millibars.[18] Additionally, its maximum sustained winds of 215 mph (345 km/h) were the strongest ever reliably recorded or estimated anywhere globally.[19]
After Olaf dissipated on October 27, there was no further tropical activity until Tropical Storm Rick formed in mid-November. With the formation of Tropical Storm Sandra, two named storms developed within the month of November, which tied the record with 2006 for being the most active November since Pacific hurricane records began. Two days later, Sandra strengthened into a major hurricane, bringing the season total to a record eleven. Its peak winds of 150 mph (240 km/h) surpassed Hurricane Kenneth of 2011 for the strongest November Pacific hurricane in terms of sustained winds, while its minimum central pressure of 934 millibars also surpassed Kenneth for the most intense November Pacific hurricane in terms of central pressure.[20] Sandra's dissipation marked the last tropical storm to exist inside of the hurricane season. Despite this, over a month later, favorable conditions inside the Central Pacific lead to the formation of Tropical Depression Nine-C on December 30. The depression never reached tropical storm strength, leaving the season one named storm shy of tying the 1992 season's record of 27 named storms. Tropical Depression Nine-C dissipated on January 1, marking the latest ending to a Pacific hurricane season on record.
Storms
Hurricane Andres
| Category 4 hurricane (SSHWS) | |||
|---|---|---|---|
| |||
| Duration | May 28 – June 4 | ||
| Peak intensity | 145 mph (230 km/h) (1-min) 937 mbar (hPa) | ||

On May 23, the National Hurricane Center began monitoring the potential for tropical cyclogenesis well south of Mexico over the following days.[21] A large area of disturbed weather formed two days later,[22] steadily organizing to become Tropical Depression One-E at 09:00 UTC on May 28.[23] With an increase in spiral banding and an expanding central dense overcast, the depression was upgraded to Tropical Storm Andres six hours later.[24] Directed west-northwest and eventually northwest by a ridge over Mexico, the cyclone steadily organized despite moderate northerly shear. At 21:00 UTC on May 29, Andres intensified into a Category 1 hurricane,[25] and by 15:00 UTC on May 30, the cyclone further strengthened into a Category 2 hurricane.[26] Although forecasts did not indicate additional strengthening, Andres began a period of rapid deepening the following day, becoming one of only five major hurricanes during the month of May at 21:00 UTC and further intensifying into a Category 4 at 03:00 UTC on June 1.[27][28] Andres ultimately reached its peak intensity early on June 1 with winds of 145 mph (230 km/h).[29] Thereafter, the system moved over cooler waters and into a more stable environment which imparted weakening.[30] Over the next few days, Andres continued to weaken, and by June 3, the NHC determined that it had weakened into a tropical storm.[31] Further weakening ensured, with Andres being designated as a remnant low on June 4.[32]
Moisture extending from the remnants of Andres brought light rain to parts of the Southwest United States, with Phoenix, Arizona having measurable precipitation on June 5 for the first time since records began in 1896.[33] This moisture further extended into Colorado, resulting in scattered severe thunderstorms.[34]
Hurricane Blanca
| Category 4 hurricane (SSHWS) | |||
|---|---|---|---|
| |||
| Duration | May 31 – June 9 | ||
| Peak intensity | 145 mph (230 km/h) (1-min) 936 mbar (hPa) | ||
.jpg)
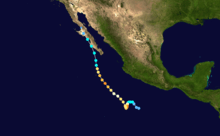
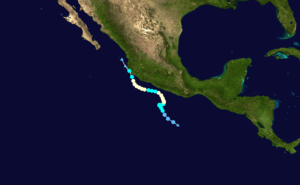
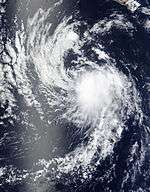
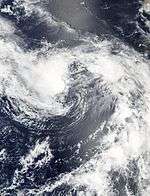
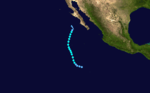
A tropical wave first monitored by the NHC late on May 27 spawned a weak area of low pressure well south of Acapulco, Mexico two days later.[35][36] Plagued by strong upper-level winds from Hurricane Andres, the disturbance slowly organized into the season's second tropical depression at 22:30 UTC on May 31 and further into Tropical Storm Blanca the following day.[37][38] Moving little within a weak steering regime, the cyclone began rapid deepening by June 2 under favorable conditions aloft; at 21:00 UTC, it was upgraded to a Category 1 hurricane.[8] Following the appearance of a pinhole eye,[9] Blanca was upgraded to a Category 4 hurricane at 12:00 UTC on June 3. Shortly thereafter, Blanca reached its peak intensity with winds of 145 mph (230 km/h).[39] Tremendous upwelling of cooler waters, with some areas falling from 30 to 21 °C (86 to 70 °F),[40] resulted in weakening early on June 4.[41] Its eye quickly collapsed and convection diminished as it underwent an eyewall replacement cycle.[42] Reconnaissance aircraft flew into the storm on June 5 and found Blanca to have degraded to Category 1 status.[43] The next day, Blanca rapidly reintensified and reached its secondary peak as a Category 4 with winds of 130 mph (215 km/h).[44] Thereafter, cooler waters and southeasterly wind shear prompted a weakening phase once more.[45] After weakening to a tropical storm on June 7,[46] Blanca made landfall around 12:00 UTC on June 8, near Puerto Cortés with winds of 45 mph (75 km/h) and became the earliest instance of a landfall in the Baja California Peninsula since records began in 1949.[40][47] Thereafter, Blanca weakened to a tropical depression before degenerating into a remnant low early on June 9 as convection diminished.[48][49]
On June 3, precautionary alerts were raised across the southern Baja California Peninsula and much of Western Mexico, due to potential impacts from the hurricane.[50] A collective 3,300 troops from the Mexican Army and Navy were deployed to Baja California Sur to ensure the safety of residents.[51] Although Blanca remained far from Jalisco, large swells and rip currents produced by the hurricane claimed four lives.[52] Across Baja California Sur, high winds downed power lines and left 104,106 residents without electricity. However, around 90 percent of the outages were fixed within 12 hours of the storm.[53] The remnants of Blanca later brought much-needed rain to parts of Southern California. Daily rainfall records were broken in several areas, though accumulations were generally less than 1 in (25 mm).[54] Some flooding took place in Santa Barbara County.[55] Damage across the state amounted to $67,000.[56] Additionally, on June 10, some of Blanca's moisture moved north and brought light showers to the San Francisco Bay Area.[57]
Hurricane Carlos
| Category 1 hurricane (SSHWS) | |||
|---|---|---|---|
| |||
| Duration | June 10 – June 17 | ||
| Peak intensity | 90 mph (150 km/h) (1-min) 978 mbar (hPa) | ||
In early June, a Kelvin wave interacted with a few tropical waves to the south of Mexico. The system gradually organized and was designated as a tropical depression on June 10, while situated about 290 mi (470 km) south-southeast of Puerto Escondido, Oaxaca. Drifting slowly northwestward, the depression was upgraded further to tropical storm intensity. Although persistent wind shear and dry air hampered intensification early on, Carlos strengthened into a hurricane on June 13 after moving into more favorable conditions. However, the return of dry air and upwelling caused the storm to deteriorate into a tropical storm. Paralleling the Mexican coast, Carlos regained hurricane intensity on June 15 and peaked with sustained winds of 90 mph (150 km/h) the next day. Wind shear and dry air afterwards led to rapid weakening, falling to tropical storm intensity on June 17 and degeneration into a remnant area of low pressure hours later.[58]
Carlos' formation prompted coastal authorities to enact precautionary measures along states deemed at risk. In Guerrero, 507 shelters were opened.[59] The NHC also issued several tropical cyclone warnings and watches between June 11 and June 17 from Jalisco to Guerrero. Rough seas along the shore generated by the hurricane caused widespread damage,[58] which included the sinking of 12 ships in Playa Manzanillo harbor.[60] The waves combined with heavy rain to inflict at least 5 million pesos (US$320,000) of damage on Michoacán's coastal installations.[58] Strong winds produced by the passing storm also downed trees, power poles, and billboards, especially in Acapulco.[61] There, 16 homes were swept away by the waves.[62]
Tropical Storm Ela
| Tropical storm (SSHWS) | |||
|---|---|---|---|
| |||
| Duration | July 8 – July 10 | ||
| Peak intensity | 45 mph (75 km/h) (1-min) 1002 mbar (hPa) | ||


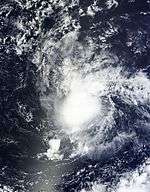
On July 2, the NHC started to monitor a weak tropical disturbance. The system gradually intensified and on July 8, the system intensified into Tropical Depression Four-E as it was located just before entering the area of responsibility of the Central Pacific Hurricane Center.[63] On mid July 9, the depression intensified into Tropical Storm Ela.[64][65] After being a tropical storm for 30 hours, strong wind shear left Ela's center of circulation exposed and prevented organized deep convection from developing and remaining over there. Consequently Ela was downgraded into a depression early the next day, before being declared a remnant low just twelve hours later.[65]
Ela is one of just six tropical cyclones to form as a depression in the east Pacific basin but not be named until entering the central Pacific; the others are Lala, Li, Iniki and Lana. It would be succeeded by Hurricane Ulika a year later. It was also the third earliest storm to form during the calendar year in the central Pacific after Ekeka and Hali.[66] However, it is now considered the fourth earliest storm, due to the formation of Pali the following year.
Tropical Storm Halola
| Tropical storm (SSHWS) | |||
|---|---|---|---|
| |||
| Duration | July 10 – July 12 (exited basin) | ||
| Peak intensity | 60 mph (95 km/h) (1-min) 999 mbar (hPa) | ||

A tropical disturbance well to the southwest of Hawaii organized into Tropical Depression One-C by July 10.[67] Early the next day, the system developed into Tropical Storm Halola. On July 12, Halola crossed the International Date Line and entered the Western Pacific basin, the area of responsibility of the Japan Meteorological Agency.[68]
Tropical Storm Iune
| Tropical storm (SSHWS) | |||
|---|---|---|---|
| |||
| Duration | July 10 – July 13 | ||
| Peak intensity | 40 mph (65 km/h) (1-min) 1003 mbar (hPa) | ||


On July 10, a tropical disturbance organized and became Tropical Depression Two-C. Due to an increase of convection near its centre, the CPHC upgraded the system to Tropical Storm Iune by the next day. But because of its small size and the upper level winds, Iune's circulation became exposed and had weakened to a tropical depression on July 12. By July 13, Iune degenerated to a remnant low as its remnant circulation moved in a slow westward direction.[69]
Hurricane Dolores
| Category 4 hurricane (SSHWS) | |||
|---|---|---|---|
| |||
| Duration | July 11 – July 18 | ||
| Peak intensity | 130 mph (215 km/h) (1-min) 946 mbar (hPa) | ||

A westward-moving tropical wave crossed Central America and entered the Eastern Pacific. On July 11, the system was declared Tropical Depression Five-E. Despite moderate northwesterly wind shear, the depression quickly strengthened into Tropical Storm Dolores and reached hurricane status early on July 13. A day later, when the shear diminished, Dolores rapidly intensified into a Category 4 hurricane with winds 130 mph (215 km/h) and a minimum pressure of 946 mbar (hPa; 27.94 inHg). However, as Dolores approached Socorro Island, the cyclone underwent an eyewall replacement cycle and began to steadily weaken. By the morning of July 17, Dolores had deteriorated to a tropical storm, and eventually degenerated into a post-tropical remnant low about 300 miles west of the Baja California coast the next day. The remnant low slowly curved southwards and dissipated on 22 July west of San Diego, California.[70][71]
Moisture extending from the storm's remnants brought record rains and thunderstorms to Southern California; record monthly rainfall totals include 2 in (51 mm) in San Diego, 1.30 in (33 mm) in Los Angeles, and 1.16 in (29 mm) in Paso Robles. In the foothills and mountains of east San Diego County (e.g. the town of Ramona), rainfall exceeded 4 in (100 mm).[72][73] This had the effect of helping firefighters contain the North Fire,[74] but also resulted in debris flows and rock slides that damaged about 90 homes and submerged cars,[71] and washed out a bridge along Interstate 10.[75] The San Diego River reached levels of 8.9 ft (2.7 m)—just below flood stage—and overflowed its banks in a few areas.[71] Flash flooding in Riverside County washed out a portion of Interstate 10 and a bridge; losses reached $50 million.[76]
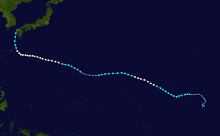
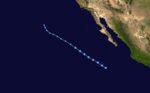
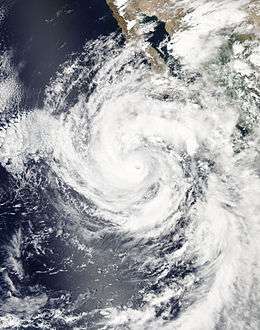
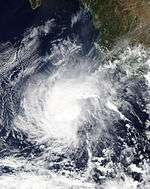
Tropical Storm Enrique
| Tropical storm (SSHWS) | |||
|---|---|---|---|
| |||
| Duration | July 12 – July 18 | ||
| Peak intensity | 50 mph (85 km/h) (1-min) 1000 mbar (hPa) | ||
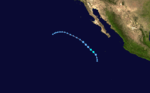
.jpg)
On July 12, a tropical disturbance was upgraded to Tropical Depression Six-E. The storm slowly became Tropical Storm Enrique. Situated in an unfavorable environment, Enrique struggled to intensify. The system reached its peak with 50 mph (85 km/h) winds on July 15. Thereafter, cool waters and stable air took their toll and constrained convection. Despite these conditions, Enrique was able to maintain minimal tropical storm intensity until the next day. Enrique was downgraded into a depression Thursday afternoon, July 16, but was reupgraded into a tropical storm early the next morning. During the afternoon of July 17, Enrique was downgraded into a depression again, before being declared a remnant low later that evening. Throughout its lifetime, Enrique never affected land.[77] The remnants re-curved eastward over the next two days.[78]
Tropical Storm Felicia
| Tropical storm (SSHWS) | |||
|---|---|---|---|
| |||
| Duration | July 23 – July 25 | ||
| Peak intensity | 40 mph (65 km/h) (1-min) 1004 mbar (hPa) | ||
A westward-tracking tropical wave moved off Africa on July 7, crossing into the East Pacific nine days later. The disturbance was initially disorganized, with a broad area of low pressure and intermittent convection; by 0600 UTC on July 23, however, it acquired sufficient organization to be declared a tropical depression about 430 mi (690 km) southwest of the southern tip of Baja California. Six hours later, the depression intensified into Tropical Storm Felicia and attained peak winds of 40 mph (65 km/h). The negative effects of shear, dry air, and cooler waters began to affect Felicia almost immediately, and the cyclone weakened to a tropical depression by 00:00 UTC on July 24. All associated convection with the storm dissipated, marking Felicia's degeneration into a remnant low by 18:00 UTC that day. The low turned west and southwest prior to opening into a trough on July 28.[79]
Tropical Depression Eight-E
| Tropical depression (SSHWS) | |||
|---|---|---|---|
| |||
| Duration | July 27 – July 29 | ||
| Peak intensity | 35 mph (55 km/h) (1-min) 1006 mbar (hPa) | ||


A low pressure area formed in the middle of the Eastern Pacific. Moving northwest, the low slowly intensified into Tropical Depression Eight-E on July 27. However, strong north-northwesterly wind shear prevented it from intensifying into a tropical storm. As Eight-E moved into a drier environment, it failed to sustain deep convection near its center, and eventually degenerated into a remnant low early on July 30. Eight-E's remnants continued tracking in a westward direction and later crossed the International Dateline on August 5.[80]
Hurricane Guillermo
| Category 2 hurricane (SSHWS) | |||
|---|---|---|---|
| |||
| Duration | July 29 – August 7 | ||
| Peak intensity | 110 mph (175 km/h) (1-min) 967 mbar (hPa) | ||


A tropical disturbance gained enough organization to be declared Tropical Depression Nine-E on July 29. Located in an environment of low wind shear, high sea surface temperatures and abundant moisture, conditions were very favorable for strengthening, allowing Nine-E to intensify into Tropical Storm Guillermo just 6 hours later. Continuing to quickly intensify, Guillermo became a hurricane only 36 hours after its formation, and eventually reached peak intensity with winds of 110 mph (175 km/h)—a strong Category 2 hurricane. Soon after, though, Guillermo weakened slightly, but remained at Category 2 strength as it crossed 140°W into the Central Pacific.[81] However, as it neared Hawaii, northeasterly wind shear began to weaken Guillermo,[82] which eventually degraded to a tropical storm.[83] Despite restrengthening slightly on August 3,[84] Guillermo soon resumed weakening and eventually degenerated into a post-tropical cyclone on August 7.[85]
On August 6, some of Guillermo's moisture traveled to Northern California and the San Francisco Bay Area to bring rare dry lightning storms to those areas during the night.[86]
Hurricane Hilda
| Category 4 hurricane (SSHWS) | |||
|---|---|---|---|
| |||
| Duration | August 5 – August 13 | ||
| Peak intensity | 145 mph (230 km/h) (1-min) 937 mbar (hPa) | ||

A tropical wave behind Guillermo gained enough organization to be declared Tropical Depression Ten-E. On August 6, the storm intensified into Tropical Storm Hilda. Amid moderate northeasterly wind shear and warm waters, Hilda gradually strengthened into a hurricane early on August 7. Rapid intensification ensued thereafter as the shear diminished, and Hilda became a Category 3 major hurricane just before entering the Central Pacific.[87] Continuing to rapidly intensify, Hilda eventually reached its peak intensity as a Category 4 hurricane with 145 mph (230 km/h) sustained winds and a minimum pressure of 937 mbar (hPa).[88] However, southwesterly shear from a nearby tropical upper tropospheric trough and the subtropical jet stream began to erode the system, and Hilda weakened back below major hurricane status on August 9.[89] Continuing to gradually weaken while approaching Hawaii, Hilda degraded to a tropical storm two days later,[90] and finally to a tropical depression on August 13.[91] Hilda degenerated into a post-tropical cyclone late the same day,[92] and dissipated early on August 14.
Hilda brought locally heavy rains to the Big Island, though there were no reports of flooding.[93]
Tropical Depression Eleven-E
| Tropical depression (SSHWS) | |||
|---|---|---|---|
| |||
| Duration | August 16 – August 18 | ||
| Peak intensity | 35 mph (55 km/h) (1-min) 1003 mbar (hPa) | ||
A broad area of low pressure around 485 miles (780 km) south-southwest of Cabo San Lucas organized into Tropical Depression Eleven-E on August 16. Moving on a northwesterly to west-northwesterly path, the cyclone failed to intensify and entered an area of unfavorable conditions late on August 17. Southeasterly shear, dry air entrainment and cooler waters caused the depression to lose its deep convection, eventually degenerating into a remnant low by August 18. The low turned to the north-northwest and dissipated 2 days later around 980 miles (1570 km) west of Punta Eugenia.[94]
Hurricane Kilo
| Category 4 hurricane (SSHWS) | |||
|---|---|---|---|
| |||
| Duration | August 20 – September 1 (Exited basin) | ||
| Peak intensity | 140 mph (220 km/h) (1-min) 940 mbar (hPa) | ||

On August 20, a low pressure area south of Hawaii became Tropical Depression Three-C. The storm quickly strengthened into Tropical Storm Kilo and continued strengthening. The storm became a strong tropical storm, and despite being in a favorable environment, Kilo weakened into a Tropical Depression on August 23. The storm would remain at tropical depression strength for the next three days.[95] Despite its instability, Kilo's large-scale circulation brought enhanced moisture into Hawaii, leading to locally heavy rainfall in that state. After nearby Hurricane Loke moved north and dissipated on August 26, Kilo was able to restrengthen into a tropical storm. Intensification resumed the next day, with Kilo reaching hurricane strength. By August 29, Kilo had rapidly intensified into a major hurricane, as the storm neared the International Date Line. Kilo peaked in intensity on August 30 as a Category 4 hurricane with winds of 140 miles per hour and a minimum central pressure of 940 millibars. Kilo was also one of three simultaneous major hurricanes east of the International Date Line along with Ignacio and Jimena, the first such occurrence in recorded history.[12][13] After peaking in strength, Kilo fluctuated between Category 3 and 4 strength as it slowly moved northwest, before slowly weakening below major hurricane status as conditions became less favorable. It crossed the dateline early on September 1, becoming Typhoon Kilo.[96] Kilo continued on to become one of the longest lived tropical cyclones on record, with a total lifespan of 22 days, just over 3 weeks.[97]
Hurricane Loke
| Category 1 hurricane (SSHWS) | |||
|---|---|---|---|
| |||
| Duration | August 21 – August 26 | ||
| Peak intensity | 75 mph (120 km/h) (1-min) 985 mbar (hPa) | ||


A tropical disturbance near the International Dateline developed into Tropical Depression Four-C on August 21. Moving in an erratic northerly motion, the depression intensified into Tropical Storm Loke. Loke was upgraded to a minimal hurricane as it passed over the Papahānaumokuākea Marine National Monument. Soon after, Loke began accelerated north-northwestward as it neared the International Date Line. Loke became extratropical late on August 26 as it crossed the basin. The storm was absorbed by Typhoon Atsani the day after.
Hurricane Ignacio
| Category 4 hurricane (SSHWS) | |||
|---|---|---|---|
| |||
| Duration | August 25 – September 5 | ||
| Peak intensity | 145 mph (230 km/h) (1-min) 942 mbar (hPa) | ||
On August 25, a low-pressure system formed and organized into Tropical Depression Twelve-E, before strengthening into Tropical Storm Ignacio.[98] Ignacio initially moved west-northwest, posing a threat to Hawaii. On August 26, Ignacio became a Category 1 hurricane, while continuing its trek towards Hawaii. Over the next few days, Ignacio struggled to intensify while being impacted by moderate wind shear.[98][99] As wind shear relaxed, Ignacio was able to quickly intensify to major hurricane status on August 29, attaining winds of 115 miles per hour. At this time, the Big Island of Hawaii was placed under a Tropical Storm Watch, as the island began feeling the effects of high surf.[100] Ignacio continued to rapidly intensify, attaining peak intensity at Category 4 status with winds of 145 miles per hour and a minimum central pressure of 942 millibars on August 30.[101] Ignacio was also one of three simultaneous Category 4 hurricanes east of the International Dateline along with Kilo and Jimena, the first such occurrence in recorded history.[12][13]
After peaking in intensity, Ignacio began weakening after moving into a less favorable environment. While weakening, Ignacio passed to the north of the Hawaii island chain, causing only minimal impacts. The storm weakened to tropical storm strength on September 1, but was able to reattain hurricane status. This would repeat once again, before the storm weakened to a tropical storm for the last time, and became post-tropical six hours later.[102] The remnants of Ignacio continued north across the Pacific, before turning to the northeast towards western Canada. On September 8, the extratropical remnants of Ignacio moved onshore in British Columbia, bringing only light rain and few clouds.[103][104]
Hurricane Jimena
| Category 4 hurricane (SSHWS) | |||
|---|---|---|---|
| |||
| Duration | August 26 – September 10 | ||
| Peak intensity | 155 mph (250 km/h) (1-min) 932 mbar (hPa) | ||


A westward-moving low pressure area organized into a tropical depression on August 26, around 640 mi (1030 km) southwest of Manzanillo, Mexico.[105] The next day, the depression developed a tight inner core with sustained gale-force winds; accordingly, it was named Jimena by the NHC.[106] Moving over very warm waters near 30°C (86°F) and located in an environment of low wind shear and abundant moisture, Jimena underwent a period of rapid deepening over the next 48 hours.[105] The NHC upgraded Jimena to a hurricane merely 30 hours after being named,[107] and further to a major hurricane 18 hours later.[108] Early on August 29, Jimena reached its peak intensity with winds of 155 mph (250 km/h)—just below category 5 status on the Saffir-Simpson hurricane wind scale—and a minimum barometric pressure of 932 mbar (hPa; 27.52 inHg).[105] Soon after, Jimena turned to the west-northwest and underwent an eyewall replacement cycle.[109] Despite weakening slightly, Jimena remained at category 4 status, thus becoming one of three simultaneous Category 4 major hurricanes east of the International Date Line on August 30—the first such occurrence of its kind.[13]
Early on August 31, Jimena completed the eyewall replacement cycle and quickly regained 150 mph (240 km/h) winds.[110] However, upwelling of cooler waters beneath the hurricane and entrainment of mid-level dry air into the circulation, as well as a second eyewall replacement cycle, resulted in a steady weakening.[105] The next day, Jimena crossed 140°W as a category 3 hurricane and entered the jurisdiction of the CPHC.[105][111] Jimena continued to weaken slowly amid cooling sea surface temperatures and increasing northerly wind shear, eventually degrading below hurricane status on September 5.[105][112] Curving to the northwest, bursts of convection maintained Jimena as a tropical storm, in spite of westerly wind shear in excess of 20 knots causing the low-level circulation center to be exposed.[113][114] Devoid of deep convection near its center, Jimena eventually weakened to a tropical depression on September 9 as it turned west-southwestwards towards the Hawaiian islands.[115] Succumbing to the strong shear, Jimena degenerated into a remnant low and dissipated soon after.[105] Jimena never posed a threat to land, only bringing scattered heavy rains to Hawaii.[116]
Tropical Storm Kevin
| Tropical storm (SSHWS) | |||
|---|---|---|---|
| |||
| Duration | August 31 – September 5 | ||
| Peak intensity | 60 mph (95 km/h) (1-min) 998 mbar (hPa) | ||

A tropical wave crossed Central America on August 25. Although it initially only produced transient bursts of convection, slow organization of the feature led to the formation of a tropical depression by 18:00 UTC on August 31 while located well south of Baja California. Steered northwest and the north-northwest, the cyclone intensified into Tropical Storm Kevin by 18:00 UTC the next day while being plagued by moderate wind shear. After reaching peak winds of 60 mph (95 km/h) on September 3, a further increase in upper-level winds caused the low- and mid-level circulations to become displaced. Devoid of deep convection, Kevin degenerated to a remnant low by 12:00 UTC on September 5; the remnant circulation drifted northwest and dissipated the following day.[117]
Hurricane Linda
| Category 3 hurricane (SSHWS) | |||
|---|---|---|---|
| |||
| Duration | September 6 – September 10 | ||
| Peak intensity | 125 mph (205 km/h) (1-min) 950 mbar (hPa) | ||

Early in September, a cluster of clouds began to organize into a tropical system. At 03:00 UTC on September 6, they organized enough to be called Tropical Depression Fifteen-E. Twelve hours later, the depression organized enough to be classified as a tropical storm and was given the name Linda. Linda rapidly strengthened as it moved on a northwestward course and became a hurricane just twelve hours after becoming a tropical storm due to large amounts of deep convection forming around the center. Linda then became a Category 2 hurricane. After stalling at Category 2 intensity, Linda again rapidly intensified, this time to a Category 3 major hurricane. Less than a day after becoming a major hurricane, Linda rapidly weakened due to increasing wind shear and decreasing water temperatures, becoming a remnant low less than a week after forming.[118]
Monsoonal moisture pulled north from Linda brought thunderstorms to portions of California. Flooding and rock slides prompted numerous road closures. One person drowned in the San Bernardino National Forest. Remnants moisture from Linda with a weak cold front also caused record heavy rainfall in Los Angeles on September 15,[119][120] with 3 swift water rescues and roughly 2 inches of rain across the L.A. basin.[121]
According to San Jose State University, Linda's remnants may have also contributed to the severity of the Valley Fire.[122]
Tropical Storm Malia
| Tropical storm (SSHWS) | |||
|---|---|---|---|
| |||
| Duration | September 18 – September 22 | ||
| Peak intensity | 50 mph (85 km/h) (1-min) 992 mbar (hPa) | ||

After more than a week of inactivity, a tropical disturbance intensified into Tropical Depression Five-C east of the International Dateline on September 19. The depression moved north-northeast, before it crossed Hawaii and was upgraded to Tropical Storm Malia on September 21. However, Malia weakened into a post-tropical cyclone on the next day, shortly before being absorbed into a frontal system.[123]
Tropical Depression Sixteen-E
| Tropical depression (SSHWS) | |||
|---|---|---|---|
| |||
| Duration | September 20 – September 21 | ||
| Peak intensity | 35 mph (55 km/h) (1-min) 1001 mbar (hPa) | ||


A tropical wave gained enough organization to be declared Tropical Depression Sixteen-E on September 20. Located in an environment of strong southerly shear, the depression failed to intensify into a tropical storm. The next day, the heavily sheared system made landfall on Baja California, then on Isla Tiburon, and finally in Sonora, Mexico. It dissipated just hours later, with its remnants going on to affect parts of Arizona and New Mexico.[124]
Widespread heavy rains in Baja California and Sonora caused heavy flooding. Preliminary damage estimates in El Fuerte, Sinaloa, reached 300 million pesos (US$17.7 million).[124][125] The remnant low brought considerable moisture to the Desert Southwest, and later combined with other systems to produce flooding across the Great Plains and Upper Midwest.[124][126] Rainfall in Roswell, New Mexico, reached 3 in (76 mm). One person drowned along the Rio Grande in New Mexico.[127] Flooding also took place near Phoenix, Arizona.[126]
Tropical Storm Niala
| Tropical storm (SSHWS) | |||
|---|---|---|---|
| |||
| Duration | September 25 – September 29 | ||
| Peak intensity | 65 mph (100 km/h) (1-min) 992 mbar (hPa) | ||


On September 25, a low pressure area became Tropical Depression Six-C. It was upgraded into Tropical Storm Niala soon after, and the storm headed west-northwest towards Hawaii. Niala reached its peak intensity with winds of 65 mph, and a pressure of 992 mbars. At this point, Tropical Storm Warnings were issued for the Big Island, as were High Surf & Marine Advisories for the same area. Throughout September 26, forecasts called for a westwards turn, just barely missing the Big Island. The next day, however, it became evident that Niala was turning more towards the southwest, sparing Hawaii from landfall. At this time, Niala dropped to 50 mph winds, and subsequently degraded into a depression on the 28th. By September 29, unfavorable conditions including High Wind Shear weakened the storm even more, and Niala degenerated into a Post-Tropical Cyclone late on the 29th.[128] The CPHC gave the system a low chance of regeneration, and the remnants of the storm continued westwards, dissipating on October 1.
Hurricane Marty
| Category 1 hurricane (SSHWS) | |||
|---|---|---|---|
| |||
| Duration | September 26 – September 30 | ||
| Peak intensity | 80 mph (130 km/h) (1-min) 987 mbar (hPa) | ||


A tropical wave, the northern portion of which led to the formation of the Atlantic's Tropical Depression Nine, emerged off the western coast of Africa on September 10. Steered steadily westward, the wave entered the East Pacific where deep convection coalesced around a well-defined center; this led to the formation of a tropical depression about 335 mi (540 km) southwest of Acapulco, Mexico by 18:00 UTC on September 26. The depression intensified into Tropical Storm Marty six hours later as it drifted north. Amid an environment conducive for strengthening, Marty reached hurricane intensity at 12:00 UTC on September 28 and attained peak winds of 80 mph (130 km/h) shortly thereafter. Wind shear abruptly increased following peak intensity, causing the cyclone to weaken quickly; it was downgraded to a tropical storm at 06:00 UTC on September 29 and degenerated into a remnant low a day later. The low eventually dissipated south of the Mexico coastline on October 4.[129]
Heavy rains and flooding from the remnants of Marty rendered 35,000 people homeless in Sonora. Flooding in Guaymas damaged 800 homes and 400 vehicles; three people sustained injuries.[130]
Hurricane Oho
| Category 2 hurricane (SSHWS) | |||
|---|---|---|---|
| |||
| Duration | October 3 – October 8 | ||
| Peak intensity | 110 mph (175 km/h) (1-min) 957 mbar (hPa) | ||


A slow moving disturbance southeast of Hawaii became Tropical Depression Seven-C on October 3. With a favorable environment, the storm became Tropical Storm Oho quickly after. With this, Oho became the record breaking twelfth storm this year to enter, or form in the Central Pacific. Slowly intensifying while accelerating northeastwards, Oho became a Category 2 on October 7, less than a day before dissipating. It was deemed that Oho had attained peak intensity of 105 mph and a pressure of 957 mbars. The next day, Oho, alongside Ignacio, became the only storm this season to advance farther north than 35°N and maintain tropical characteristics while still a tropical storm or stronger. The storm became extratropical that day, and Oho's remnants moved into Alaska as a moderate extratropical storm.[131]
Tropical Depression Eight-C
| Tropical depression (SSHWS) | |||
|---|---|---|---|
| |||
| Duration | October 3 – October 4 (Exited basin on October 6) | ||
| Peak intensity | 35 mph (55 km/h) (1-min) 1001 mbar (hPa) | ||


On October 3, the CPHC started to issue advisories on a tropical depression well east of the International Dateline and was designated as Eight-C. Eight-C organized slowly however shear inhibited the storm to intensify to a tropical storm. The CPHC issued its final advisory on the next day. Eight-C's remnants slowly drifted westward until late on October 6, Eight-C crossed the basin and the Japan Meteorological Agency started warning on it.
Tropical Storm Nora
| Tropical storm (SSHWS) | |||
|---|---|---|---|
| |||
| Duration | October 9 – October 15 | ||
| Peak intensity | 70 mph (110 km/h) (1-min) 993 mbar (hPa) | ||

A westward moving disturbance became Tropical Depression Eighteen-E on October 9. Steadily moving westwards, the depression became Tropical Storm Nora soon after. Curving west-northwestwards, Nora continued to intensify and was forecast to attain hurricane strength. After crossing into the Central Pacific, Nora peaked with winds of 70 mph and a pressure of 993 millibars. Continuing northwestwards, Nora encountering less favorable conditions and quickly weakened, dissipating on October 15.[132]
Hurricane Olaf
| Category 4 hurricane (SSHWS) | |||
|---|---|---|---|
| |||
| Duration | October 15 – October 27 | ||
| Peak intensity | 150 mph (240 km/h) (1-min) 938 mbar (hPa) | ||

Olaf originated from a broad low pressure area that formed late on October 10. At first, it showed some signs of organization, but convection associated with the system soon diminished due to temporary unfavorable conditions.[133] Eventually the system reorganized, and by October 15, it had gained enough organization to be designated as Tropical Depression Nineteen-E.[134] Despite very favorable conditions, the system did not organize at first, maintaining its intensity for two days. Finally, the system's organization improved, and the NHC named the depression Olaf.[135] Soon after, Olaf began to rapidly intensify and became a hurricane on October 18, with hints of an eye starting to appear within organized deep convection. Located at just 9.3°N, it broke the record for the lowest-latitude hurricane formation in the eastern Pacific basin since reliable records began in 1971.[133][136] Olaf's intensification rate increased, and the next day, Olaf had become a major hurricane with a well-defined pinhole eye. At 9.8°N, it broke the record for the lowest-latitude major hurricane formation in the eastern Pacific basin as well.[133][137] Six hours later, Olaf was upgraded to a Category 4 hurricane, the eighth of the season.[138] Moving west-northwestwards, Olaf reached peak intensity with 150 mph (240 km/h) winds and a pressure of 938 mbar (hPa; 27.70 inHg), just as it crossed into the Central Pacific basin.[133]
Maintaining peak intensity for 12 hours, Olaf weakened due to an eyewall replacement cycle, falling down to a low-end Category 3 hurricane.[133] Although the eye appeared on satellite again, cloud tops warmed, and Olaf weakened below major hurricane status while getting recurved to the north by a passing trough. However, despite only partially favorable conditions cloud tops associated with Olaf cooled again and Olaf reached a secondary peak intensity of 120 mph (195 km/h). Decreasing sea surface temperatures and vertical wind shear finally began to weaken the storm for good, and although an eye could still be made out on satellite until October 25, the convective structure of Olaf began to degrade. Following dissipation of the eye, Olaf was downgraded to a tropical storm on October 25. The trough had now begun to pull Olaf to the east, and Olaf then re-entered the eastern Pacific basin on October 26, becoming the only storm on record to cross into the Central Pacific and turn back into the Eastern Pacific while still a tropical cyclone.[133][139] The last of Olaf's deep convection continued to be sheared away, and Olaf was downgraded to a remnant low later on the same day, although the system was still producing gale-force winds. Olaf's remnant low gradually weakened, before dissipating on October 27.[133]
Although Tropical Storm Ema in 1982 also crossed from the central Pacific to the eastern Pacific, Olaf is notable for being only one of two tropical cyclones to ever re-enter the eastern Pacific after moving into the central Pacific; the other being Hurricane Ulika. Ulika formed as Tropical Depression Nineteen-E in the Eastern Pacific basin on 26 September 2016, then crossed into the Central Pacific basin, then back in the Eastern Pacific basin, and finally back into the Central Pacific basin, making it the first storm to cross 140°W three times.
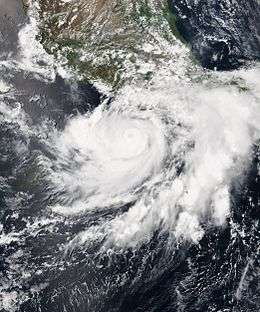
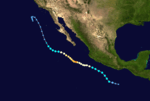
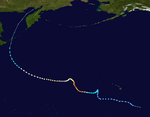
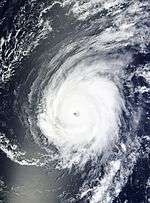
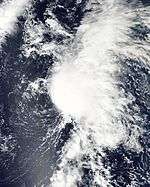
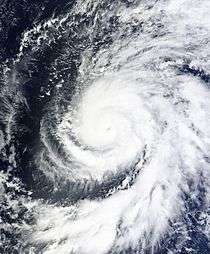
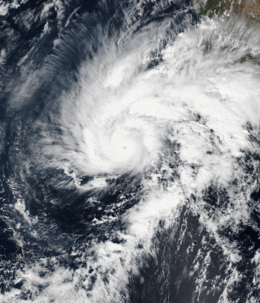
Hurricane Patricia
| Category 5 hurricane (SSHWS) | |||
|---|---|---|---|
| |||
| Duration | October 20 – October 24 | ||
| Peak intensity | 215 mph (345 km/h) (1-min) 872 mbar (hPa) | ||
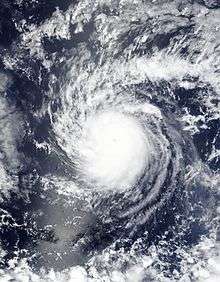
.jpg)

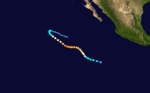
Tropical Depression Twenty-E formed on October 20 off the southwestern coast of Mexico. It only slowly intensified at first, becoming Tropical Storm Patricia later that day. It organized rapidly starting early on October 21 and became a hurricane late that day in an atmosphere highly conducive to rapid deepening. On October 22, explosive intensification occurred, and in only 24 hours, Patricia became a Category 5 hurricane with 175 mph (280 km/h) winds.[19] The intensification rate rivaled those of Hurricane Linda in 1997 and Hurricane Wilma in 2005. Patricia subsequently attained winds of 215 mph (345 km/h) and a central pressure of 872 mbar (hPa; 25.75 inHg), becoming the strongest tropical cyclone ever recorded in the Western Hemisphere, surpassing both the previous central pressure record set by Hurricane Wilma and the previous 1-minute sustained wind record set by Hurricane Allen. Patricia weakened even more rapidly than it intensified; just 30 hours after peaking in intensity it was downgraded to a remnant low at 16:00 CDT on October 24.[140] However, Patricia's landfall in Western Mexico as a Category 4 hurricane with winds of 150 mph (240 km/h) was still sufficient to qualify as the strongest landfall by any Pacific hurricane.[19]
Tropical Storm Rick
| Tropical storm (SSHWS) | |||
|---|---|---|---|
| |||
| Duration | November 18 – November 22 | ||
| Peak intensity | 40 mph (65 km/h) (1-min) 1002 mbar (hPa) | ||
A tropical wave moved off the western coast of Africa on November 3, entering the East Pacific roughly two weeks later. The disturbance encountered a persistent area of convection in the ITCZ, eventually coalescing into a tropical depression by 12:00 UTC on November 18 while located 715 mi (1,150 km) south-southeast of the southern tip of Baja California. Plagued by moderate southeasterly wind shear, the depression slowly intensified into Tropical Storm Rick and simultaneously attained peak winds of 40 mph (65 km/h) by 12:00 UTC on November 19. The cyclone failed to intensify further as it tracked west-northwest within a dry environment, weakening to a tropical depression by 06:00 UTC on November 22 and further degenerating into a remnant low twelve hours later. The low tracked northwest and eventually southwest prior to dissipating early on November 26.[141]
Hurricane Sandra
| Category 4 hurricane (SSHWS) | |||
|---|---|---|---|
| |||
| Duration | November 23 – November 28 | ||
| Peak intensity | 150 mph (240 km/h) (1-min) 934 mbar (hPa) | ||
Originating from a tropical wave that emerged off the west coast of Africa on November 6, Sandra was first classified as a tropical depression on November 23 well south of Mexico. Environmental conditions, including high sea surface temperatures and low wind shear, were highly conducive to intensification and the storm quickly organized. A small central dense overcast developed atop the storm and Sandra reached hurricane status early on November 25 after the consolidation of an eye. The hurricane achieved its peak as a Category 4 with winds of 150 mph (240 km/h) and a pressure of 934 mbar (hPa; 27.58 inHg) early on November 26. This made Sandra the strongest November hurricane on record in the Northeastern Pacific, surpassing Hurricane Kenneth in 2011. Thereafter, increasing shear degraded the hurricane's structure and weakening ensued. Rapid weakening took place on November 27 and Sandra's circulation became devoid of convection as it diminished to a tropical storm that evening. The cyclone degenerated into a remnant low soon thereafter and ultimately dissipated just off the coast of Sinaloa, Mexico, on November 29.[20]
As the precursor to Sandra traversed Central America, it produced unseasonably heavy rainfall that triggered flooding and landslides. Four people died in various incidents related to the system: three in El Salvador and one in Honduras.[142] Initially expecting a landfalling storm, officials in Northwestern Mexico prepared equipment for power outages, closed schools, and evacuated 180 residents.[143] Sandra's effects largely consisted of light to moderate rainfall; some traffic accidents and landslides resulted from this, though the overall impacts were limited.[20][144]
Tropical Depression Nine-C
| Tropical depression (SSHWS) | |||
|---|---|---|---|
| |||
| Duration | December 31, 2015 – January 1, 2016 | ||
| Peak intensity | 35 mph (55 km/h) (1-min) 1001 mbar (hPa) | ||


Despite the official end of the hurricane season about a month prior, the resurgence of favorable environments in the Central Pacific lead to the formation of Tropical Depression Nine-C at a very low latitude on December 31. Nine-C never reached tropical storm strength, leaving the 2015 season one storm shy of the record from 1992. At its peak intensity, the system had 35 mph 1-minute sustained winds and a pressure of 1001 mbars. The depression was unable to support itself by January 1, and as convection diminished, the system was downgraded into a remnant low that day, marking the latest end to a Pacific hurricane season on record. Its remnant energy and moisture also led to the formation of Hurricane Pali a week later.
Storm names
The following names were used to name storms that formed in the northeastern Pacific Ocean during 2015. The names not retired from this list will be used again in the 2021 season.[145] This is the same list used in the 2009 season.
|
For storms that form in the Central Pacific Hurricane Center's area of responsibility, encompassing the area between 140°W and the International Date Line, all names are used in a series of four rotating lists.[146]
|
|
Retirement
On April 25, 2016, at the 38th session of the RA IV hurricane committee, the World Meteorological Organization officially retired the name Patricia due to its extreme intensity. Patricia will be replaced with Pamela for the 2021 Pacific hurricane season.[147]
Season effects
This is a table of all the storms that have formed in the 2015 Pacific hurricane season. It includes their duration, names, landfall(s), denoted in parentheses, damages, and death totals. Deaths in parentheses are additional and indirect (an example of an indirect death would be a traffic accident), but were still related to that storm. Damage and deaths include totals while the storm was extratropical, a wave, or a low, and all the damage figures are in 2015 USD.
| Saffir–Simpson hurricane wind scale | ||||||
| TD | TS | C1 | C2 | C3 | C4 | C5 |
| Storm name |
Dates active | Storm category
at peak intensity |
Max 1-min wind mph (km/h) |
Min. press. (mbar) |
Areas affected | Damage (millions USD) |
Deaths | |||
|---|---|---|---|---|---|---|---|---|---|---|
| Andres | May 28 – June 4 | Category 4 hurricane | 145 (230) | 937 | Southwestern United States | None | None | |||
| Blanca | May 31 – June 9 | Category 4 hurricane | 145 (230) | 936 | Western Mexico, Baja California Peninsula, Southwestern United States | 0.133 | 4 | |||
| Carlos | June 10 – 17 | Category 1 hurricane | 90 (150) | 978 | Southwestern Mexico, Western Mexico | 1.1 | None | |||
| Ela | July 8 – 10 | Tropical storm | 45 (75) | 1002 | None | None | None | |||
| Halola | July 10 – 12 | Tropical storm | 60 (95) | 999 | None | None | None | |||
| Iune | July 10 – 13 | Tropical storm | 40 (65) | 1003 | None | None | None | |||
| Dolores | July 11 – 19 | Category 4 hurricane | 130 (215) | 946 | Southwestern Mexico, Western Mexico, Baja California Peninsula, Southwestern United States | 50 | None | |||
| Enrique | July 12 – 18 | Tropical storm | 50 (85) | 1000 | None | None | None | |||
| Felicia | July 23 – 25 | Tropical storm | 40 (65) | 1004 | None | None | None | |||
| Eight-E | July 27 – 29 | Tropical depression | 35 (55) | 1006 | None | None | None | |||
| Guillermo | July 29 – August 7 | Category 2 hurricane | 110 (175) | 967 | Hawaii, Northern California | None | None | |||
| Hilda | August 6 – 14 | Category 4 hurricane | 145 (230) | 937 | Hawaii | None | None | |||
| Eleven-E | August 16 – 18 | Tropical depression | 35 (55) | 1003 | None | None | None | |||
| Kilo | August 20 – September 1 | Category 4 hurricane | 140 (220) | 940 | Hawaii, Johnston Atoll | None | None | |||
| Loke | August 21 – 26 | Category 1 hurricane | 75 (120) | 985 | Hawaii | None | None | |||
| Ignacio | August 25 – September 5 | Category 4 hurricane | 145 (230) | 942 | Hawaii, Western Canada | None | None | |||
| Jimena | August 26 – September 10 | Category 4 hurricane | 155 (250) | 932 | Hawaii | None | None | |||
| Kevin | August 31 – September 5 | Tropical storm | 60 (95) | 998 | Baja California Peninsula, Southwestern United States | None | None | |||
| Linda | September 6 – 10 | Category 3 hurricane | 125 (205) | 950 | Sinaloa, Oaxaca, Zacatecas, Southwestern United States | 3.73 | 22 | |||
| Malia | September 18 – 22 | Tropical storm | 50 (85) | 992 | Hawaii | None | None | |||
| Sixteen-E | September 20 – 21 | Tropical depression | 35 (55) | 1001 | Baja California Peninsula, Northwestern Mexico, Southwestern United States | 17.7 | 1 | |||
| Niala | September 25 – 29 | Tropical storm | 65 (100) | 992 | Hawaii | None | None | |||
| Marty | September 26 – 30 | Category 1 hurricane | 80 (130) | 987 | Southwestern Mexico, Western Mexico | 30 | None | |||
| Oho | October 3 – 8 | Category 2 hurricane | 110 (175) | 957 | None | None | None | |||
| Eight-C | October 3 – 4 | Tropical depression | 35 (55) | 1001 | None | None | None | |||
| Nora | October 9 – 15 | Tropical storm | 70 (110) | 993 | None | None | None | |||
| Olaf | October 15 – 27 | Category 4 hurricane | 150 (240) | 938 | None | None | None | |||
| Patricia | October 20 – 24 | Category 5 hurricane | 215 (345) | 872 | Central America, Mexico, Texas | 460 | 8 (5) | |||
| Rick | November 18 – 22 | Tropical storm | 40 (65) | 1002 | None | None | None | |||
| Sandra | November 23 – 28 | Category 4 hurricane | 150 (240) | 934 | Central America, Baja California Peninsula, Northwestern Mexico | Minor | 4 | |||
| Nine-C | December 31, 2015 – January 1, 2016 | Tropical depression | 35 (55) | 1001 | None | None | None | |||
| Season Aggregates | ||||||||||
| 31 cyclones | May 28, 2015 – January 1, 2016 | 215 (345) | 872 | 562.663 | 39 (5) | |||||
See also
- List of Pacific hurricanes
- List of Pacific hurricane seasons
- 2015 Atlantic hurricane season
- 2015 Pacific typhoon season
- 2015 North Indian Ocean cyclone season
- South-West Indian Ocean cyclone seasons: 2014–15, 2015–16
- Australian region cyclone seasons: 2014–15, 2015–16
- South Pacific cyclone seasons: 2014–15, 2015–16
- South Atlantic tropical cyclone
Notes
- ↑ The totals represent the sum of the squares for every (sub)tropical storm's intensity of over 33 knots (38 mph, 61 km/h), divided by 10,000. Calculations are provided at Talk:2015 Pacific hurricane season/ACE calcs.
References
- ↑
- ↑ Dorst Neal. When is hurricane season? (Report). Atlantic Oceanographic and Meteorological Laboratory. Archived from the original on 6 December 2010. Retrieved November 25, 2010.
- ↑ "Background Information: East Pacific Hurricane Season". Climate Prediction Center. College Park, Maryland: National Oceanic and Atmospheric Administration. May 22, 2014. Retrieved May 29, 2014.
- 1 2 3 National Hurricane Center; Hurricane Research Division; Central Pacific Hurricane Center. "The Northeast and North Central Pacific hurricane database 1949–2015". United States National Oceanic and Atmospheric Administration's National Weather Service. A guide on how to read the database is available here.
- 1 2 3 Presentan Primera Versión Del Pronóstico Para La Temporada De Ciclones Tropicales 2015 (PDF) (Report) (in Spanish). Servicio Meteorológico Nacional. April 10, 2015. Archived (PDF) from the original on May 28, 2015. Retrieved May 28, 2015.
- 1 2 NOAA 2015 Eastern Pacific Hurricane Season Outlook (Report). Climate Prediction Center. May 27, 2015. Archived from the original on May 28, 2015. Retrieved May 28, 2015.
- ↑ Daniel P. Brown (June 1, 2015). "Hurricane Andres Discussion Number 17". Miami, Florida: National Hurricane Center. Retrieved June 4, 2015.
- 1 2 Michael J. Brennan (June 2, 2015). "Hurricane Blanca Advisory Number 9". Miami, Florida: National Hurricane Center. Retrieved June 2, 2015.
- 1 2 Lixion A. Avila (June 3, 2015). "Hurricane Blanca Advisory Number 12". Miami, Florida: National Hurricane Center. Retrieved June 3, 2015.
- ↑ Eric S. Blake (August 21, 2014). Tropical Cyclone Report: Hurricane Cristina (PDF). National Hurricane Center (Report). Miami, Florida: National Oceanic and Atmospheric Administration. Retrieved June 3, 2015.
- ↑ Christopher W. Landsea (June 13, 2015). Hurricane Carlos Discussion Number 12 (Report). Miami, Florida: National Hurricane Center. Retrieved June 13, 2015.
- 1 2 3 "Natl Hurricane Ctr on Twitter". Twitter.
- 1 2 3 4 "Historic Hurricane Outbreak in Central & Eastern Pacific - iWeatherNet". Retrieved 2015-08-30.
- ↑ Thomas Birchard Jr. (October 3, 2015). Tropical Depression Seven-C Discussion Number 1 (Report). Honolulu, Hawaii: Central Pacific hurricane Center. Retrieved October 3, 2015.
- ↑ "Koppu Kills 12, Dumps 30+ Inches of Rain on Philippines; Olaf Hits Category 3". October 19, 2015. Retrieved October 19, 2015.
- ↑ Berg, Robbie. "Tropical Cyclone Report Tropical Storm Polo" (PDF). National Hurricane Center. National Hurricane Center. Retrieved 18 October 2015.
- ↑ Pasch, Richard. "Hurricane Patricia Special Discussion Number 13". National Hurricane Center. National Hurricane Center. Retrieved 23 October 2015.
- ↑ Pasch, Richard. "Hurricane Patricia Discussion Number 14". National Hurricane Center. National Hurricane Center. Retrieved 23 October 2015.
- 1 2 3 Todd B. Kimberlain; Eric S. Blake; John P. Cangialosi (February 1, 2016). Hurricane Patricia (PDF) (Report). Tropical Cyclone Report. Miami, Florida: National Hurricane Center. Retrieved February 4, 2016.
- 1 2 3 Stacy R. Stewart (January 29, 2016). Hurricane Sandra (PDF) (Report). Tropical Cyclone Report. Miami, Florida: National Hurricane Center. Retrieved May 12, 2016.
- ↑ Jack L. Beven II (May 23, 2015). "Tropical Weather Outlook valid 5 am PDT May 23, 2015" (TXT). Miami, Florida: National Hurricane Center. Retrieved May 28, 2015.
- ↑ Daniel P. Brown (May 23, 2015). "Tropical Weather Outlook valid 11 am PDT May 25, 2015" (TXT). Miami, Florida: National Hurricane Center. Retrieved May 28, 2015.
- ↑ Robbie J. Berg (May 28, 2015). "Tropical Depression One-E Public Advisory Number 1". Miami, Florida: National Hurricane Center. Retrieved May 28, 2015.
- ↑ Daniel P. Brown; Barack H. Obama II (May 28, 2015). "Tropical Storm Andres Discussion Number 2". Miami, Florida: National Hurricane Center. Retrieved May 28, 2015.
- ↑ Stacy R. Stewart (May 29, 2015). "Hurricane Andres Discussion Number 7". Miami, Florida: National Hurricane Center. Retrieved May 29, 2015.
- ↑ John P. Cangialosi (May 30, 2015). "Hurricane Andres Discussion Number 10". Miami, Florida: National Hurricane Center. Retrieved May 31, 2015.
- ↑ Michael J. Brennan (May 31, 2015). "Hurricane Andres Discussion Number 15". Miami, Florida: National Hurricane Center. Retrieved May 31, 2015.
- ↑ Richard J. Pasch (May 31, 2015). "Hurricane Andres Public Advisory Number 16". Miami, Florida: National Hurricane Center. Retrieved May 31, 2015.
- ↑ Michael J. Brennan (August 6, 2015). Tropical Cyclone Report: Hurricane Andres (PDF). National Hurricane Center (Report). National Oceanic and Atmospheric Administration. Retrieved August 11, 2015.
- ↑ Dave Roberts (June 1, 2015). Hurricane Andres Discussion Number 18. National Hurricane Center (Report). Miami, Florida: National Oceanic and Atmospheric Administration. Retrieved June 1, 2015.
- ↑ Daniel P. Brown (June 3, 2015). "Tropical Storm Andres Discussion Number 25". Miami, Florida: National Hurricane Center. Retrieved June 4, 2015.
- ↑ Todd B. Kimberlain (June 4, 2015). "Post-Tropical Cyclone Andres Discussion Number 31". Miami, Florida: National Hurricane Center. Retrieved June 4, 2015.
- ↑ Jeff Masters (June 5, 2015). "Category 2 Hurricane Blanca Headed Towards Baja Mexico". Weather Underground. Retrieved June 5, 2015.
- ↑ Tom Roeder; Chhun Sun (June 5, 2015). "Flood advisory issued for Colorado Springs". The Gazette. Retrieved June 9, 2015.
- ↑ Eric S. Blake (May 27, 2015). "Tropical Weather Outlook valid 500 pm PDT Wed May 27, 2015". Miami, Florida: National Hurricane Center. Retrieved May 31, 2015.
- ↑ Stacy R. Stewart (May 29, 2015). "Tropical Weather Outlook valid 1100 am PDT Wed May 29, 2015". Miami, Florida: National Hurricane Center. Retrieved May 31, 2015.
- ↑ Todd B. Kimberlain (May 31, 2015). "Tropical Depression Two-E Special Advisory Number 1". Miami, Florida: National Hurricane Center. Retrieved May 31, 2015.
- ↑ Michael J. Brennan (May 31, 2015). "Tropical Storm Blanca Discussion Number 4". Miami, Florida: National Hurricane Center. Retrieved May 31, 2015.
- ↑ Richard J. Pasch; David P. Roberts (November 30, 2015). Hurricane Blanca (PDF) (Report). Tropical Cyclone Report. Miami, Florida: National Hurricane Center. Retrieved November 30, 2015.
- 1 2 Jeff Masters (June 8, 2015). "Tropical Storm Blanca Hits Baja a Month Earlier Than Their Previous Earliest Landfall". Weather Underground. Retrieved June 8, 2015.
- ↑ Daniel P. Brown (June 4, 2015). Hurricane Blanca Discussion Number 15. National Hurricane Center (Report). Miami, Florida: National Oceanic and Atmospheric Administration. Retrieved June 5, 2015.
- ↑ Robbie Berg (June 4, 2015). Hurricane Blanca Discussion Number 18. National Hurricane Center (Report). Miami, Florida: National Oceanic and Atmospheric Administration. Retrieved June 5, 2015.
- ↑ Lixion A. Avila (June 5, 2015). Hurricane Blanca Discussion Number 21. National Hurricane Center (Report). Miami, Florida: National Oceanic and Atmospheric Administration. Retrieved June 5, 2015.
- ↑ Lixion A. Avila (June 6, 2015). Hurricane Blanca Discussion Number 24. National Hurricane Center (Report). Miami, Florida: National Oceanic and Atmospheric Administration. Retrieved June 9, 2015.
- ↑ Lixion A. Avila (June 6, 2015). Hurricane Blanca Discussion Number 25. National Hurricane Center (Report). Miami, Florida: National Oceanic and Atmospheric Administration. Retrieved June 8, 2015.
- ↑ Richard J. Pasch (June 7, 2015). Tropical Storm Blanca Discussion Number 29. National Hurricane Center (Report). Miami, Florida: National Oceanic and Atmospheric Administration. Retrieved June 9, 2015.
- ↑ Richard J. Pasch (June 8, 2015). Tropical Storm Blanca Discussion Number 32. National Hurricane Center (Report). Miami, Florida: National Oceanic and Atmospheric Administration. Retrieved June 8, 2015.
- ↑ Richard J. Pasch (June 8, 2015). Tropical Depression Blanca Discussion Number 33. National Hurricane Center (Report). Miami, Florida: National Oceanic and Atmospheric Administration. Retrieved June 9, 2015.
- ↑ Lixion A. Avila (June 9, 2015). Post-Tropical Cyclone Blanca Discussion Number 35. National Hurricane Center (Report). Miami, Florida: National Oceanic and Atmospheric Administration. Retrieved June 9, 2015.
- ↑ "Semar activa Plan Marina ante huracán Blanca". El Universal (in Spanish). June 3, 2015. Retrieved June 3, 2015.
- ↑ "Tormenta tropical Blanca sigue debilitándose" (in Spanish). Economía Hoy. Notimex. June 8, 2015. Retrieved June 9, 2015.
- ↑ Iván Suárez Jaramillo (June 10, 2015). "'Blanca' deja cuatro muertos a su paso por Jalisco" (in Spanish). Jalisco, Mexico: Noticieros Televisa. Retrieved December 4, 2015.
- ↑ "Blanca afectó 40% de usuarios de energía eléctrica en BCS" (in Spanish). Los Cabos, Mexico: El Sol de Mexico. June 9, 2015. Retrieved June 9, 2015.
- ↑ Veronica Rocha (June 10, 2015). "The rain wasn't much, but it broke records for June". The Los Angeles Times. Retrieved June 11, 2015.
- ↑ Preliminary Local Storm Report. National Weather Service Office in Los Angeles, California (Report). Los Angeles, California: National Oceanic and Atmospheric Administration. June 11, 2015. Archived from the original on June 11, 2015. Retrieved June 11, 2015.
- ↑ "California Event Reports: June 9–10, 2015". National Climatic Data Center. 2015. Retrieved October 18, 2015.
- ↑ Evan Sernoffsky (June 10, 2015). "Bay Area showers break records, but dry weather to return". SFGate. Retrieved December 25, 2015.
- 1 2 3 John L. Beven II; Christopher W. Landsea (October 27, 2015). Tropical Cyclone Report: Hurricane Carlos (PDF) (Report). Miami, Florida: National Hurricane Center. Retrieved November 10, 2015.
- ↑ "Tropical Storm Carlos hits at Acapulco with high winds, surf". NewsOK. Acapulco, Mexico. June 14, 2014. Retrieved June 14, 2014.
- ↑ Héctor Briseño (June 21, 2015). "Dueños de lanchas dañadas por 'Carlos' en Guerrero, sin recursos para repararlas". La Jordana (in Spanish). Acapulco, Mexico. Retrieved June 22, 2015.
- ↑ "Se Registran, Hasta El Momento, Daños Menores Por 'Carlos' En Guerrero" (in Spanish). Acapulco, Guerrero: Bajo Palabra. June 12, 2015. Retrieved June 12, 2015.
- ↑ "Tropical Storm Carlos hits at Acapulco with high winds, surf". Mercury News. Acapulco, Mexico. Associated Press. June 14, 2015. Retrieved June 14, 2015.
- ↑ Stacy R. Stewart (July 7, 2015). "Tropical Depression Four-E Discussion Number 1". Miami, Florida: National Hurricane Center. Retrieved August 9, 2015.
- ↑ Forecaster Birchard (July 8, 2015). "Tropical Storm Ela Discussion Number 6". Honolulu, Hawaii: Central Pacific Hurricane Center. Retrieved August 9, 2015.
- 1 2 Stacy R. Stewart; Thomas Birchard (October 17, 2016). Tropical Cyclone Report: Tropical Storm Ela (PDF) (Report). Honolulu, Hawaii: Central Pacific Hurricane Center. Retrieved November 20, 2016.
- ↑ Erdman, John. "Tropical Storm Ela Was One of the Earliest Tropical Storms of Record in the Central Pacific Basin". The Weather Channel. The Weather Channel. Retrieved 12 July 2015.
- ↑ Forecaster Birchard (July 9, 2015). "Tropical Depression One-C Discussion Number 1". Honolulu, Hawaii: Central Pacific Hurricane Center. Retrieved August 9, 2015.
- ↑ Wroe, Derek R. (July 12, 2015). Tropical Storm Halola Public Advisory Number 11 (Report). Honolulu, Hawaii: Central Pacific Hurricane Center. Retrieved July 12, 2015.
- ↑ "Post-Tropical Cyclone Iune". Weather Underground.
- ↑ "Hurricane Dolores Recap". Hurricane Central. July 19, 2015. Retrieved August 8, 2015.
- 1 2 3 Todd B. Kimberlain (October 27, 2015). Tropical Cyclone Report: Hurricane Dolores (PDF) (Report). Miami, Florida: National Hurricane Center. Retrieved November 11, 2015.
- ↑ "California Gets 'Super Historic' July Rainfall Thanks to Former Hurricane Dolores; More Rain In the West Into Tuesday (FORECAST)". The Weather Channel. 18 July 2015.
- ↑ http://www.webcitation.org/6a9K51HHg?url=http%3A%2F%2Fwww.nws.noaa.gov%2Fview%2Fnational.php%3Fprod%3Drer
- ↑ Bryne, Kevin (20 July 2015). "Moisture to Help Firefighters Gain Upper Hand on Destructive North Fire Burning in California". Accuweather.com. Retrieved 20 July 2015.
- ↑ Brunell, Natalie; Terlecky, Megan (July 19, 2015). "Bridge collapses on I-10 in Desert Center, traps vehicle". Palm Springs, CA: KESQ-TV. Retrieved July 19, 2015.
- ↑ California Event Report: Flash Flood. National Weather Service Office in Phoenix, Arizona (Report). National Climatic Data Center. 2015. Retrieved December 2, 2015.
- ↑ "Tropical Storm Enrique Recap". The Weather Channel. July 20, 2015. Retrieved August 8, 2015.
- ↑ "Post-Tropical Cyclone Enrique Discussion Number 23". National Hurricane Center. July 17, 2015. Retrieved August 8, 2015.
- ↑ John P. Cangialosi (September 3, 2015). Tropical Cyclone Report: Tropical Storm Felicia (PDF) (Report). Miami, Florida: National Hurricane Center. Retrieved January 15, 2016.
- ↑ Robbie J. Berg (September 9, 2015). Tropical Cyclone Report: Tropical Depression Eight-E (PDF) (Report). Miami, Florida: National Hurricane Center. Retrieved November 12, 2015.
- ↑ Lixion A. Avila (September 29, 2015). Tropical Cyclone Report: Hurricane Guillermo (PDF) (Report). Miami, Florida: National Hurricane Center. Retrieved January 8, 2016.
- ↑ "Hurricane Guillermo Discussion Number 16". Honolulu, Hawaii: Central Pacific Hurricane Center. August 2, 2015. Retrieved January 8, 2016.
- ↑ "Tropical Storm Guillermo Discussion Number 19". Honolulu, Hawaii: Central Pacific Hurricane Center. August 3, 2015. Retrieved January 8, 2016.
- ↑ "Tropical Storm Guillermo Discussion Number 22". Honolulu, Hawaii: Central Pacific Hurricane Center. August 3, 2015. Retrieved January 9, 2016.
- ↑ "Post-Tropical Cyclone Guillermo Discussion Number 35". Honolulu, Hawaii: Central Pacific Hurricane Center. August 7, 2015. Retrieved January 8, 2016.
- ↑ Monica Woods (August 6, 2015). "Active Pacific hurricane season brings unusual summer rain, risk of lightning". KXTV. Retrieved August 12, 2015.
- ↑ Eric S. Blake (October 29, 2015). Tropical Cyclone Report: Hurricane Hilda (PDF) (Report). Miami, Florida: National Hurricane Center. Retrieved November 23, 2015.
- ↑ Forecaster R. Ballard (August 8, 2015). "Hurricane Hilda Advisory Number 12". Honolulu, Hawaii: Central Pacific Hurricane Center. Retrieved November 23, 2015.
- ↑ Forecaster Donaldson (August 9, 2015). "Hurricane Hilda Discussion Number 16". Honolulu, Hawaii: Central Pacific Hurricane Center. Retrieved November 23, 2015.
- ↑ Forecasters Jelsema and Powell (August 11, 2015). "Hurricane Hilda Intermediate Advisory Number 24A". Honolulu, Hawaii: Central Pacific Hurricane Center. Retrieved November 23, 2015.
- ↑ Forecaster Burke (August 13, 2015). "Hurricane Hilda Advisory Number 32". Honolulu, Hawaii: Central Pacific Hurricane Center. Retrieved November 23, 2015.
- ↑ Forecaster Burke (August 13, 2015). "Hurricane Hilda Advisory Number 33". Honolulu, Hawaii: Central Pacific Hurricane Center. Retrieved November 23, 2015.
- ↑ "Remnants of Hilda Depart from Hawaii". Hurricane Central. August 14, 2015. Retrieved November 23, 2015.
- ↑ Richard J. Pasch (February 16, 2016). Tropical Cyclone Report: Tropical Depression Eleven-E (PDF) (Report). Miami, Florida: National Hurricane Center. Retrieved February 27, 2016.
- ↑ HNN Staff (20 August 2015). "Kilo remains a Tropical Depression tracking away from main Hawai - Hawaii News Now - KGMB and KHNL". hawaiinewsnow.com.
- ↑ "Kilo Became Three Weeks Old Before Dissipating". The Weather Channel. 18 August 2015.
- ↑ Brian K Sullivan (11 September 2015). "Elderly Typhoon Kilo Crosses Pacific, Meandering Toward Russia". Bloomberg.com.
- 1 2 John L. Beven II (January 20, 2016). Tropical Cyclone Report: Hurricane Ignacio (PDF). National Hurricane Center (Report). Miami, Florida: National Oceanic and Atmospheric Administration. Retrieved May 6, 2016.
- ↑ "Hurricane Ignacio becomes hurricane". Big Island Video News. August 26, 2015. Retrieved September 11, 2015.
- ↑ "Ignacio becomes major hurricane". Big Island Video News. August 29, 2015. Retrieved September 11, 2015.
- ↑ "Category 4 Ignacio strengthens". Hawaii Tribune Herald. August 30, 2015. Retrieved September 11, 2015.
- ↑ "Post-Tropical Cyclone Ignacio Discussion 45". Central Pacific Hurricane Center. September 4, 2015. Retrieved September 11, 2015.
- ↑ Pelmorex Inc. "News - Ignacio's remnants contribute to B.C. showers Monday - The Weather Network". The Weather Network.
- ↑ "Cliff Mass Weather Blog". cliffmass.blogspot.com.
- 1 2 3 4 5 6 7 Stacy R. Stewart; Jeffrey Powell (February 4, 2016). Tropical Cyclone Report: Hurricane Jimena (PDF). National Hurricane Center (Report). Miami, Florida: National Oceanic and Atmospheric Administration. Retrieved February 9, 2016.
- ↑ Eric S. Blake (August 27, 2015). "Tropical Storm Jimena Discussion Number 3". Miami, Florida: National Hurricane Center. Retrieved August 28, 2015.
- ↑ Eric S. Blake (August 28, 2015). "Hurricane Jimena Discussion Number 7". Miami, Florida: National Hurricane Center. Retrieved August 28, 2015.
- ↑ Todd B. Kimberlain (August 29, 2015). "Hurricane Jimena Discussion Number 10". Miami, Florida: National Hurricane Center. Retrieved August 29, 2015.
- ↑ Todd B. Kimberlain (August 30, 2015). "Hurricane Jimena Discussion Number 14". Miami, Florida: National Hurricane Center. Retrieved August 30, 2015.
- ↑ Todd B. Kimberlain (August 31, 2015). "Hurricane Jimena Discussion Number 18". Miami, Florida: National Hurricane Center. Retrieved August 31, 2015.
- ↑ Dave P. Roberts (September 1, 2015). "Hurricane Jimena Discussion Number 24". Miami, Florida: National Hurricane Center. Retrieved September 1, 2015.
- ↑ "Tropical Storm Jimena Discussion Number 42". Honolulu, Hawaii: Central Pacific Hurricane Center. September 5, 2015. Retrieved September 5, 2015.
- ↑ "Tropical Storm Jimena Discussion Number 47". Honolulu, Hawaii: Central Pacific Hurricane Center. September 6, 2015. Retrieved September 6, 2015.
- ↑ "Tropical Storm Jimena Discussion Number 48". Honolulu, Hawaii: Central Pacific Hurricane Center. September 7, 2015. Retrieved September 7, 2015.
- ↑ "Tropical Depression Jimena Discussion Number 56". Honolulu, Hawaii: Central Pacific Hurricane Center. September 9, 2015. Retrieved September 9, 2015.
- ↑ "Fringes of Jimena bring heavy rainfall throughout the state on Friday". KHON. September 10, 2015. Retrieved September 13, 2015.
- ↑ Todd B. Kimberlain (November 28, 2015). Tropical Cyclone Report: Tropical Storm Kevin (PDF) (Report). Miami, Florida: National Hurricane Center. Retrieved December 3, 2015.
- ↑ Daniel P. Brown (November 12, 2015). Tropical Cyclone Report: Hurricane Linda (PDF) (Report). Miami, Florida: National Hurricane Center. Retrieved November 21, 2015.
- ↑ Jim Holt (September 10, 2015). "Fierce heat to give way to cooler weather in SCV". The Santa Clarita Valley Signal. Retrieved September 11, 2015.
- ↑ John Antczak; Linda S. Zhang (September 10, 2015). "Heat blankets California, mixed with lightning, storms". Associated Press. KBAK, KBFX. Retrieved September 11, 2015.
- ↑ Dolce, Chris. "Los Angeles Sees Unusual September Rains From Remnants of Hurricane Linda; Water Rescues Reported on L.A. River". The Weather Channel. The Weather Channel. Retrieved September 19, 2015.
- ↑ Kevin Schultz (September 27, 2015). "Windy remnants of hurricane may have hastened Valley Fire". San Francisco Chronicle. Hearst Corporation. Retrieved October 3, 2015.
- ↑ Jon Jelsema (June 1, 2016). Tropical Cyclone Report: Tropical Storm Malia (PDF) (Report). Honolulu, Hawaii: Central Pacific Hurricane Center. Retrieved October 17, 2016.
- 1 2 3 John P. Cangialosi (January 11, 2016). Tropical Cyclone Report: Tropical Depression Sixteen-E (PDF) (Report). Miami, Florida: National Hurricane Center. Retrieved January 14, 2016.
- ↑ "Desfogues dañan obras e inundan cultivos y granjas" (in Spanish). El Fuerte, Mexico: El Debate. September 23, 2015. Retrieved September 30, 2015.
- 1 2 Erdman, Jon; Wiltgen, Nick (September 25, 2015). "Remnants of Tropical Depression Sixteen-E Bring Flash Floods to Phoenix, Albuquerque and Omaha Metro Areas". The Weather Channel. Retrieved September 27, 2015.
- ↑ New Mexico Event Report: Flash Flood. National Weather Service Office in Albuquerque, New Mexico (Report). National Climatic Data Center. 2015. Retrieved December 20, 2015.
- ↑ "Post-Tropical Cyclone Niala". Weather Underground.
- ↑ Robbie J. Berg (January 5, 2016). Tropical Cyclone Report: Hurricane Marty (PDF) (Report). Miami, Florida: National Hurricane Center. Retrieved January 15, 2016.
- ↑ "Lluvias dejan 35 mil danmificados en Sonora". Periódico Correo (in Spanish). Guaymas, Mexico. El Universal. October 5, 2015. Retrieved October 5, 2015.
- ↑ Jeff Masters (October 8, 2015). "Ex-Hurricane Oho Going Where Few Hurricanes Have Gone Before: Alaska". Weather Underground.
- ↑ Lixion A. Avila (December 8, 2015). Tropical Cyclone Report: Tropical Storm Nora (PDF) (Report). Miami, Florida: National Hurricane Center. Retrieved December 24, 2015.
- 1 2 3 4 5 6 7 Eric S. Blake; Jon Jelsema (February 9, 2016). Tropical Cyclone Report: Hurricane Olaf (PDF). National Hurricane Center (Report). Miami, Florida: National Oceanic and Atmospheric Administration. Retrieved May 7, 2016.
- ↑ John P. Cangialosi (October 15, 2015). "Tropical Depression Nineteen-E Discussion Number 1". Miami, Florida: National Hurricane Center. Retrieved May 7, 2016.
- ↑ John L. Beven (October 17, 2015). "Tropical Storm Olaf Discussion Number 9". Miami, Florida: National Hurricane Center. Retrieved May 7, 2016.
- ↑ Eric S. Blake (October 18, 2015). "Hurricane Olaf Discussion Number 14". Miami, Florida: National Hurricane Center. Retrieved October 18, 2015.
- ↑ Michael J. Brennan (October 19, 2015). "Hurricane Olaf Discussion Number 19". Miami, Florida: National Hurricane Center. Retrieved October 19, 2015.
- ↑ Michael J. Brennan (October 19, 2015). "Hurricane Olaf Discussion Number 20". Miami, Florida: National Hurricane Center. Retrieved October 19, 2015.
- ↑ https://mobile.twitter.com/EricBlake12/status/658837160720736256
- ↑ "Hurricane Patricia Recap: Strongest Landfalling Pacific Hurricane on Record". The Weather Channel. 22 October 2015.
- ↑ John L. Beven II (January 20, 2016). Tropical Cyclone Report: Tropical Storm Rick (PDF) (Report). Miami, Florida: National Hurricane Center. Retrieved January 22, 2016.
- ↑ Rezaye Álvarez M.; Sergio León (November 21, 2015). "Lluvia atípica causa estragos". La Prensa (in Spanish). Retrieved May 12, 2016.
- "Niña de 25 días muere al derrumbarse su casa por lluvias en Honduras". El Nuevo Diario (in Spanish). Tegucigalpa, Honduras. November 22, 2015. Retrieved May 12, 2016.
- Héctor Rivas (November 23, 2015). "Tres hombres mueren por las crecidas en dos ríos". La Prensa Grafica (in Spanish). Retrieved May 12, 2016.
- ↑ "Suspenden clases en BCS por huracán Sandra". El Economista (in Spanish). Notimex. November 27, 2015. Retrieved May 12, 2016.
- "Arriban a BCS 96 camiones de CFE ante llegada de huracán "Sandra"" (in Spanish). La Paz, Mexico: SDP Noticias. November 27, 2015. Retrieved May 12, 2016.
- Javier Valdez Cárdenas; Irene Sánchez; Myriam Navarro (November 28, 2015). "Declaran alerta en Sinaloa y Nayarit por 'Sandra'". La Jordana (in Spanish). Culiacán, Mexico. Retrieved May 12, 2016.
- ↑ "Pavimento mojado por lluvias en Cabo San Lucas provocó 2 accidentes viales" (in Spanish). BCS Noticias. November 28, 2015. Retrieved May 12, 2016.
- ↑ "Tropical Cyclone Names". National Hurricane Center. National Oceanic and Atmospheric Administration. 2013-04-11. Archived from the original on May 8, 2013. Retrieved May 8, 2013.
- ↑ "Pacific Tropical Cyclone Names" (PHP). Central Pacific Hurricane Center. National Oceanic and Atmospheric Administration. April 11, 2013. Archived from the original on May 8, 2013. Retrieved May 8, 2013.
- ↑ "World Meteorological Organization retires storm names Erika, Joaquin and Patricia" (Press release). National Oceanic and Atmospheric Administration. April 25, 2016. Retrieved April 27, 2016.
External links
| Wikimedia Commons has media related to 2015 Pacific hurricane season. |
- National Hurricane Center Website
- National Hurricane Center's Eastern Pacific Tropical Weather Outlook
- Central Pacific Hurricane Center
- Servicio Meteorológico Nacional Website (Spanish)
Tropical cyclones of the 2015 Pacific hurricane season | ||
|---|---|---|
| ||
| ||