2013 Pacific hurricane season
 | |
| Season summary map | |
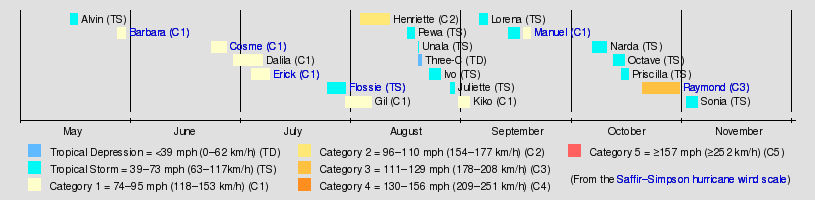
| First system formed | May 15, 2013 |
|---|---|
| Last system dissipated | November 4, 2013 |
| Strongest storm1 | Raymond – 951 mbar (hPa) (28.08 inHg), 125 mph (205 km/h) |
| Total depressions | 21 |
| Total storms | 20 |
| Hurricanes | 9 |
| Major hurricanes (Cat. 3+) | 1 |
| Total fatalities | 135 confirmed |
| Total damage | $4.201 billion (2013 USD) (Costliest season in East Pacific history) |
| 1Strongest storm is determined by lowest pressure | |
2011, 2012, 2013, 2014, 2015 | |
| Related article | |
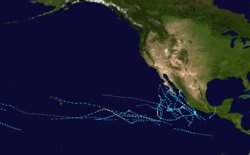
The 2013 Pacific hurricane season was a very active season, although most of the storms remained weak. It officially began on May 15, 2013 in the Eastern Pacific and started on June 1, 2013 in the Central Pacific. Both ended on November 30, 2013. These dates conventionally delimit the period of each year when most tropical cyclones form in the eastern Pacific basin. However, the formation of a storm is possible at any time.[1]
The second storm of the season, Hurricane Barbara, brought widespread heavy rains to much of Southwestern Mexico and Central America. Damage estimates from the storm range from $750,000 to $1 million (2013 USD); four people were killed and four others are reportedly missing. In addition to Barbara, Hurricane Cosme killed three people despite remaining far offshore the Mexican coast. Hurricane Erick also brought slight effects to the region as well, killing two people. Later that month, Tropical Storm Flossie threatened to become the first storm to make a "direct hit" on Hawaii in 20 years, causing minimal damage. Ivo and Juliette both threatened Baja California Sur, and the former triggered flash floods across the Southwestern United States. In mid-September, Hurricane Manuel killed at least 169 people in Mexico, and was responsible for significant damage to the western coast and the area around Acapulco. In late October, Hurricane Raymond became the strongest storm of the season.
Seasonal forecasts
| Source | Date | Named storms |
Hurricanes | Major hurricanes |
Refs |
| Average (1981–2010) | 15.4 | 8.4 | 3.9 | [2] | |
| Record high activity | 27 | 16 (tie) | 11 | [3] | |
| Record low activity | 8 (tie) | 3 | 0† (tie) | [3] | |
| ––––––––––––––––––––––––––––––––––––––––––––––––––––––– | |||||
| CPC | May 23, 2013 | 11-16 | 5-8 | 1-4 | [4] |
| ––––––––––––––––––––––––––––––––––––––––––––––––––––––– | |||||
| Actual activity |
20 | 9 | 1 | ||
On May 21, the Central Pacific Hurricane Center (CPHC) released its forecast for tropical activity across the Central Pacific during 2013. In its report, the organization predicted a 70 percent chance of a below-average season, a 25 percent chance of a near-average season, and a 5 percent chance of an above-average season, equating to 1–3 tropical cyclones across the basin. An average season yields 4–5 tropical cyclones. This forecast was based primarily on the expectation of Neutral El Niño Southern Oscillation conditions and a continuation of the positive Atlantic Multidecadal Oscillation.[5]
Two days later, the Climate Prediction Center (CPC) issued its forecast for tropical activity across the East Pacific during 2013. With near or below average sea surface temperatures in the eastern equatorial Pacific and a continuation of the climate pattern responsible for the ongoing era of low Pacific hurricane activity that began in 1995, the organization called for a 55 percent chance of a below-average season, a 35 percent chance of a near-average season, and a 10 percent chance of an above-average season. In total, the CPC predicted 11–16 named storms, 5–8 hurricanes, and 1–4 major hurricanes; an average season yields 15.4 named storms, 8.4 hurricanes, and 3.9 major hurricanes. Both the CPHC and CPC stressed the importance of being prepared prior to the start of the season, noting that significant tropical cyclones can occur even in below-average seasons.[4]
Seasonal summary
The season's first tropical storm formed on May 15,[6] coinciding with the official start of the Pacific hurricane season.[7] On average, a tropical cyclone develops in May in the eastern Pacific every other year; however, the last Pacific hurricane season to not feature at least one tropical cyclone in May was the 2011 season.[8] The formation of Barbara in late May marked only the fifth time since 1949 that two tropical storms formed during the month, with the other seasons being 1956, 1984, 2007, and 2012.[9][10][11]
The Accumulated Cyclone Energy (ACE) index for the season is 68.81 units for the East Pacific, including 6.2725 units for the Central Pacific.[nb 1]
Storms
Tropical Storm Alvin
| Tropical storm (SSHWS) | |||
|---|---|---|---|
| |||
| Duration | May 15 – May 17 | ||
| Peak intensity | 60 mph (95 km/h) (1-min) 1000 mbar (hPa) | ||

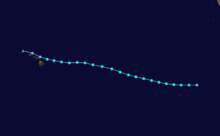
A tropical wave was first observed over the southeastern Caribbean Sea on May 4. The wave entered the East Pacific a few days later, where atmospheric conditions allowed for gradual development. Curved bands of convection developed around a defined center early on May 15, leading to the formation of a tropical depression around 06:00 UTC that day; at 7.8°N, the depression tied 1976's Hurricane Annette as the second-lowest-latitude tropical cyclone to form in the East Pacific. Twelve hours later, the depression intensified into Tropical Storm Alvin. Influenced by a subtropical ridge over central Mexico, Alvin steadily strengthened and reached peak winds of 60 mph (95 km/h) early on May 16. Thereafter, increasing wind shear and the introduction of mid-level dry air caused the cyclone to begin a quick weakening trend. The low-level circulation became increasingly elongated and opened up into a trough at 00:00 UTC on May 17. Six hours later, Alvin dissipated while located about 775 mi (1,245 km) southwest of Manzanillo, Mexico.[12]
Hurricane Barbara
| Category 1 hurricane (SSHWS) | |||
|---|---|---|---|
| |||
| Duration | May 28 – May 30 | ||
| Peak intensity | 80 mph (130 km/h) (1-min) 983 mbar (hPa) | ||
A tropical wave emerged off the western coast of Africa on May 16, entering the East Pacific on May 24. Following the passage of an atmospheric kelvin wave, a broad area of low pressure formed and gradually organized as convection simultaneously increased. At 12:00 UTC on May 28, the wave was declared a tropical depression; six hours later, the depression intensified into Tropical Storm Barbara. Steered northeastward amid favorable atmospheric conditions, a period of rapid deepening ensued, and the system was upgraded to a Category 1 hurricane at 18:00 UTC on May 29. At 19:50 UTC that day, Barbara attained peak winds of 80 mph (130 km/h) as it moved ashore west-southwest of Tonalá, Chiapas. The cyclone quickly weakened thereafter as it passed over the Sierra Madre mountain range. At 00:00 UTC on May 30, Barbara weakened to a tropical storm, and by six hours later, it further weakened to a tropical depression. After losing its deep convection, the depression degenerated into a remnant low at 12:00 UTC, while located over the Bay of Campeche. The remnant low opened into a trough at 00:00 UTC on May 31.[13]
The precursor disturbance to brought rainfall to El Salvador,[14] where one person was killed.[15] In Mexico, rainfall peaked at 470 mm (19 in).[16] Even though Hurricane Barbara struck a largely undeveloped stretch of coastal lagoons, containing small fishing villages,[17] two elderly people were killed in Oaxaca.[18] Furthermore, 14 fishermen were left missing off the coast of Tapanatepec;[19][20] eight of which were found alive.[21] The towns of Tonala and Arriaga were the worst affected by the hurricane.[22] Although damage was minor,[23] 50 people were evacuated and 2,000 homes were damaged.[24] Throughout the region, 57,000 people were homeless and 10,000 hectares of crops were destroyed.[25] Losses to the mango crop were estimated at 10–15 million pesos ($750,000–$1.1 million USD).[26]
Hurricane Cosme
| Category 1 hurricane (SSHWS) | |||
|---|---|---|---|
| |||
| Duration | June 23 – June 27 | ||
| Peak intensity | 85 mph (140 km/h) (1-min) 980 mbar (hPa) | ||


A tropical wave, the same responsible for Tropical Storm Barry in the Atlantic, moved across the eastern Pacific in late June, yielding a broad area of low pressure by June 21. Northwesterly shear initially hindered development of the system, but a subsequent decrease in upper-level winds, as well as the passage of an eastward-moving kelvin wave, led to the formation of a tropical depression by 12:00 UTC on June 23; twelve hours later, the depression intensified into Tropical Storm Cosme. Steered northwest and eventually west-northwest, the cyclone intensified amid favorable atmospheric dynamics, becoming a minimal hurricane by 12:00 UTC on June 25 and attaining peak winds of 85 mph (140 km/h) twelve hours later. A track over cooler waters and into an increasingly stable environment caused Cosme to weaken to a tropical storm by 18:00 UTC on June 26 and further degenerate into a remnant low by 12:00 UTC the next day while located about 690 mi (1,110 km) west-southwest of Cabo San Lucas, Mexico. The remnant low tracked westward prior to dissipating well east-southeast of the Hawaiian Islands on June 31.[27]
Due to the storm's large size,[28] a "green" alert (low risk) was issued for the states of Colima, Jalisco and Michoacan while a "blue" alert (minimum risk) was placed into effect for the states of Nayarit, Guerrero,[29] and Baja California Sur.[30] As the system passed through the Revillagigedo Islands, winds reached 42 mph (68 km/h) on Socorro Island.[31] The outer rainbands brought moderate rains to Guerrero,[32] causing minor flooding in Acapulco. Across the state, the storm generated 24 landslides,[33] which blocked highways.[32] Two people were killed in the Guerrero, one a tourist that drowned in Zihuatanejo[34] and the other a police officer in an airplane crash that injured 19 others.[35] High seas flooded numerous buildings across coastal towns in Colima,[36][37] damaging 34 tourist facilities and killing one person.[38] Additionally, many restaurants built of wood and coconut were damaged. In Manzanillo, the port was closed to small craft,[39] as was the port of Mazatlan.[40] Overall, 50 homes were damaged by the storm.[41]
Hurricane Dalila
| Category 1 hurricane (SSHWS) | |||
|---|---|---|---|
| |||
| Duration | June 29 – July 7 | ||
| Peak intensity | 80 mph (130 km/h) (1-min) 984 mbar (hPa) | ||


A tropical wave was first observed over the central Atlantic on June 17. It entered the East Pacific on June 24 and steadily organized, acquiring enough organization to be declared a tropical depression by 18:00 UTC on June 29. Twelve hours later, it was upgraded to Tropical Storm Dalila. Steered northwest parallel to the coastline of Mexico, the cyclone only slowly organized despite favorable conditions, becoming a Category 1 hurricane by 12:00 UTC on July 2. After attaining peak winds of 80 mph (130 km/h) six hours later, the influence of drier air and increasing shear caused the storm to begin a weakening trend. At 18:00 UTC on July 3, Dalila was downgraded to a tropical storm, and by 00:00 UTC on July 5, the system further weakened to a tropical depression. After becoming devoid of convection, Dalila degenerated into a remnant low at 06:00 UTC on July 7 while located roughly 460 mi (740 km) south-southwest of Cabo San Lucas, Mexico. The low turned east-northeastward into the circulation of Tropical Storm Erick thereafter, dissipating late on July 8.[42]
When Dalila threatened Western Mexico, the states of Colima, Michoacan, and Jalisco went under a yellow alert; Nayarit was placed on a green alert. Blue alerts were issued for Baja California Sur, Sinaloa, Guerrero, and Oaxaca.[43] The port of Manzanillo was closed as a precaution, where the storm brought rain and storm surge.[44] The outer rainbands of the storm also brought moderate to heavy rainfall along coastal areas of Colima and Jalisco.[45] A total of 49 structures were damaged due to the storm.[46][47]
Hurricane Erick
| Category 1 hurricane (SSHWS) | |||
|---|---|---|---|
| |||
| Duration | July 4 – July 9 | ||
| Peak intensity | 80 mph (130 km/h) (1-min) 983 mbar (hPa) | ||
.jpg)

A tropical wave moved off the western coast of Africa on June 18 and continued westward across Central America and into the eastern Pacific by June 29. It subsequently interacted with a large cyclonic gyre, leading to an increase in convective activity and the formation of an area of low pressure. Following satellite and microwave data,[48] the disturbance was upgraded to a tropical depression at 1200 UTC on July 4. Initially, moderate easterly shear prevented much organization as the system tracked west-northwest; however, a reprieve in upper-level winds by 0000 UTC on July 5 allowed the depression to intensify into Tropical Storm Erick as convective bands gained more curvature. A period of steady intensification over the next day allowed the system to attain Category 1 hurricane intensity at 0600 UTC and reach its peak with winds of 80 mph (130 km/h) and a minimum barometric pressure of 983 mb (hPa; 29.03 inHg) six hours later. Decreasing ocean temperatures caused the convective appearance to deteriorate at a steady pace; by 1800 UTC on July 7, Erick weakened to a tropical storm, and by 0600 UTC on July 9, the system no longer sustained enough organization to be considered a tropical cyclone.[49]
The outer rainbands of the storm brought gusty winds just offshore the Mexican coast.[50][51] In Acapulco and Puerto Marques, the storm was responsible for minor flooding.[47] Elsewhere across the state, most of the damage was due to landslides.[52] Along the coast of Colima, 9-foot (2.7 m) waves were recorded.[53] Although some flooding was reported across the state, damage was minor.[54] Further north, in Nayarit, however, damage was extensive. One woman died. One river overflowed its banks, which directly affected numerous cities. The Mexican military and officials in Nayarit attempted to rescue hundreds of people affected by Hurricane Erick.[55]
Tropical Storm Flossie
| Tropical storm (SSHWS) | |||
|---|---|---|---|
| |||
| Duration | July 25 – July 30 | ||
| Peak intensity | 70 mph (110 km/h) (1-min) 994 mbar (hPa) | ||

A tropical wave moved off the western coast of Africa on July 9 and crossed Central America on July 18. The disturbance initially lacked a well-defined center until early on July 25 as convection steadily increased, leading the formation of a tropical depression at 00:00 UTC that day; six hours later, the depression strengthened into Tropical Storm Flossie. Steered westward amid a favorable environment, the cyclone steadily intensified, attaining peak winds of 70 mph (110 km/h) at 12:00 UTC on July 27 as an eye became evident on satellite imagery. Flossie crossed into the Central Pacific shortly thereafter, where increasing wind shear prompted a gradual weakening trend. At 00:00 UTC on July 30, the system weakened to a tropical depression; twelve hours later, it degenerated into a remnant low while located near the northern coast of Kauai.[56]
Following Flossie's crossing into the Central Pacific Hurricane Center's warning zone, a tropical storm watch was issued for Hawaii and Maui counties on July 27.[57] All Maui County parks were closed due to the storm as county authorities activated emergency operations.[58] Upon becoming the first storm to directly hit the state in 20 years,[59] gusty winds downed trees and power lines. More than 9,000 residences were without electricity across the state, with most outages concentrated in Kihei, Maui, and Puna.[60][61][62]
Hurricane Gil
| Category 1 hurricane (SSHWS) | |||
|---|---|---|---|
| |||
| Duration | July 30 – August 6 | ||
| Peak intensity | 85 mph (140 km/h) (1-min) 985 mbar (hPa) | ||
The formation of Gil is attributed to a tropical wave that departed the west coast of Africa on July 16 and entered the East Pacific on July 24. Initially disheveled, the wave slowly organized as convection increased and its associated center became better defined, leading to the formation of a tropical depression at 12:00 UTC on July 30; six hours later, the depression strengthened into Tropical Storm Gil. With a small circulation, the cyclone entered a period of rapid deepening, intensifying into a Category 1 hurricane at 18:00 UTC on July 31 and attaining peak winds of 85 mph (140 km/h) a day later. Thereafter, increasing shear and drier air caused the storm to begin weakening; at 18:00 UTC on August 2, Gil weakened to a tropical storm, and two days later, it weakened further to a tropical depression. A brief burst of convection allowed the cyclone to regain tropical storm intensity at 06:00 UTC on August 6 as it crossed into the Central Pacific, but Gil quickly weakened to a tropical depression twelve hours later. At 00:00 UTC on August 7, the system degenerated into an open trough well east-southeast of the Hawaiian Islands.[63]
Hurricane Henriette
| Category 2 hurricane (SSHWS) | |||
|---|---|---|---|
| |||
| Duration | August 3 – August 11 | ||
| Peak intensity | 105 mph (165 km/h) (1-min) 976 mbar (hPa) | ||


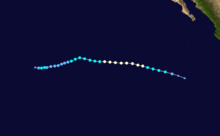
A tropical wave emerged off the western coast of Africa on July 19 and reached the East Pacific on July 26. Embedded within the Intertropical Convergence Zone, convection slowly coalesced about an area of low pressure, leading to the formation of a tropical depression by 12:00 UTC on August 3; twelve hours later, the depression intensified into Tropical Storm Henriette while located about 1,800 mi (1,900 km) southwest of the southern tip of Baja California. The system initially moved west-southwest following formation, but turned toward the west-northwest as it reached the western periphery of a mid-level ridge to its north. Amid a favorable environment, Henriette steadily intensified, becoming a Category 1 hurricane by 06:00 UTC on August 6 and unexpectedly attaining peak winds of 105 mph (165 km/h) by 18:00 UTC on August 8. The hurricane quickly weakened over increasingly cool waters as it resumed its southwesterly track into the Central Pacific, weakening to a tropical storm early on August 9 and further to a tropical depression two days later. By 18:00 UTC on August 11, the effects of increasing wind shear caused Henriette to degenerate into a remnant low while positioned roughly 430 mi (690 km) south of Kailua-Kona, Hawaii. The remnant low drifted west-southwest until dissipating the next day.[64]
Tropical Storm Pewa
| Tropical storm (SSHWS) | |||
|---|---|---|---|
| |||
| Duration | August 16 – August 18 (Exited basin) | ||
| Peak intensity | 65 mph (100 km/h) (1-min) 1000 mbar (hPa) | ||

A broad trough was first identified west of Central America in early August. This trough drifted westward to the south of the Hawaiian Islands by August 14, where it yielded three defined areas of disturbed weather. Largely devoid of convection initially, the westernmost disturbance steadily organized over the coming days, leading to the formation of a tropical depression by 06:00 UTC on August 16; six hours later, the depression intensified into Tropical Storm Pewa. The cyclone tracked west-northwest following formation, steered by a mid-level ridge to its north. Pewa crossed the International Dateline into the West Pacific on August 18, where it would later become a typhoon before succumbing to unfavorable wind shear.[65]
Tropical Storm Unala
| Tropical storm (SSHWS) | |||
|---|---|---|---|
| |||
| Duration | August 19 – August 19 (Exited basin) | ||
| Peak intensity | 40 mph (65 km/h) (1-min) 998 mbar (hPa) | ||


On August 10, the CPHC began monitoring a trough located roughly 1,300 mi (2,090 km) east-southeast of the Big Island of Hawaii for potential development.[66] Disorganized convective activity developed in association with the trough as it moved generally westward.[67] By August 13, multiple areas of vorticity formed within the disturbance, hindering its development into a coherent cyclone.[68] Marginally favorable environmental conditions allowed for some organization on August 15.[69] Following an increase strong thunderstorms around the center, the CPHC stated that it was becoming a tropical depression.[70] However, outflow from a nearby disturbance, which would soon become Tropical Storm Pewa, disrupted the system and caused it to become more disorganized.[71] Late on August 19 the depression strengthened into a tropical storm. However, outflow from the nearby Typhoon Pewa caused an increase in wind shear over the system, causing Unala to become disorganized and weaken. By this time the system has crossed into the Western Pacific basin. During the afternoon hours of August 19, the depression had dissipated completely, as it was being absorbed by Pewa.[72]
Tropical Depression Three-C
| Tropical depression (SSHWS) | |||
|---|---|---|---|
| |||
| Duration | August 19 – August 20 (Exited basin) | ||
| Peak intensity | 35 mph (55 km/h) (1-min) 1008 mbar (hPa) | ||


A tropical disturbance formed east of Tropical Storm Unala late on August 18. It intensified into Tropical Depression Three-C on August 19. Late on August 20, the system crossed the International Date Line and moved into the Western Pacific basin, until it was absorbed by Tropical Storm Pewa the same day.[73]
Tropical Storm Ivo
| Tropical storm (SSHWS) | |||
|---|---|---|---|
| |||
| Duration | August 22 – August 25 | ||
| Peak intensity | 45 mph (75 km/h) (1-min) 997 mbar (hPa) | ||
.jpg)

The southern portion of a tropical wave entered the East Pacific on August 15. Although moderate shear initially hindered the organization of convection, a broad low- to mid-level circulation formed and steadily coalesced. Upper-level winds lessened on August 22 as the disturbance turned northwestward, leading to the formation of a tropical depression by 12:00 UTC. Following designation, the depression began to interact with a tropical wave to its east, ultimately leading to an abrupt center formation to the northeast. By 00:00 UTC on August 23, the cyclone intensified into Tropical Storm Ivo. Resuming its northwest track around a mid-level ridge across the central United States and Mexico, Ivo attained peak winds of 45 mph (75 km/h) before crossing a sharp sea surface temperature gradient. The system weakened to a tropical depression by 00:00 UTC on August 25 and further degenerated into a remnant low by 18:00 UTC on August 25 while located less than 115 mi (185 km) west of the west-central coast of the Baja California peninsula. The remnant low drifted slowly south-southwestward before dissipating early on August 28.[74]
When the system first posed a threat to the Baja California Peninsula, a "green alert" was declared for Socorro Island and Baja California Sur.[75] At 21:00 UTC on August 23, a tropical storm warning was issued from Punta Abreojos to Loreto, including Cabo San Lucas. A tropical storm watch was placed for the Baja California Peninsula from Punta Abreojos to Punta Eugenia.[76] Seven ports in Baja California Sur were closed.[77] Along the peninsula, 6,000 people were affected and many highways were damaged. Water supply was cut off to Loreto.[78] In all, 400 people were evacuated and 200 homes were flooded. Six people were injured, including two serious.[79] In the United States, flash flood watches were issued for Piima County,[80] extending westward across western Arizona[81] and into Southern Nevada.[82] Several roads were closed in Yuma County.[81] In East County, many roads were flooded.[83] Elsewhere, Borrego Springs saw 3 inches (76 mm) of rain in less than an hour, resulting in flash flooding, which stranded motorists.[84] Several mudslides were also reported in San Bernardino County. One person drowned in Needles after flood waters overwhelmed her vehicle;[85] 18 swift water rescues were made in the same area. Heavy rains in Nevada, amounting to nearly 4 in (100 mm) at Mount Charleston, caused significant flooding; damage in the Las Vegas Valley reached $300,000.[86] Widespread flooding occurred around Zion National Park.[87]
Tropical Storm Juliette
| Tropical storm (SSHWS) | |||
|---|---|---|---|
| |||
| Duration | August 28 – August 29 | ||
| Peak intensity | 65 mph (100 km/h) (1-min) 997 mbar (hPa) | ||


An area of convection occurred on August 25. It was classified as a disturbance the next day. Late on August 27, the disturbance entered warm waters as it became Tropical Depression Ten-E. Due to warm waters and windshear, Ten-E intensified into Tropical Storm Juliette late on August 28.[88] As Juliette races towards northwest, it reached peak intensity and then rapidly weakened to a depression on August 29. The JTWC issued its final advisories later that day while Juliette's remnants continued to move west, with its circulation dissipating very early on August 31.[89]
Upon formation, a "green alert" was issued for Sonora, the northern portion of the Baja California Peninsula, Jalisco, Nayarit, and Socorro Island, while a "blue alert" was issued for Baja California Sur and Colima.[90] Six shelters opened for in San Jose del Cabo and Cabo San Lucas[91] and were used by 164 residents,[92] though many refused to go. Much of Baja California Sur briefly lost power, including the communities of Todos Santos and Pescadero, and portions of Cabo San Lucas and San Jose del Cabo. Furthermore, one man was electrocuted and later died. One home was destroyed.[93] A total of 1,600 persons spent the night in a shelter.[94]
Hurricane Kiko
| Category 1 hurricane (SSHWS) | |||
|---|---|---|---|
| |||
| Duration | August 30 – September 2 | ||
| Peak intensity | 75 mph (120 km/h) (1-min) 989 mbar (hPa) | ||


On August 28, a trough within the ITCZ was first identified well south-southwest of the southern tip of Baja California. That day, an area of low pressure formed along the trough and tracked northwest. A tropical wave, one responsible for the development of tropical storms Erin and Fernand in the Atlantic, and Tropical Storm Juliette in the East Pacific, bypassed the low on August 30, leading to an increase in convection and the formation of a tropical depression by 12:00 UTC that day. The depression initially strengthened slowly under the influence of moderate northerly wind shear, becoming a tropical storm by 12:00 UTC on August 31. Thereafter, upper-level winds became more conducive as the system turned north-northeast, and Kiko began a period of rapid deepening yielding peak winds of 75 mph (120 km/h) by 06:00 UTC on September 1. Following peak, an increase in wind shear and track over cooler waters led to a weakening trend. Kiko deteriorated into a tropical storm by 18:00 UTC and further degenerated into a remnant low by 12:00 UTC on September 2. The remnant low executed a cyclonic loop and tracked southeast before dissipating on September 4.[95]
Tropical Storm Lorena
| Tropical storm (SSHWS) | |||
|---|---|---|---|
| |||
| Duration | September 5 – September 7 | ||
| Peak intensity | 50 mph (85 km/h) (1-min) 1002 mbar (hPa) | ||

The formation of Lorena is attributed to a tropical wave first identified over Central America on August 31. The wave moved slowly across the East Pacific for several days while remaining disorganized. However, by 06:00 UTC on September 5, the disturbance acquired sufficient organization to be declared a tropical depression; six hours later, the depression intensified into Tropical Storm Lorena. Steered northwest around a mid-level ridge over Mexico, an elongation of the low-level center, separation of the low and mid-level centers, and light to moderate southwesterly shear prompted only gradual strengthening, and Lorena attained peak winds of 50 mph (85 km/h) on September 6. Thereafter, the introduction of dry and stable air caused the cyclone to become disheveled as associated convection dissipated. Lorena weakened to a tropical depression at 12:00 UTC on September 7 and degenerated into a remnant low six hours later while located 60 mi (95 km) west-southwest of Santa Fe, Mexico. The low turned west and south before opening up into a trough early on September 9.[96]
Upon becoming a tropical cyclone, a "yellow alert" was issued for Colima and Nayarit. A "green alert" was issued for Socorro Island, Michoacan, and Jalisco while a "blue alert" was in effect for Baja California Sur and Sinaloa.[97] Classes were suspended for Los Cabos.[98] The ports of Mazatlan, La Paz, Cabo San Lucas, Los Barriles, and San José del Cabo were closed because of high waves.[99][100] Lorena brought moderate rain over the peninsula.[101]
Hurricane Manuel
| Category 1 hurricane (SSHWS) | |||
|---|---|---|---|
| |||
| Duration | September 13 – September 19 | ||
| Peak intensity | 75 mph (120 km/h) (1-min) 983 mbar (hPa) | ||


On September 13, a tropical depression formed off the southwest coast of Mexico from a tropical wave that entered the basin two days earlier. Six hours later, it intensified into Tropical Storm Manuel while moving northwestward. The storm turned to the north on September 14 as a mid-level ridge over central Mexico weakened. By 06:00 UTC on September 14, Manuel initially attained peak winds of 70 mph (110 km/h), which it maintained upon moving ashore near Pichilinguillo, Mexico six hours later. Once inland, Manuel weakened quickly over the high terrain of Mexico, degenerating into a weak trough by 06:00 UTC on September 16. The remnant mid-level center and trough continued to the northwest around the ridge, emerging into the Gulf of California during the afternoon of September 16. After the convection reorganized, Manuel reformed into a tropical depression about 175 mi (280 km) east of Cabo San Lucas, Mexico. Within an environment exceptionally conducive for intensification, Manuel began a period of rapid deepening, becoming a tropical storm for a second time by 06:00 UTC on September 18 and a Category 1 hurricane by 00:00 UTC on September 19. Twelve hours later, the system made landfall near Culiacán, Mexico with peak winds of 75 mph (120 km/h). Manuel quickly weakened as it once again passed over the higher terrain of Mexico, becoming a tropical storm by 18:00 UTC and further degenerating into a broad area of low pressure over the Sierra Madre Occidental mountain range by 00:00 UTC on September 20.[102]
Tropical Storm Narda
| Tropical storm (SSHWS) | |||
|---|---|---|---|
| |||
| Duration | October 6 – October 10 | ||
| Peak intensity | 65 mph (100 km/h) (1-min) 997 mbar (hPa) | ||

A tropical wave emerged off the western coast of Africa on September 12 and entered the East Pacific almost two weeks later. On October 1, an area of low pressure detached from the wave and began to organize as it moved west-northwest. Organized convective bands were observed by 18:00 UTC on October 6, marking the formation of a tropical depression about 865 mi (1,390 km) southwest of the southern tip of Baja California; six hours later, the depression strengthened into Tropical Storm Narda. Amid a favorable environment, the cyclone steadily intensified after designation, attaining peak winds of 65 mph (100 km/h) by 18:00 UTC on October 7 as a partial eyewall became evident on satellite. However, associated convection began to weaken thereafter as Narda encountered drier air and stronger wind shear. At 00:00 UTC on October 9, Narda weakened to a tropical depression; after producing intermittent convection for a day, the system degenerated into a remnant low by 12:00 UTC on October 10. The low moved southwest and dissipated a few days later.[103]
Tropical Storm Octave
| Tropical storm (SSHWS) | |||
|---|---|---|---|
| |||
| Duration | October 12 – October 15 | ||
| Peak intensity | 65 mph (100 km/h) (1-min) 994 mbar (hPa) | ||


A tropical wave moved across Central America and into the East Pacific on October 5. While passing south of the coastline of Mexico, the wave interacted with a large area of disturbed weather at the base of an upper-level trough, and the two features eventually merged by October 7. The incipient disturbance steadily organized over subsequent days, leading to the formation of a tropical depression by 18:00 UTC on October 12 while located about 545 mi (875 km) south of the southern tip of Baja California; six hours later, the depression intensified into Tropical Storm Octave. Gradually recurving northeast around a subtropical ridge, the cyclone steadily strengthened amid a favorable atmospheric environment, reaching a peak intensity of 65 mph (100 km/h) by 18:00 UTC on October 13. Thereafter, the cloud pattern became increasingly disorganized as wind shear increased the storm moved over cooler waters. The system moved ashore near Cabo San Lazaro, Mexico at 05:00 UTC on October 23 with maximum winds of 45 mph (75 km/h) and quickly weakened over land. By 12:00 UTC, Octave weakened to a tropical depression, and six hours later, it further degenerated into a remnant low over the southern portion of Sonora. The low dissipated shortly thereafter.[104]
Tropical Storm Priscilla
| Tropical storm (SSHWS) | |||
|---|---|---|---|
| |||
| Duration | October 14 – October 16 | ||
| Peak intensity | 45 mph (75 km/h) (1-min) 1001 mbar (hPa) | ||

An area of convection, possibly in relation to a tropical wave that emerged off the western coast of Africa on September 16, developed along the ITCZ on October 7. Becoming embedded within a pre-existing, broad circulation, the disturbance only slowly congealed due to wind shear from nearby Tropical Storm Octave. Despite this, it acquired sufficient organization to be deemed a tropical depression by 00:00 UTC on October 14 while located about 810 mi (1,305 km) south-southwest of the southern tip of Baja California. Steered northwest and north around a mid-level ridge over Mexico, the depression became a tropical storm by 06:00 UTC and attained peak winds of 45 mph (75 km/h) six hours later. Thereafter, a combination of cooler waters and the continued influences of Octave caused Priscilla to weaken. At 18:00 UTC on October 15, it was downgraded to a tropical depression, and by 18:00 UTC the following day, the cyclone degenerated into a remnant low. The low turned westward before dissipating on October 18.[105]
Hurricane Raymond
| Category 3 hurricane (SSHWS) | |||
|---|---|---|---|
| |||
| Duration | October 20 – October 30 | ||
| Peak intensity | 125 mph (205 km/h) (1-min) 951 mbar (hPa) | ||


A disturbance within the ITCZ was first identified over the southwestern Caribbean Sea on October 13, crossing Central America and entering the East Pacific over the subsequent three days. Deep convection steadily increased and organized into curved spiral bands, leading to the formation of a tropical depression by 00:00 UTC on October 20; six hours later, it was upgraded to Tropical Storm Raymond. Steered northwest by a series of ridges to the cyclone's north, Raymond rapidly intensified amid warm ocean temperatures and low wind shear, becoming a hurricane by 00:00 UTC on October 21 and attaining Category 3 status with peak winds of 125 mph (205 km/h) by 18:00 UTC that day. Executing a clockwise loop, significant cold water upwelling and increased upper-level winds caused the cyclone to weaken abruptly, deteriorating to tropical storm intensity by 06:00 UTC on October 23. Environmental conditions became more favorable for intensification the next day, allowing Raymond to gradually intensify to hurricane strength by 12:00 UTC on October 27 and further to Category 2 hurricane intensity twelve hours later. Recurving northeast under the influence of an approaching trough, the cyclone began to weaken once again as wind shear increased, with the system weakening below hurricane threshold again by 00:00 UTC on October 29 and further to tropical depression status by 06:00 UTC on October 30. After all associated convection dissipated, Raymond degenerated to a remnant low by 12:00 UTC. The remnant low turned west and dissipated on November 1.[106]
Despite remaining offshore, Raymond's close proximity to the Mexican coast was enough to prompt tropical cyclone warnings and watches.[107] Due to the threat of rainfall, residents from 81 municipalities in Mexico were ordered to evacuate out of flood-prone regions.[108][109] Precipitation from Raymond peaked at 7.63 in (194 mm) near Acapulco within a two-day period.[110] Minor flooding resulted from the outer rainbands of the hurricane.[111] Though no deaths were reported, 585 people were rendered homeless. Following the storm, the Mexican government declared a state of emergency for 10 municipalities in Guerrero.[112]
Tropical Storm Sonia
| Tropical storm (SSHWS) | |||
|---|---|---|---|
| |||
| Duration | November 1 – November 4 | ||
| Peak intensity | 45 mph (75 km/h) (1-min) 1002 mbar (hPa) | ||


A strong upward pulse of the Madden-Julian Oscillation pushed across the East Pacific during the last week of October, yielding the formation of a broad area of low pressure. A tropical wave passed through this gyre late on October 26, leading to the formation of disorganized convection. After several days of consolidation, the disturbance acquired sufficient organization to be declared a tropical depression by 06:00 UTC on November 1. Gradually recurving northeast in response to a series of troughs to the system's north, the cyclone only slowly organized under moderate wind shear, and the depression intensified into Tropical Storm Sonia by 00:00 UTC on November 3. After reaching peak winds of 45 mph (75 km/h) later that afternoon, an additional increase in upper-level winds caused the cyclone to weaken to minimum tropical storm intensity as it made landfall near El Dorado, Mexico early on November 4. Sonia weakened rapidly once inland, becoming a tropical depression at 06:00 UTC and dissipating over the Sierra Madre Occidental mountain range six hours later.[113]
Storm names
The following names were used to name storms that formed in the Northeastern Pacific Ocean during 2013. The names not retired from this list will be used again in the 2019 season. This is the same list used in the 2007 season.[114]
|
|
For storms that form in the Central Pacific Hurricane Center's area of responsibility, encompassing the area between 140 degrees west and the International Date Line, all names are used in a series of four rotating lists.[115] Two names, Pewa and Unala, were used, marking the first time multiple Central Pacific cyclones were named since three were identified there in 2009.[116][117]
|
|
|
|
Retirement
On April 10, 2014, at the 36th session of the RA IV hurricane committee, the name Manuel was retired due to the damage and deaths it caused and will not be used for another Pacific hurricane. Manuel will be replaced with Mario for the 2019 Pacific hurricane season.[118]
Season effects
This is a table of all of the storms that formed in the 2013 Pacific hurricane season. It includes their duration, names, landfall(s) (in parenthesis), damages, and death totals. Deaths in parentheses are additional and indirect, but were still related to that storm. Damage and deaths include totals while the storm was extratropical, a wave, or a low, and all of the damage figures are in 2013 USD.
| Saffir–Simpson hurricane wind scale | ||||||
| TD | TS | C1 | C2 | C3 | C4 | C5 |
| Storm name |
Dates active | Storm category
at peak intensity |
Max 1-min wind mph (km/h) |
Min. press. (mbar) |
Areas affected | Damage (millions USD) |
Deaths | |||
|---|---|---|---|---|---|---|---|---|---|---|
| Alvin | May 15 – May 17 | Tropical storm | 60 (95) | 1000 | None | None | None | |||
| Barbara | May 28 – May 30 | Category 1 hurricane | 80 (130) | 983 | Central America, Southwestern Mexico, Eastern Mexico | 1 | 5 | |||
| Cosme | June 23 – June 27 | Category 1 hurricane | 85 (140) | 980 | Revillagigedo Islands, Western Mexico, Baja California Peninsula | Minimal | 3 | |||
| Dalila | June 29 – July 7 | Category 1 hurricane | 80 (130) | 984 | Southwestern Mexico, Western Mexico | Minimal | None | |||
| Erick | July 4 – July 9 | Category 1 hurricane | 80 (130) | 983 | Southwestern Mexico, Western Mexico, Baja California Peninsula | Moderate | 2 | |||
| Flossie | July 25 – July 30 | Tropical storm | 70 (110) | 994 | Hawaii | 0.024 | None | |||
| Gil | July 30 – August 6 | Category 1 hurricane | 85 (140) | 985 | None | None | None | |||
| Henriette | August 3 – August 11 | Category 2 hurricane | 105 (165) | 976 | None | None | None | |||
| Pewa | August 16 – August 18 | Tropical storm | 65 (100) | 1000 | None | None | None | |||
| Unala | August 19 | Tropical storm | 40 (65) | 998 | None | None | None | |||
| Three-C | August 19 – August 20 | Tropical depression | 35 (55) | 1008 | None | None | None | |||
| Ivo | August 22 – August 25 | Tropical storm | 45 (75) | 997 | Baja California Peninsula, Western United States | 0.3 | 1 | |||
| Juliette | August 28 – August 29 | Tropical storm | 65 (100) | 997 | Western Mexico, Baja California Peninsula, Northwestern Mexico | Minimal | 1 | |||
| Kiko | August 30 – September 2 | Category 1 hurricane | 75 (120) | 989 | Baja Calforinia Peninsula | None | None | |||
| Lorena | September 5 – September 7 | Tropical storm | 50 (85) | 1002 | Western Mexico, Baja California Peninsula | Minimal | None | |||
| Manuel | September 13 – September 19 | Category 1 hurricane | 75 (120) | 983 | Southwestern Mexico, Western Mexico , Northwestern Mexico, Texas | 4200 | 123 | |||
| Narda | October 6 – October 10 | Tropical storm | 65 (100) | 997 | None | None | None | |||
| Octave | October 12 – October 15 | Tropical storm | 65 (100) | 994 | Baja California Peninsula, Northwestern Mexico | Minimal | None | |||
| Priscilla | October 14 – October 16 | Tropical storm | 45 (75) | 1001 | None | None | None | |||
| Raymond | October 20 – October 30 | Category 3 hurricane | 125 (205) | 951 | Southwestern Mexico | Minimal | None | |||
| Sonia | November 1 – November 4 | Tropical storm | 45 (75) | 1002 | Northwestern Mexico | Minor | None | |||
| Season Aggregates | ||||||||||
| 21 cyclones | May 15 – November 4 | 125 (205) | 951 | 4201 | 135 | |||||
See also
- List of Pacific hurricanes
- List of Pacific hurricane seasons
- 2013 Atlantic hurricane season
- 2013 Pacific typhoon season
- 2013 North Indian Ocean cyclone season
- South-West Indian Ocean cyclone seasons: 2012–13, 2013–14
- Australian region cyclone seasons: 2012–13, 2013–14
- South Pacific cyclone seasons: 2012–13, 2013–14
Notes
- ↑ The totals represent the sum of the squares for every tropical storm's intensity of over 33 knots (38 mph, 61 km/h), divided by 10,000. Calculations are provided at Talk:2013 Pacific hurricane season/ACE calcs.
References
- ↑ Christopher W. Landsea; Neal Dorst; Erica Rule (June 2, 2011). "G: Tropical Cyclone Climatology". Hurricane Research Division: Frequently Asked Questions. Atlantic Oceanographic and Meteorological Laboratory. G1) When is hurricane season ?. Retrieved May 4, 2013.
- ↑ "Background Information: East Pacific Hurricane Season". Climate Prediction Center. National Oceanic and Atmospheric Administration. May 22, 2014. Retrieved January 19, 2015.
- 1 2 National Hurricane Center; Hurricane Research Division; Central Pacific Hurricane Center. "The Northeast and North Central Pacific hurricane database 1949–2015". United States National Oceanic and Atmospheric Administration's National Weather Service. A guide on how to read the database is available here.
- 1 2 "NOAA predicts below-normal Eastern Pacific hurricane season". Climate Prediction Center. National Oceanic and Atmospheric Administration. May 23, 2013. Retrieved January 19, 2015.
- ↑ "NOAA expects below-normal Central Pacific hurricane season". Central Pacific Hurricane Center. National Oceanic and Atmospheric Administration. May 21, 2013. Retrieved January 19, 2015.
- ↑ Robbie J. Berg (May 15, 2013). Tropical Storm Alvin Discussion Number 2. National Hurricane Center (Report). National Oceanic and Atmospheric Administration. Retrieved May 15, 2013.
- ↑ National Hurricane Center (May 2, 2013). "Tropical Cyclone Climatology". National Hurricane Center. National Oceanic and Atmospheric Administration. Retrieved May 23, 2013.
- ↑ Hurricane Specialist Unit (June 1, 2011). Monthly Tropical Weather Summary. National Hurricane Center (Report). National Oceanic and Atmospheric Administration. Retrieved May 23, 2013.
- ↑ Hurricane Specialist Unit (June 1, 2013). "Monthly Tropical Weather Summary" (TXT). National Hurricane Center. National Oceanic and Atmospheric Administration. Retrieved June 30, 2013.
- ↑ Hurricane Specialist Unit (June 1, 2012). Monthly Tropical Weather Summary (TXT). National Hurricane Center (Report). National Oceanic and Atmospheric Administration. Retrieved June 30, 2013.
- ↑ Hurricane Specialist Unit (June 1, 2007). Monthly Tropical Weather Summary (TXT). National Hurricane Center (Report). National Oceanic and Atmospheric Administration. Retrieved June 30, 2013.
- ↑ Stacy R. Stewart (May 31, 2013). Tropical Cyclone Report: Tropical Storm Alvin (PDF). National Hurricane Center (Report). Miami, Florida: National Oceanic and Atmospheric Administration. Retrieved January 10, 2015.
- ↑ Daniel P. Brown (August 19, 2013). Tropical Cyclone Report: Hurricane Barbara (PDF). National Hurricane Center (Report). Miami, Florida: National Oceanic and Atmospheric Administration. Retrieved January 10, 2015.
- ↑ Liseth Alues (May 27, 2013). "Lluvias persisten en el país por sistema de baja presión". El Salvador.com (in Spanish). Retrieved May 29, 2013.
- ↑ "Dejan lluvias en el Salvador un muerto y varias viviendas afectadas". Rotavio (in Spanish). May 27, 2013. Retrieved May 29, 2013.
- ↑ Georgina Saldierna (June 22, 2013). "Pérdidas por $250 mil millones por sequías e inundaciones en la última década: Peña Nieto" (in Spanish). La Jordana. Retrieved June 24, 2013.
- ↑ "Hurricane Barbara landfall in Mexico 2nd earliest". Yahoo News. Associated Press. May 29, 2013. Retrieved May 30, 2013.
- ↑ "Hurricane Barbara death toll rises to three in Mexico". The Voice of Russia: American edition. May 29, 2013. Retrieved May 30, 2013.
- ↑ "Hurricane Barbara slams into Mexico's Pacific Coast; two dead". Los Angeles Times. May 29, 2013. Retrieved May 30, 2013.
- ↑ Jose Cortes (May 29, 2013). "Hurricane Barbara floods Mexico's southern Pacific coast, kills two". Ruters. Retrieved May 30, 2013.
- ↑ "Declaran emergencia al sur de México por daños de huracán Bárbara". El Universo. May 31, 2013. Retrieved June 2, 2013.
- ↑ "Tonalá y Arriaga, los más afectados por Bárbara". El Universal (in Spanish). May 30, 2013. Retrieved May 30, 2013.
- ↑ "Daños menores en Chiapas tras paso de 'Bárbara'". El Universal (in Spanish). May 30, 2013. Retrieved May 30, 2013.
- ↑ Lopez Morals (May 30, 2013). "Hallan a salvo a pescadores dados por perdidos en Oaxaca". El Universal (in Spanish). Retrieved May 30, 2013.
- ↑ "Bárbara dejó más de 57 mil damnificados". El Universal (in Spanish). June 5, 2013. Retrieved June 6, 2013.
- ↑ Octavio Vélez (June 4, 2013). "Pierden los mangueros 10 dmp por daños causados por "Bárbara"" (in Spanish). Noticias Net. Retrieved June 20, 2013.
- ↑ Eric S. Blake (September 10, 2013). Tropical Cyclone Report: Hurricane Cosme (PDF). National Hurricane Center (Report). Miami, Florida: National Oceanic and Atmospheric Administration. Retrieved January 21, 2015.
- ↑ "Prevén lluvias en 5 estados por tormenta Cosme". El Universal (in Spanish). June 24, 2013. Retrieved June 24, 2013.
- ↑ "Cosme se fortalece y se aleja de costas mexicanas". El Universal (in Spanish). July 25, 2013. Retrieved July 25, 2013.
- ↑ "BCS decreta alerta azul por huracán Cosme". El Universal (in Spanish). June 25, 2013. Retrieved June 26, 2013.
- ↑ "Ya como huracán, "Cosme" se aleja de México". La Prensa (in Spanish). Organización Editorial Mexicana. June 25, 2013. Retrieved June 26, 2013.
- 1 2 "Guerrero alerta por lluvias generadas por Cosme". El Universal (in Spanish). June 24, 2013. Retrieved June 24, 2013.
- ↑ "Deja dos muertos huracán "Cosme" en Guerrero". Xeu (in Spanish). June 25, 2013. Retrieved June 26, 2013.
- ↑ "Huracán Cosme deja dos muertos en Guerrero". El Universal (in Spanish). June 25, 2013. Retrieved June 25, 2013.
- ↑ "Huracán Cosme provoca muerte de policía en Guerrero". Red Noticier (in Spanish). June 26, 2013. Retrieved June 26, 2013.
- ↑ "Volcán de Colima registra 'deslaves' por lluvia". El Universal (in Spanish). June 25, 2013. Retrieved June 25, 2013.
- ↑ "Huracán 'Cosme' causa lluvias en Colima: SMN". La Jarnada (in Spanish). June 25, 2013. Retrieved June 25, 2013.
- ↑ "Aumentan daños en playas de Colima por Cosme". June 29, 2013.
- ↑ "Cosme daña restaurantes de playa en Colima". El Universal. June 26, 2013. Retrieved June 26, 2013.
- ↑ "Mazatlan port close by Cosme effects". El Universal (in Spanish). June 26, 2013. Retrieved June 29, 2013.
- ↑ "CICLÓN COSME SE ALEJA DE MÉXICO". Fahrenheit magazine (in Spanish). AFP. June 28, 2013. Retrieved August 3, 2013.
- ↑ Richard J. Pasch (December 10, 2013). Tropical Cyclone Report: Hurricane Dalila (PDF). National Hurricane Center (Report). Miami, Florida: National Oceanic and Atmospheric Administration. Retrieved January 10, 2015.
- ↑ "Se intensifica tormenta Dalila; enciende alerta". El Universal. July 1, 2013. Retrieved July 4, 2013.
- ↑ "Cierran puerto en Manzanillo por tormenta Dalila". El Universal. July 1, 2013. Retrieved July 4, 2013.
- ↑ "Tormenta 'Dalila' causará lluvias en Jalisco y Colima". El Universal. July 2, 2013. Retrieved July 4, 2013.
- ↑ "Suspenden navegación en Michoacán por Erick". El Universal (in Spanish). July 5, 2013. Archived from the original on July 9, 2013. Retrieved July 6, 2013.
- 1 2 Adriana Covarrubias (July 5, 2013). "Acapulco y Zihuatanejo cierran bahías por Erick". El Universal (in Spanish). Archived from the original on July 9, 2013. Retrieved July 6, 2013.
- ↑ Eric S. Blake (July 4, 2013). Tropical Depression Five-E Discussion Number 1. National Hurricane Center (Report). National Oceanic and Atmospheric Administration. Retrieved November 2, 2013.
- ↑ Lixion A. Avila (August 28, 2013). Tropical Cyclone Report: Hurricane Erick (.PDF). National Hurricane Center (Report). National Oceanic and Atmospheric Administration. Retrieved November 2, 2013.
- ↑ "La tormenta tropical Erick pone en alerta al pacifico mexicano". CNN Mexico (in Spanish). July 5, 2013. Retrieved July 5, 2013.
- ↑ "Autoridades de Acapulco, en alerta por tormenta Erick". El Universal (in Spanish). July 5, 2013. Archived from the original on July 9, 2013. Retrieved July 5, 2013.
- ↑ ""Erick"deja inundaciones en Guerrero". El Mexicano (in Spanish). July 6, 2013. Retrieved July 6, 2013.
- ↑ "Amenaza Erick costa de Colima; registran marejadas". El Universal (in Spanish). July 6, 2013. Archived from the original on July 10, 2013. Retrieved July 6, 2013.
- ↑ Jiménez Padilla, Jesús (July 7, 2013). "Huracán Erick provoca inundaciones en Nayarit; en Colima cierran puerto". El Financiero. Archived from the original on July 12, 2013. Retrieved July 7, 2013.
- ↑ Guistav (July 6, 2013). "Huracán Erick causa muerte e inundación en Nayarit". Noti Cabos (in Spanish). Retrieved July 7, 2013.
- ↑ John P. Cangialosi; Derek Wroe (November 4, 2013). Tropical Cyclone Report: Tropical Storm Flossie (PDF). National Hurricane Center and Central Pacific Hurricane Center (Report). Miami, Florida and Honolulu, Hawaii: National Oceanic and Atmospheric Administration. Retrieved January 11, 2015.
- ↑ Robert T. Burke (July 27, 2013). "Tropical Storm Flossie Advisory Number 13". Central Pacific Hurricane Center (Report). National Oceanic and Atmospheric Administration. Retrieved July 29, 2013.
- ↑ "Maui Activates Emergency Operations Center, All County Facilities to Close Monday". July 28, 2013. Retrieved July 29, 2013.
- ↑ Amanda Paulson (July 29, 2013). "Hawaii braces for tropical storm Flossie, first direct hit in 20 years". Alaska Disptach. Retrieved July 29, 2013.
- ↑ Henry Austin and Daniel Arkin. "Tropical Storm Flossie dumps rain, knocks out power as it rakes Hawaii". NBC News. Retrieved July 30, 2013.
- ↑ Web Staff (July 29, 2013). "Hawaiian Electric companies responding to power outages following Flossie". Khon2. Retrieved July 29, 2013.
- ↑ Alan Yonan Jr. (July 29, 2013). "Thousands on Maui, Big Island without electricity". Hawaii Star-Advertiser. Retrieved July 30, 2013.
- ↑ John L. Beven II; Sam Houston (February 6, 2014). Tropical Cyclone Report: Hurricane Gil (PDF). National Hurricane Center and Central Pacific Hurricane Center (Report). Miami, Florida and Honolulu, Hawaii: National Oceanic and Atmospheric Administration. Retrieved January 11, 2015.
- ↑ Robbie J. Berg; Jeff Powell (January 23, 2014). Tropical Cyclone Report: Hurricane Henriette (PDF). National Hurricane Center and Central Pacific Hurricane Center (Report). Miami, Florida and Honolulu, Hawaii: National Oceanic and Atmospheric Administration. Retrieved January 14, 2015.
- ↑ Thomas Birchard (January 10, 2015). Tropical Cyclone Report: Tropical Storm/Typhoon Pewa (DOC). Central Pacific Hurricane Center (Report). Honolulu, Hawaii: National Oceanic and Atmospheric Administration. Retrieved February 1, 2015.
- ↑ "Tropical Weather Outlook". Central Pacific Hurricane Center. National Oceanic and Atmospheric Administration. August 10, 2013. Archived from the original (Report) on August 19, 2013. Retrieved August 19, 2013.
- ↑ "Tropical Weather Outlook". Central Pacific Hurricane Center. National Oceanic and Atmospheric Administration. August 11, 2013. Archived from the original (Report) on August 19, 2013. Retrieved August 19, 2013.
- ↑ "Tropical Weather Outlook". Central Pacific Hurricane Center. National Oceanic and Atmospheric Administration. August 13, 2013. Archived from the original (Report) on August 19, 2013. Retrieved August 19, 2013.
- ↑ "Tropical Weather Outlook". Central Pacific Hurricane Center. National Oceanic and Atmospheric Administration. August 15, 2013. Archived from the original (Report) on August 19, 2013. Retrieved August 19, 2013.
- ↑ "Special Tropical Weather Outlook". Central Pacific Hurricane Center. National Oceanic and Atmospheric Administration. August 15, 2013. Archived from the original (Report) on August 19, 2013. Retrieved August 19, 2013.
- ↑ "Tropical Weather Outlook". Central Pacific Hurricane Center. National Oceanic and Atmospheric Administration. August 16, 2013. Archived from the original (Report) on August 19, 2013. Retrieved August 19, 2013.
- ↑ Derek Wroe (June 19, 2014). Tropical Cyclone Report: Tropical Storm Unala (DOC). Central Pacific Hurricane Center (Report). Honolulu, Hawaii: National Oceanic and Atmospheric Administration. Retrieved August 16, 2015.
- ↑ "Tropical Depression 03 C". Retrieved August 19, 2013.
- ↑ Todd B. Kimberlain (November 25, 2013). Tropical Cyclone Report: Tropical Storm Ivo (PDF). National Hurricane Center (Report). Miami, Florida: National Oceanic and Atmospheric Administration. Retrieved January 14, 2015.
- ↑ "Alerta verde en BCS por tormenta tropical Ivo: Sinaproc". El Imparical. August 23, 2013. Retrieved August 23, 2013.
- ↑ "Tropical Storm Ivo heads north in eastern Pacific". San Diego Union Tribune. Associated Press. August 23, 2013. Retrieved November 19, 2015.
- ↑ "Cierran siete puertos en BCS por tormenta Ivo". El Universal (in Spanish). August 24, 2013. Retrieved August 27, 2013.
- ↑ "BCS reporta mil 600 afectados por tormenta Ivo". El Universal (in Spanish). August 26, 2013. Retrieved August 27, 2013.
- ↑ "Alerta en Veracruz por Fernand". El Universal. August 26, 2013. Retrieved August 27, 2013.
- ↑ "Ivo keeps monsoon active today". KOVA News. August 25, 2013. Retrieved August 25, 2013.
- 1 2 "Tropical Depression Ivo brings showers to Yuma County". ABC 15 News. August 25, 2013. Retrieved October 7, 2015.
- ↑ "Las Vegas copes with sporadic flooding". Mohave Daily News. August 27, 2013. Retrieved August 27, 2013.
- ↑ "Heavy rains flood roads in East County". FOX 5 News San Diego. August 25, 2013. Retrieved October 8, 2015.
- ↑ "Flash floods strand cars in Southern CA desert". The Sacramento Bee. Associated Press. August 25, 2013. Retrieved August 25, 2013.
- ↑ "Thunderstorms pound S. Cal for second day". UT San Diego. August 26, 2013. Retrieved August 27, 2013.
- ↑ "Las Vegas Area Flooding: Death Blamed on Remnants of Tropical Storm Ivo". The Weather Channel. August 26, 2013. Retrieved August 27, 2013.
- ↑ "Heavy rains wash through Southern Utah". The Spectrum. August 26, 2013. Retrieved August 27, 2013.
- ↑ Daniel P. Brown (August 28, 2013). Tropical Storm Juliette Public Advisory Number 1. National Hurricane Center (Report). National Oceanic and Atmospheric Administration. Retrieved August 28, 2013.
- ↑ http://www.nhc.noaa.gov/data/tcr/EP102013_Juliette.pdf
- ↑ "Tormenta Juliette prende alertas en siete estados". El Universal (in Spanish). August 28, 2013. Retrieved August 28, 2013.
- ↑ "Evacuan Los Cabos por tormenta Juliette". El Universal (in Spanish). August 28, 2013. Retrieved August 29, 2013.
- ↑ "Tormenta Juliette toca tierra en Baja California Sur". El Universal (in Spanish). August 29, 2013. Retrieved August 29, 2013.
- ↑ "Tropical Storm Juliette hits Mexico resorts". San Jose Mercury News. Associated Press. August 29, 2013. Retrieved November 19, 2015.
- ↑ Lizbeth Diaz (August 29, 2013). "Tropical Storm Juliette kills one near Mexican tourist hub". Reuters. Retrieved September 6, 2013.
- ↑ Daniel P. Brown (November 4, 2013). Tropical Cyclone Report: Hurricane Kiko (PDF). National Hurricane Center (Report). Miami, Florida: National Oceanic and Atmospheric Administration. Retrieved January 21, 2015.
- ↑ Eric S. Blake (January 8, 2014). Tropical Cyclone Report: Tropical Storm Lorena (PDF). National Hurricane Center (Report). Miami, Florida: National Oceanic and Atmospheric Administration. Retrieved January 14, 2015.
- ↑ "Se forma tormenta tropical Lorena en el Océano Pacífico Se forma tormenta tropical Lorena en el Océano Pacífico". El Universal (in Spanish). September 5, 2013. Retrieved September 6, 2013.
- ↑ "Suspenden clases en BCS por tormenta Lorena". El Universal (in Spanish). September 6, 2013. Retrieved September 6, 2013.
- ↑ "Cierran navegación en Mazatlán por Lorena". El Universal (in Spanish). September 6, 2013. Retrieved September 6, 2013.
- ↑ "BCS cierra cuatro puertos por tormenta Lorena". El Universal. September 6, 2013. Retrieved September 6, 2013.
- ↑ "Lorena afecta BCS; alistan sesión de Protección Civil". El Universal (in Spanish). September 6, 2013. Retrieved September 6, 2013.
- ↑ Richard J. Pasch; David A. Zelinsky (January 6, 2014). Tropical Cyclone Report: Hurricane Manuel (PDF). National Hurricane Center (Report). Miami, Florida: National Oceanic and Atmospheric Administration. Retrieved January 13, 2015.
- ↑ Lixion A. Avila (November 13, 2013). Tropical Cyclone Report: Tropical Storm Narda (PDF). National Hurricane Center (Report). Miami, Florida: National Oceanic and Atmospheric Administration. Retrieved January 19, 2015.
- ↑ John P. Cangialosi (December 2, 2013). Tropical Cyclone Report: Tropical Storm Octave (PDF). National Hurricane Center (Report). Miami, Florida: National Oceanic and Atmospheric Administration. Retrieved January 19, 2015.
- ↑ John L. Beven II (February 5, 2014). Tropical Cyclone Report: Tropical Storm Priscilla (PDF). National Hurricane Center (Report). Miami, Florida: National Oceanic and Atmospheric Administration. Retrieved January 19, 2015.
- ↑ Robbie J. Berg (January 6, 2014). Tropical Cyclone Report: Hurricane Raymond (PDF). National Hurricane Center (Report). Miami, Florida: National Oceanic and Atmospheric Administration. Retrieved January 20, 2015.
- ↑ "En alerta roja por Raymond, Guerrero y Michoacán". El Universal (in Spanish). October 21, 2013. Retrieved October 21, 2013.
- ↑ "Por Raymond, pide Aguirre emergencia para 9 municipios". El Universal (in Spanish). October 20, 2013. Retrieved October 20, 2013.
- ↑ "'Raymond' incrementa su fuerza y ya es huracán categoría 2" (in Spanish). Animal Politico. October 20, 2013. Retrieved October 21, 2013.
- ↑ Doyle Rice; USA Today (October 22, 2013). "Hurricane Raymond weakens near Mexico". Langiston Journal. Associated Press. Retrieved October 22, 2013.
- ↑ "Evacuan colonias de Acapulco por huracán Raymond". El Universal (in Spanish). October 21, 2013. Retrieved October 21, 2013.
- ↑ "Fonden para 11 municipios tras Raymond; reanudan clases". El Universal (in Spanish). October 22, 2013. Retrieved October 22, 2013.
- ↑ Todd B. Kimberlain (January 8, 2013). Tropical Cyclone Report: Tropical Storm Sonia (PDF). National Hurricane Center (Report). Miami, Florida: National Oceanic and Atmospheric Administration. Retrieved January 11, 2015.
- ↑ "Tropical Cyclone Names". National Hurricane Center. National Oceanic and Atmospheric Administration. 2013-04-11. Archived from the original on May 8, 2013. Retrieved May 8, 2013.
- ↑ "Pacific Tropical Cyclone Names". Central Pacific Hurricane Center. National Oceanic and Atmospheric Administration. April 11, 2013. Archived from the original on May 8, 2013. Retrieved May 8, 2013.
- ↑ RSMC Tokyo — Typhoon Center (September 27, 2013). Severe Tropical Storm Pewa (RSMC Tropical Cyclone Best Track). Japan Meteorological Agency. Archived from the original on September 27, 2013. Retrieved September 27, 2013.
- ↑ RSMC Tokyo — Typhoon Center (September 27, 2013). Tropical Storm Unala (RSMC Tropical Cyclone Best Track). Japan Meteorological Agency. Archived from the original on September 27, 2013. Retrieved September 27, 2013.
- ↑ WMO retires Ingrid and Manuel for Atlantic and eastern North Pacific basins (Report). Silver Spring, Maryland: National Oceanic and Atmospheric Administration. April 10, 2014. Retrieved April 10, 2014.
External links
| Wikimedia Commons has media related to 2013 Pacific hurricane season. |
- National Hurricane Center Website
- National Hurricane Center's Eastern Pacific Tropical Weather Outlook
Tropical cyclones of the 2013 Pacific hurricane season | ||
|---|---|---|
| ||
| ||