2016 Pacific hurricane season
 | |
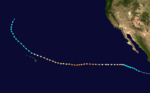
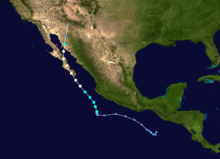
| Season summary map | |
| First system formed | January 7, 2016 (record earliest) |
|---|---|
| Last system dissipated | November 26, 2016 |
| Strongest storm1 | Seymour – 943 mbar (hPa) (27.85 inHg), 150 mph (240 km/h) |
| Total depressions | 23 |
| Total storms | 22 |
| Hurricanes | 13 |
| Major hurricanes (Cat. 3+) | 6 |
| Total fatalities | 9 total |
| Total damage | $96 million (2016 USD) |
| 1Strongest storm is determined by lowest pressure | |
2014, 2015, 2016, 2017, 2018 | |
| Related article | |
The 2016 Pacific hurricane season was the first time since 2011 in which no tropical cyclones occurred in May, and the first time since 2007 that no named storms formed in the month of June. It was another active season that produced a total of 22 named storms, 13 hurricanes and six major hurricanes. Although the season was very active, it was not as active as the previous two seasons; featuring sporadic periods of inactivity, particularly at the beginning and towards the end of the season. It officially started on May 15 in the East Pacific Ocean, and on June 1 in the Central Pacific; they both ended on November 30.[1] These dates conventionally delimit the period of each year when most tropical cyclones form in the Pacific basin. However, as illustrated by Hurricane Pali, which became the earliest Central Pacific tropical cyclone to form on record,[2] the formation of tropical cyclones is possible at any time of the year.
Seasonal forecasts
| Record | Named storms |
Hurricanes | Major hurricanes |
Ref | |
|---|---|---|---|---|---|
| Average (1981-2010): | 15.4 | 7.6 | 3.2 | [3] | |
| Record high activity: | 1992: 27 | 2015: 16 | 2015: 11 | [4] | |
| Record low activity: | 2010: 8 | 2010: 3 | 2003: 0 | [4] | |
| Date | Source | Named storms |
Hurricanes | Major hurricanes |
Ref |
| May 6, 2016 | SMN | 17 | 9 | 4 | [5] |
| May 27, 2016 | NOAA | 13–20 | 6–11 | 3–6 | [6] |
| Area | Named storms | Hurricanes | Major hurricanes | Ref | |
| Actual activity: | EPAC | 20 | 11 | 6 | |
| Actual activity: | CPAC | 2 | 2 | 0 | |
| Actual activity: | 22 | 13 | 6 | ||
On May 6, 2016, the Servicio Meteorológico Nacional (SMN) issued its first outlook for the Pacific hurricane season, forecasting a near average season with 17 named storms, 9 hurricanes, and 4 major hurricanes. On May 27, NOAA released their outlook, forecasting 13-20 named storms, 6-11 hurricanes, and 3-6 major hurricanes. NOAA admitted that this season would be difficult to predict because of changing conditions, but both organizations cited a dissipating El Niño and the formation of a La Niña event, which resulted in the prediction of a near-normal season in both basins. In the Central Pacific, about four to seven cyclones would form or enter within the basin, citing an equal 40% chance of an above-normal or near-normal season.
Seasonal summary


The Accumulated Cyclone Energy (ACE) index for the 2016 Pacific hurricane season, as of 15:00 UTC November 26, is 183.0475 units (143.9775 units from the Eastern Pacific and 39.07 units from the Central Pacific).[nb 1]
As the new year began, Tropical Depression Nine-C from the previous season was in the Central Pacific, but dissipated later that day. Nine-C's remnants led to the formation of Pali on January 7, two days before Tropical Storm Winona's formation in 1989. Pali subsequently surpassed Hurricane Ekeka's record and became a hurricane on January 11. When Pali reached a peak intensity of 100 mph, it surpassed Winona to become the strongest January tropical cyclone east of the dateline. Pali also reached a record low latitude of 2.0°N, beating Nine-C's record of 2.2°N to become the southern most tropical cyclone on record in the western hemisphere. Although Pali formed in January, the season kicked off to a very inactive start; for the first time since 2011, no tropical depressions or storms formed during the month of May, and no named storms formed during June since 2007.
Agatha formed on July 2, the latest first named storm in the eastern Pacific proper since 1969. Despite this, the season set a record for the most number of storms during the first half of July. When Georgette formed on July 21, it became the seventh named storm to form in the month of July; equaling the previous record set in 1985 and 2015 for the most active July since reliable records began. And when Frank became a hurricane (after Georgette did so), it marked a record-high 5 hurricanes in July. Finally, Howard formed on July 31, however was not named until August 1, one named storm shy of the record. Despite that, the season tied the record set in 1985 with the most named storms in July. Activity in August, was slightly less active than July. Lester and Madeline threatened the Big Island at hurricane strength. Lester passed north of the islands, Madeline brought some rain as the storm dissipated south of Hawaii. Javier and Newton followed similar paths close to the Mexican coast, with both making landfall in the Baja California Peninsula in August and early September respectively. After Newton lead off September; Hurricanes Orlene, Paine and Tropical Storm Roslyn followed forming far from land. Hurricane Ulika became the first tropical cyclone on record to cross 140°W three times; it also became the first named storm in the Central Pacific basin since Pali back in January. Ulika was the first storm since Ela in 2015 to form in the Eastern Pacific, but not be named until entering the Central Pacific. After an unusually quiet October, Hurricane Seymour became the sixth major hurricane of the season, as well as the strongest, so far. Tropical Storm Tina formed close to the coast of Mexico in mid-November. In late November, Tropical Storm Otto entered the basin from the Atlantic, becoming only the eighteenth cyclone to do so; however it dissipated quickly due to unfavorable conditions.
Storms
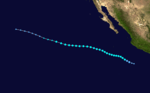
Hurricane Pali
| Category 2 hurricane (SSHWS) | |||
|---|---|---|---|
| |||
| Duration | January 7 – January 15 | ||
| Peak intensity | 100 mph (155 km/h) (1-min) 977 mbar (hPa) | ||

At the onset of 2016, the dissipating Tropical Depression Nine-C left behind a large area of moisture across the equatorial Pacific. A powerful westerly wind burst—a feature commonly associated with strong El Niño events—spurred cyclogenesis within the disturbance, resulting in the formation of an area of low pressure. Fueled by unusually high sea surface temperatures, estimated at 29.5 °C (85.1 °F), the system gradually coalesced into a tropical depression on January 7. This marked the earliest formation of a tropical cyclone on record in the Central Pacific, surpassing 1989's Tropical Storm Winona by six days.[7] It soon strengthened into a tropical storm, receiving the name Pali, becoming the earliest such system in the northeastern Pacific on record.[8] Then, on January 11, Pali strengthened into a Category 1 hurricane, becoming the earliest hurricane on record in the northeast Pacific basin, beating the previous record set by Hurricane Ekeka in 1992.[9] Pali reached a minimum latitude of 2.0°N, making it the lowest latitude tropical cyclone on record in the Western Hemisphere, surpassing Tropical Depression Nine-C which attained a minimum latitude of 2.2°N just two weeks prior.[10][11] On January 12, Pali strengthened further into a Category 2 hurricane.[12] During the next few days, Pali rapidly weakened while turning back towards the south-southeast, before weakening into a remnant low early on January 15.[13]
Unrelated to Pali, Hurricane Alex developed over the Atlantic during the last few days of Pali's existence. This marked the first known occurrence of simultaneous January tropical cyclones between the two basins.[14]
Tropical Depression One-E
| Tropical depression (SSHWS) | |||
|---|---|---|---|
| |||
| Duration | June 6 – June 8 | ||
| Peak intensity | 35 mph (55 km/h) (1-min) 1006 mbar (hPa) | ||

On June 4, the National Hurricane Center began monitoring an area for possible development.[15] Over the next few days, the chances of the storm forming were low. Unexpectedly, however, on June 6, advisories began to be issued on Tropical Depression One-E.[16][17] This led the Government of Mexico to issue a Tropical Storm Watch for its coast.[18] On June 7 the storm weakened slightly thus the watch was removed.[19] Early on June 8, the storm made landfall in Mexico near the Gulf of Tehuantepec and dissipated.[20]
As a precautionary measure, temporary shelters were opened across Chiapas.[21] The depression caused minor damage across Oaxaca, primarily within the Salina Cruz municipality. Heavy rains led to some street flooding and a sinkhole that damaged one home.[22]
Tropical Storm Agatha
| Tropical storm (SSHWS) | |||
|---|---|---|---|
| |||
| Duration | July 2 – July 5 | ||
| Peak intensity | 50 mph (85 km/h) (1-min) 1002 mbar (hPa) | ||


On June 30, the National Hurricane Center began to monitor an area for possible formation. On July 1, organization unexpectedly increased.[23] Seven hours later, early on July 2, the tropical disturbance strengthened into Tropical Depression Two-E. The system quickly organized, and later that day, the NHC upgraded Two-E into Tropical Storm Agatha.[24] Agatha slightly strengthened to peak intensity on July 3.[25] Winds topped off at 45 mph. Soon after, Agatha weakened slightly, with winds lowering to 40 mph later that day. The storm continued westwards over the next two days. Early on July 5, Agatha became post-tropical.[26]
With Agatha's naming nearly two months into the season (on July 2), the storm is the second-latest first named storm in the eastern Pacific proper — only Tropical Storm Ava, which reached tropical storm intensity on July 3, 1969, formed later in the season.[24]
Hurricane Blas
| Category 4 hurricane (SSHWS) | |||
|---|---|---|---|
| |||
| Duration | July 3 – July 10 | ||
| Peak intensity | 140 mph (220 km/h) (1-min) 947 mbar (hPa) | ||


On June 27, the NHC began to monitor a tropical wave moving over Central America for possible development.[27] A low pressure area formed south of Mexico on June 30,[28] and early on July 3, the storm gained enough organization to be designated Tropical Depression Three-E.[29] Six hours later, amid a favorable environment with high sea surface temperatures and decreasing vertical wind shear, it intensified into Tropical Storm Blas.[30] Steady strengthening ensued, and Blas intensified into a hurricane on July 4.[31] Intensification stalled for the remainder of that day as dry air wrapped into the circulation;[32] however, Blas began to rapidly deepen on July 5, and it became the first major hurricane of the season that evening.[33] Blas quickly reached peak intensity at Category 4 strength on July 6.[34] Blas weakened to a Category 3 hurricane soon after, before transitioning into an annular tropical cyclone and maintaining intensity.[35] However, Blas soon passed over decreasing sea surface temperatures, resulting in a slow weakening trend; Blas weakened below major hurricane status late on July 7,[36] and down to a Category 1 hurricane by the next day.[37] Blas further degraded to a tropical storm on July 9,[38] as weakening accelerated amid a stable air mass and increasing southwesterly shear.[39] Over sea surface temperatures of 24 °C (75 °F), Blas weakened to a tropical depression on July 10,[40] and degenerated into a post-tropical cyclone soon after.[41]
Moisture associated with the remnants of Blas brought showers to Hawaii.[42] Peak daily rainfall totals primairly ranged between 1 to 2 in (25 to 50 mm) and did not cause any serious flooding.[43]
Hurricane Celia
| Category 2 hurricane (SSHWS) | |||
|---|---|---|---|
| |||
| Duration | July 6 – July 16 | ||
| Peak intensity | 100 mph (155 km/h) (1-min) 972 mbar (hPa) | ||


On June 27, the NHC began monitoring a tropical wave over Central America.[44] The wave entered the East Pacific the following day, eventually gaining sufficient organization to be declared a tropical depression by 21:00 UTC on July 6.[45] The newly formed cyclone initially struggled to intensify with upwelling resultant from Hurricane Blas,[46] but a formative central dense overcast and several spiral bands prompted an upgrade to Tropical Storm Celia by 15:00 UTC on July 8.[47] Celia began to intensify after moving into warmer waters, obtaining Category 1 hurricane intensity by 21:00 UTC on July 10 and peaking as a Category 2 hurricane with winds of 100 mph (155 km/h) the next afternoon.[48][49] Thereafter, progressively cooler waters caused the system to weaken: it fell below hurricane intensity by 09:00 UTC on July 13,[50] weakened to a tropical depression by 21:00 UTC on July 15 after entering the Central Pacific,[51] and degenerated into a remnant low well east-northeast of Hawaii six hours later.[52]
Although the remnants of Celia passed north of Hawaii, it disrupted the typical trade winds, resulting in higher humidity across the island group and brief, but heavy showers over central Oahu and the windward slopes of Maui and the Big Island on July 18.[43]
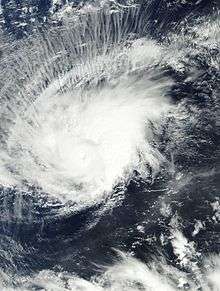
Hurricane Darby
| Category 3 hurricane (SSHWS) | |||
|---|---|---|---|
| |||
| Duration | July 11 – July 26 | ||
| Peak intensity | 120 mph (195 km/h) (1-min) 958 mbar (hPa) | ||

In the first two weeks of July, five low pressure systems formed in the Eastern Pacific. The fourth of these was first noted by the National Hurricane Center on July 9; it was located in a favorable environment, and was expected to develop into a tropical storm.[53] On July 11, the low was upgraded into Tropical Depression Five-E.[54] On July 12, Five-E intensified into a tropical storm, and was assigned the name Darby; the next day it attained hurricane status. It later strengthened into a Category 2 hurricane on July 15. On July 16, despite traveling over cooler waters, Darby unexpectedly became a Category 3 hurricane. However, 6 hours later, Darby weakened back to a Category 2.[55] Over the next four days, Darby gradually degraded over cooler waters as the storm moved westwards, towards Hawaii. But, as it advanced closer towards the area, it strengthened again, prompting several Tropical Storm warnings and watches to be issued for the Hawaiian Islands.[56] At 00:00 UTC July 24, it made landfall near Pahala of the Big Island.[57] Crossing the island as a minimal tropical storm, it was the first to do so since Hurricane Iselle in 2014. Slight weakening occurred as Darby traversed the island, however the storm retained minimal tropical storm strength as the storm began to move northwestwards. On July 25, Darby was downgraded into a depression near Oahu and degraded into a remnant low 18 hours later.
Tropical Storm Estelle
| Tropical storm (SSHWS) | |||
|---|---|---|---|
| |||
| Duration | July 15 – July 22 | ||
| Peak intensity | 70 mph (110 km/h) (1-min) 990 mbar (hPa) | ||
In the line of continuous tropical cyclones with the same path, the low that would become Estelle began to be monitored on July 14.[58] Less than a day after being designated as a low pressure system on July 15, it was upgraded to Tropical Depression Six-E.[59] Early on July 16, the fifth tropical storm of the Eastern Pacific season formed, being assigned the name Estelle.[60] By July 18, Estelle had strengthened into a 70 mph (110 km/h) storm, just below hurricane status, however, it slightly weakened afterwards.[61] Estelle continued to maintain its strength, however, by July 20, the storm was not forecast to strengthen into a hurricane and began degrading over cooler water northeast of Hawaii.[62] On July 22, Estelle weakened into a 40 mph (65 km/h) storm and degraded into a remnant low later that day.[63]
Hurricane Frank
| Category 1 hurricane (SSHWS) | |||
|---|---|---|---|
| |||
| Duration | July 21 – July 28 | ||
| Peak intensity | 85 mph (140 km/h) (1-min) 979 mbar (hPa) | ||

On July 16, the NHC noted that an area of low pressure was forecast to form south of Mexico in a few days.[64] A broad area of low pressure formed well south-southeast of Acapulco, Mexico three days later,[65] eventually organizing into Tropical Storm Frank by 21:00 UTC on July 21.[66] Steered northwest and then west-northwest, the cyclone steadily intensified within a favorable environment; by July 25, however, Frank passed over cooler waters resultant from previous cyclones, which caused weakening.[67] The system re-intensified after entering warm waters, becoming the record-setting fifth hurricane during the month by 15:00 UTC on July 26 and peaking with winds of 85 mph (140 km/h) twelve hours later.[68][69] The negative effects of cooler waters began to impede on the system shortly thereafter, causing Frank to weaken to a tropical storm by 15:00 UTC on July 27,[70] fall to a tropical depression by 15:00 UTC on July 28,[71] and degenerate into a remnant low six hours later.[72]
The outer rainbands of Frank brought heavy rains to Nayarit. In Tepic, several neighborhoods were flooded and 135 homes were damaged.[73] A total of 200 families were rendered homeless, and forced to seek shelter.[74]
Hurricane Georgette
| Category 4 hurricane (SSHWS) | |||
|---|---|---|---|
| |||
| Duration | July 21 – July 27 | ||
| Peak intensity | 130 mph (215 km/h) (1-min) 952 mbar (hPa) | ||


On July 15, the NHC noted that an area of low pressure was forecast to form well south of Mexico early the subsequent week.[75] An area of disturbed weather became established south of the Gulf of Tehuantepec the following day,[76] organizing sufficiently to be deemed a tropical depression by 21:00 UTC on July 21.[77] Despite moderate northeasterly wind shear, the depression intensified into Tropical Storm Georgette by 15:00 UTC on July 22 and was further upgraded to a Category 1 hurricane by 03:00 UTC on July 24.[78][79] Over a 24-hour period ending at 03:00 UTC July 25, the cyclone's maximum winds increased from 75 mph (120 km/h) to a peak of 130 mph (215 km/h) as convection became more symmetric and an eye cleared.[80] Progressively cooler waters and a more stable environment, however, caused Georgette to begin weakening soon thereafter: it fell below hurricane intensity by 15:00 UTC on July 26 and further degenerated into a remnant low well west-southwest of Baja California a day later.[81][82]
Remnant moisture from Georgette brought heavy rain to Oahu on July 31 but caused only minor flooding.[43]
Tropical Storm Howard
| Tropical storm (SSHWS) | |||
|---|---|---|---|
| |||
| Duration | July 31 – August 3 | ||
| Peak intensity | 60 mph (95 km/h) (1-min) 999 mbar (hPa) | ||

On July 29, the NHC noted that an area of low pressure was forecast to form well south of Mexico.[83] A large mass of convection developed south of Acapulco, Mexico two days later,[84] eventually coalescing into the record-tying eighth tropical cyclone to form in the East Pacific during the month of July.[85] The depression intensified into Tropical Storm Howard by 09:00 UTC on August 1,[86] and although the cyclone struggled with westerly wind shear and upwelling, it ultimately attained peak winds of 60 mph (95 km/h) a day later.[87] Continuing on its west-northwest path, Howard entered cooler waters and a more stable environment, and the combination of the two factors caused the cyclone to degenerate into a remnant low well west of Baja California by 21:00 UTC on August 3.[88]
Tropical Storm Ivette
| Tropical storm (SSHWS) | |||
|---|---|---|---|
| |||
| Duration | August 2 – August 8 | ||
| Peak intensity | 60 mph (95 km/h) (1-min) 1000 mbar (hPa) | ||


On July 25, the NHC highlighted an area well southwest of Baja California for tropical cyclone formation potential over the following week.[89] A broad area of low pressure formed south of Manzanillo, Mexico two days later,[90] eventually gaining ample organization to be declared a tropical depression by 21:00 UTC on August 2.[91] The depression was upgraded to Tropical Storm Ivette twelve hours later as banding increased.[92] Despite initial forecasts calling for a strong Category 1 hurricane,[92] moderate wind shear only allowed the cyclone to attain peak winds of 60 mph (95 km/h).[93] Continued wind shear and a more stable environment caused Ivette to weaken to a tropical depression by 03:00 UTC on August 8 as it entered the Central Pacific,[94] and 18 hours later it degenerated into a remnant low well east of Hawaii.[95]
Tropical Storm Javier
| Tropical storm (SSHWS) | |||
|---|---|---|---|
| |||
| Duration | August 7 – August 9 | ||
| Peak intensity | 65 mph (100 km/h) (1-min) 998 mbar (hPa) | ||

On August 2, the NHC noted that an area of low pressure in association with the remnants of Hurricane Earl could further develop into a tropical cyclone off the southwestern coastline of Mexico over subsequent days.[96] An area of disturbed weather formed south of the Gulf of Tehuantepec two days later,[97] eventually acquiring sufficient organization to be declared a tropical depression by 09:00 UTC on August 7.[98] Surface observations from Manzanillo, Mexico by 16:00 UTC indicated that the depression had intensified into Tropical Storm Javier.[99] Steered northwest by a mid-level ridge over Texas, Javier initially struggled to intensify as a result of light easterly wind shear;[100] by August 8, however, a reconnaissance aircraft found that the cyclone had strengthened to reach peak winds of 65 mph (100 km/h).[101] Drier air, increased wind shear, and land interaction caused Javier to quickly weaken thereafter as it passed just offshore of Baja California: it weakened to a tropical depression by 15:00 UTC on August 9 and degenerated to a remnant low six hours later.[102][103]
The outer fringes of the storm brought flooding to Colima. Landslides occurred along Lazaro Cardenas and Mexican Federal Highway 200.[104] In Manzanillo, a bridge collapsed and numerous federal highways were damaged while the city's port closed due to high waves.[105] Shortly after attaining tropical storm status, a "green" alert was issued for the multiplicity of Los Cabos.[106] Officials opened 18 shelters across the southern Baja California Peninsula, while also closing ports.[107] When Javier was forecast to become a hurricane, an "orange" alert was issued for the entire state of Baja California Sur.[108] In the municipalities of La Paz and Los Cabos, authorities delayed the start of the school year.[109] Six flights were canceled to and from San Jose del Cabo.[110] In Sonora, a "blue" alert was declared.[111]
Tropical Storm Kay
| Tropical storm (SSHWS) | |||
|---|---|---|---|
| |||
| Duration | August 18 – August 23 | ||
| Peak intensity | 50 mph (85 km/h) (1-min) 1000 mbar (hPa) | ||

Late on August 15, the NHC began highlighting an area south of Baja California for the potential for tropical cyclone development over the subsequent week.[112] A broad area of low pressure developed well south of Manzanillo, Mexico the following day,[113] steadily organizing to be deemed a tropical depression by 21:00 UTC on August 18.[114] Despite modest northeasterly shear, the depression intensified into Tropical Storm Kay twelve hours later on its northwesterly trek.[115] Continuing steadily west-northwest, wind shear never relaxed as predicted, resulting in only modest strengthening, though by August 21, Kay had attained peak intensity. Over the next two days, Kay moved into cooler water, resulting in a quick degradation of convection. By August 23, higher amounts of wind shear weakened Kay into a remnant low.
Hurricane Lester
| Category 4 hurricane (SSHWS) | |||
|---|---|---|---|
| |||
| Duration | August 24 – September 7 | ||
| Peak intensity | 140 mph (220 km/h) (1-min) 947 mbar (hPa) | ||

On August 24, a well organized low-pressure system was upgraded into Tropical Depression Thirteen-E. Entering a favorable environment, the depression quickly intensified into Tropical Storm Lester. Moving steadily west-northwestwards, intensification continued, and Lester rapidly intensified on August 26 into a hurricane. Intensification continued throughout the day, with Lester reaching Category 2 strength the following day. By August 29, Lester had strengthened into the fourth major hurricane of the season. On August 30, Lester started to go through a weakening stage, at which point the storm began accelerating towards Hawaii. Late on August 30 Lester re-intensified to a Category 4 hurricane. The storm did not maintain this intensity, however, and on the next day dropped below major hurricane status as its eye filled with clouds. On September 1 Lester cleared its eye and once again became a Category 3 hurricane. Lester also moved very close to the Hawaiian islands but passed safely to the east and quickly lost strength over cooler waters.
Hurricane Madeline
| Category 4 hurricane (SSHWS) | |||
|---|---|---|---|
| |||
| Duration | August 26 – September 3 | ||
| Peak intensity | 130 mph (215 km/h) (1-min) 950 mbar (hPa) | ||

On August 21, the NHC noted that an area of low pressure could form well south-southwest of the southern tip of Baja California over subsequent days.[116] An area of disturbed weather developed a few hours later,[117] slowly organizing into a tropical depression by 21:00 UTC on August 26.[118] With an impressive spiral band and improved inner core, the depression was upgraded to Tropical Storm Madeline six hours later.[119] Steered northwestward into the central Pacific, the cyclone initially struggled with moderate wind shear; however, an eye feature developed within the storm's central dense overcast by 09:00 UTC on August 29, prompting an upgrade to hurricane intensity.[120] Madeline began a period of rapid intensification thereafter, and with a cloud-filled eye surrounded by a ring of deep convection, was upgraded to a Category 3 hurricane by 21:00 UTC before ultimately peaking as a 130 mph (215 km/h) Category 4 hurricane early the next day.[121][122]
An upper-level trough responsible for the cyclone's northwest trajectory moved north of the Hawaiian Islands on August 30, causing a subtropical ridge to the north of the cyclone to build southward. As a result, Madeline turned west and then southwest.[122] Under increasing wind shear, Madeline's cloud pattern became less rounded and the storm's eye became obscured, signaling its fall below major hurricane intensity.[123] The continued effect of strong westerly shear weakened Madeline to a tropical storm by 00:00 UTC on September 1,[124] to a tropical depression six hours later,[125] and further to a remnant low by 21:00 UTC on September 2. Madeline brought just a few damage and flooding to the big island of Hawaii.[126]
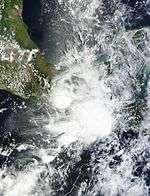
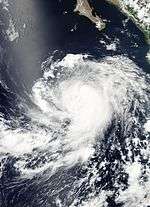
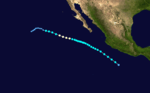
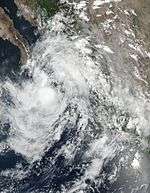
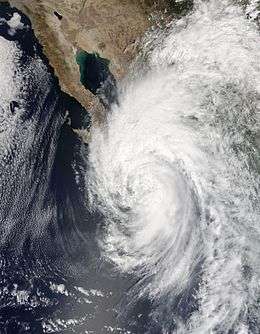
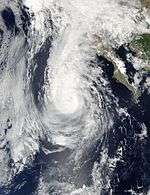
Hurricane Newton
| Category 1 hurricane (SSHWS) | |||
|---|---|---|---|
| |||
| Duration | September 4 – September 7 | ||
| Peak intensity | 90 mph (150 km/h) (1-min) 979 mbar (hPa) | ||
On August 27, the National Hurricane Center (NHC) first mentioned the potential for low pressure area to develop south of Mexico as an area for tropical cyclogenesis.[127] An area of disturbed weather formed on August 31 offshore western Guatemala,[128] which developed into a low-level trough the next day.[129] Favorable environmental conditions allowed the system to organize and develop a distinct low pressure area on September 2, which produced a widespread area of disorganized thunderstorms.[130] A circulation began organizing within the system,[131] leading to the NHC classifying it as Tropical Depression Fifteen-E late on September 4 about 220 mi (355 km) southwest of Manzanillo, Colima.[132]
With warm waters, moderate wind shear, and adequate moisture, the system continued to organize after formation,[132] strengthening to Tropical Storm Newton by early on September 5. The storm moved northwestward, steered by a ridge that over Texas.[133] Late on September 5, an eye was visible on satellite imagery, and the Hurricane Hunters observed flight-level winds of 85 mph (137 km/h); based on these observations, the NHC upgraded Newton to hurricane status.[134] With continued low wind shear and warm waters, Newton intensified further to a peak intensity of 90 mph (150 km/h) early on September 6.[135] That day, the large wind field and 52 mi (83 km) eye failed to organize more, and the hurricane made landfall near Cabo San Lucas, Baja California Sur, near peak intensity like Hurricane Odile did in 2014.[136]
Rounding the western periphery of the ridge, Newton turned northward and weakened over the Baja California Peninsula. The eyewall deteriorated and fell apart while the convection waned.[137] On September 7, Newton made a second landfall on mainland Mexico near Bahía Kino, Sonora, and weakened to tropical storm status. The storm curved to the northeast ahead of a broad trough,[138] with increasing wind shear exposing the center from the waning convection.[139] At 21:00 UTC on September 7, the NHC discontinued advisories on Newton, assessing that the storm degenerated into a post-tropical cyclone before crossing into southern Arizona.[140] The residual circulation continued northeastward,[141] dissipating by early on September 8.[142]
Hurricane Orlene
| Category 2 hurricane (SSHWS) | |||
|---|---|---|---|
| |||
| Duration | September 11 – September 17 | ||
| Peak intensity | 110 mph (175 km/h) (1-min) 967 mbar (hPa) | ||
Hurricane Paine
| Category 1 hurricane (SSHWS) | |||
|---|---|---|---|
| |||
| Duration | September 18 – September 21 | ||
| Peak intensity | 90 mph (150 km/h) (1-min) 977 mbar (hPa) | ||

Tropical Storm Roslyn
| Tropical storm (SSHWS) | |||
|---|---|---|---|
| |||
| Duration | September 25 – September 29 | ||
| Peak intensity | 50 mph (85 km/h) (1-min) 1000 mbar (hPa) | ||


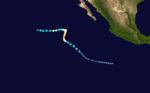
Hurricane Ulika
| Category 1 hurricane (SSHWS) | |||
|---|---|---|---|
| |||
| Duration | September 26 – September 30 | ||
| Peak intensity | 75 mph (120 km/h) (1-min) 992 mbar (hPa) | ||

On September 26, the NHC upgraded a long-tracked tropical wave into Tropical Depression Nineteen-E. Within hours of formation, the depression moved into the Central Pacific and was upgraded into Tropical Storm Ulika.[143] Ulika was upgraded into a Category 1 hurricane at 2:00 a.m. PDT (09:00 UTC) on September 28, making it the twelfth Pacific hurricane of the season.[144]
Hurricane Ulika is noted to be only one of two tropical cyclones to form in the Eastern Pacific basin, then move into the Central Pacific basin, and then back into the Eastern Pacific basin. The other known tropical cyclone to do this is Hurricane Olaf of the previous year. Ulika is also the first tropical cyclone on record to cross from the eastern to the central Pacific twice, as it crossed 140°W a total of three times. Also, Ulika is only the sixth storm to form in the Eastern Pacific, but not be named until entering the central Pacific. The others were 1984's Lala, 1992's Iniki, 1994's Li, 2009's Lana and 2015's Ela.
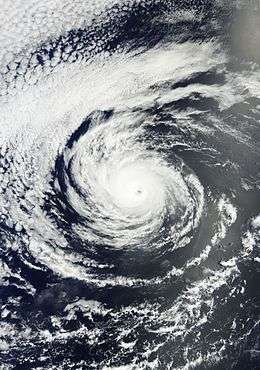
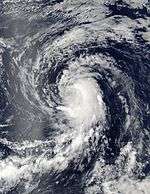
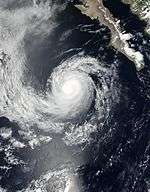
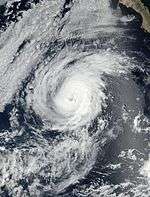
Hurricane Seymour
| Category 4 hurricane (SSHWS) | |||
|---|---|---|---|
| |||
| Duration | October 23 – October 28 | ||
| Peak intensity | 150 mph (240 km/h) (1-min) 943 mbar (hPa) | ||


On October 18, the NHC noted an area of disturbed weather was expected to form south of the Gulf of Tehuantepec over the coming days.[145] A surface began producing disorganized convection early the next morning,[146] and the disturbance organized into a tropical depression by 09:00 UTC on October 23 well south of Manzanillo, Mexico.[147] Steered steadily west-northwest, the depression intensified within an exceptionally conducive environment; it became Tropical Storm Seymour by 21:00 UTC that day,[148] strengthened into a hurricane by 15:00 UTC on October 24,[149] and attained major hurricane intensity by 09:00 UTC on October 25.[150] The storm's eye became more distinct within the organized central dense overcast by 21:00 UTC that day, and Seymour was upgraded to a Category 4 hurricane.[151] 24 hours later, Seymour began weakening rapidly and became a Category 1 hurricane on 09:00 UTC on October 27, due to increasing wind shear.
On October 27, some of the moisture from Seymour was absorbed by a storm system approaching the West Coast and it enhanced the rainfall there.
Tropical Storm Tina
| Tropical storm (SSHWS) | |||
|---|---|---|---|
| |||
| Duration | November 14 – November 15 | ||
| Peak intensity | 40 mph (65 km/h) (1-min) 1005 mbar (hPa) | ||


On November 8, a small disturbance formed off the coast of Mexico. For the next several days, the disturbance failed to organize due to strong wind shear as it began to turn to the north. As such, development was not expected. By late on November 13, however, the associated thunderstorms became very well organized near the center and satellite data revealed winds of up to tropical storm force, and early on November 14 at 02:00 UTC the disturbance was upgraded to Tropical Storm Tina.
Tropical Storm Otto
| Tropical storm (SSHWS) | |||
|---|---|---|---|
| |||
| Duration | November 25 (Entered basin) – November 26 | ||
| Peak intensity | 70 mph (110 km/h) (1-min) 990 mbar (hPa) | ||

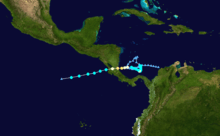
On November 25, Hurricane Otto crossed over from the Atlantic into the East Pacific. Due to highly unfavorable conditions, Otto dissipated on November 26.
Other storms
On August 11, the Japan Meteorological Agency (JMA) reported that a tropical depression had developed near the International Dateline about 2,000 km (1,245 mi) to the northwest of Honolulu, Hawaii.[152] Over the next day the system moved northwestwards and was last noted before it moved into the Western Pacific basin.[153] On September 12, the JMA had reported that another tropical depression had developed east of the International Dateline, while the CPHC assessed it as having a low chance of formation in the next 48 hours. On October 3, according to its best track, the JMA had started tracking a tropical depression to the east of the International Dateline. The system moved into the West Pacific, where it eventually became Typhoon Songda.[154] On October 15, the JMA started to track a tropical depression just east of the International Dateline, although six hours later the depression had moved into the West Pacific basin.
Storm names
The following names will be used for named storms that form in the northeastern Pacific Ocean during 2016. Retired names, if any, will be announced by the World Meteorological Organization in the spring of 2017. The names not retired from this list will be used again in the 2022 season.[155] This is the same list used in the 2010 season, except for the name Ivette, which replaced Isis after the rise of the terrorist group of the same name.[156] Therefore, the name Ivette was used for the first time this year.
|
|
|
Otto entered the northeastern Pacific basin from the Atlantic basin, retaining its name by having survived its passage over Central America as a tropical cyclone.
For storms that form in the Central Pacific Hurricane Center's area of responsibility, encompassing the area between 140 degrees west and the International Date Line, all names are used in a series of four rotating lists.[157] The next four names slated for use are shown below.
|
|
|
|
Season effects
This is a table of all the storms that have formed in the 2016 Pacific hurricane season. It includes their duration, names, landfall(s), denoted in parentheses, damages, and death totals. Deaths in parentheses are additional and indirect (an example of an indirect death would be a traffic accident), but were still related to that storm. Damage and deaths include totals while the storm was extratropical, a wave, or a low, and all the damage figures are in 2016 USD. Impacts in the Atlantic and western Pacific basins are excluded.
| Saffir–Simpson hurricane wind scale | ||||||
| TD | TS | C1 | C2 | C3 | C4 | C5 |
| Storm name |
Dates active | Storm category
at peak intensity |
Max 1-min wind mph (km/h) |
Min. press. (mbar) |
Areas affected | Damage (millions USD) |
Deaths | |||
|---|---|---|---|---|---|---|---|---|---|---|
| Pali | January 7 – 15 | Category 2 hurricane | 100 (155) | 977 | None | None | None | |||
| One-E | June 6 – 8 | Tropical depression | 35 (55) | 1006 | Southwestern Mexico | Minor | None | |||
| Agatha | July 2 – 5 | Tropical storm | 50 (85) | 1002 | None | None | None | |||
| Blas | July 3 – 10 | Category 4 hurricane | 140 (220) | 947 | Hawaii | None | None | |||
| Celia | July 6 – 16 | Category 2 hurricane | 100 (155) | 972 | Hawaii | None | None | |||
| Darby | July 11 – 26 | Category 3 hurricane | 120 (195) | 958 | Hawaii | Minor | None | |||
| Estelle | July 15 – 22 | Tropical storm | 70 (110) | 990 | None | None | None | |||
| Frank | July 21 – 28 | Category 1 hurricane | 85 (140) | 979 | Baja California Peninsula, Nayarit | None | None | |||
| Georgette | July 21 – 27 | Category 4 hurricane | 130 (215) | 952 | Hawaii | None | None | |||
| Howard | July 31 – August 3 | Tropical storm | 60 (95) | 999 | None | None | None | |||
| Ivette | August 2 – 8 | Tropical storm | 60 (95) | 1000 | None | None | None | |||
| Javier | August 7 – 9 | Tropical storm | 65 (100) | 998 | Western Mexico, Northwestern Mexico, Baja California Peninsula | Unknown | None | |||
| Kay | August 18 – 23 | Tropical storm | 50 (85) | 1000 | None | None | None | |||
| Lester | August 24 – September 7 | Category 4 hurricane | 140 (220) | 947 | Hawaii | None | None | |||
| Madeline | August 26 – September 3 | Category 4 hurricane | 130 (215) | 950 | Hawaii | Minor | None | |||
| Newton | September 4 – 7 | Category 1 hurricane | 90 (150) | 979 | Baja California Peninsula, Northwestern Mexico, Southwestern United States | 96 | 9 | |||
| Orlene | September 11 – 17 | Category 2 hurricane | 110 (175) | 967 | None | None | None | |||
| Paine | September 18 – 21 | Category 1 hurricane | 90 (150) | 977 | Baja California Peninsula, Southwestern United States | Unknown | None | |||
| Roslyn | September 25 – 29 | Tropical storm | 50 (85) | 1000 | None | None | None | |||
| Ulika | September 26 – 30 | Category 1 hurricane | 75 (120) | 992 | None | None | None | |||
| Seymour | October 23 – 28 | Category 4 hurricane | 150 (240) | 943 | California | None | None | |||
| Tina | November 14 – 15 | Tropical storm | 40 (65) | 1005 | Western Mexico | None | None | |||
| Otto | November 25 – 26 | Tropical storm | 70 (110) | 990 | None (after crossover) | None | None | |||
| Season Aggregates | ||||||||||
| 23 cyclones | January 7 – November 26 | 150 (240) | 943 | 96 | 9 | |||||
See also
- List of Pacific hurricanes
- List of Pacific hurricane seasons
- 2016 Atlantic hurricane season
- 2016 Pacific typhoon season
- 2016 North Indian Ocean cyclone season
- South-West Indian Ocean cyclone seasons: 2015–16, 2016–17
- Australian region cyclone seasons: 2015–16, 2016–17
- South Pacific cyclone seasons: 2015–16, 2016–17
- South Atlantic tropical cyclone
Notes
- ↑ The totals represent the sum of the squares for every (sub)tropical storm's intensity of over 33 knots (38 mph, 61 km/h), divided by 10,000. Calculations are provided at Talk:2016 Pacific hurricane season/ACE calcs.
References
- ↑ Dorst Neal. When is hurricane season? (Report). Atlantic Oceanographic and Meteorological Laboratory. Archived from the original on 6 December 2010. Retrieved November 25, 2010.
- ↑ "Hurricane Pali Recap, Earliest Central Pacific Hurricane on Record". Retrieved 1 September 2016.
- ↑ "Background Information: East Pacific Hurricane Season". Climate Prediction Center. College Park, Maryland: National Oceanic and Atmospheric Administration. May 22, 2014. Retrieved May 29, 2014.
- 1 2 National Hurricane Center; Hurricane Research Division; Central Pacific Hurricane Center. "The Northeast and North Central Pacific hurricane database 1949–2015". United States National Oceanic and Atmospheric Administration's National Weather Service. A guide on how to read the database is available here.
- ↑ http://smn.cna.gob.mx/tools/DATA/Ciclones%20Tropicales/Proyecci%C3%B3n/2016.pdf
- ↑ "Near-normal Atlantic hurricane season is most likely this year - National Oceanic and Atmospheric Administration". Retrieved 1 September 2016.
- ↑ Bob Henson (January 7, 2016). "Rare January Depression in Central Pacific; Atlantic Subtropical Storm Next Week?". Weather Underground. Retrieved January 9, 2016.
- ↑ Bob Henson (January 8, 2016). "Warm, Wet Year for U.S.; Record Heat in South Africa; Tropical Storm Pali Intensifies". Weather Underground. Retrieved January 9, 2016.
- ↑ "Hurricane Pali Discussion Number 19". 12 January 2016.
- ↑ Erdman, John. "Tropical Depression Nine-C Dissipates; Caps Off a Record Central Pacific Hurricane Season". The Weather Channel. The Weather Channel. Retrieved 6 January 2016.
- ↑ Ballard, R. "TROPICAL DEPRESSION PALI DISCUSSION NUMBER 30". National Weather Service. Central Pacific Hurricane Center. Retrieved 14 January 2016.
- ↑ HURRICANE PALI ADVISORY NUMBER 22
- ↑ REMNANTS OF PALI ADVISORY NUMBER 31
- ↑ Jeff Masters (January 13, 2016). "Unprecedented: Simultaneous January Named Storms in the Atlantic and Central Pacific". Weather Underground. Retrieved January 14, 2016.
- ↑ "NHC Graphical Outlook Archive". Retrieved 1 September 2016.
- ↑ "NHC Graphical Outlook Archive". Retrieved 1 September 2016.
- ↑ "NHC Graphical Outlook Archive". Retrieved 1 September 2016.
- ↑ "Tropical Depression ONE-E". Retrieved 1 September 2016.
- ↑ "Tropical Depression ONE-E". Retrieved 1 September 2016.
- ↑ http://www.nhc.noaa.gov/text/refresh/MIATCPEP1+shtml/081434.shtml?
- ↑ Tuxtla Gutiérrez (June 9, 2016). "Sin daños ni pérdidas humanas por depresión tropical en Chiapas" (in Spanish). Uno TV. Notimex. Retrieved June 16, 2016.
- ↑ "Depresión tropical 1-E provoca daños menores en Oaxaca" (in Spanish). Noticias MVS. Notimex. June 8, 2016. Retrieved June 16, 2016.
- ↑ Robbie J. Berg; Michael J. Brennan (July 1, 2016). "NHC Graphical Outlook Archive". National Hurricane Center. Retrieved July 2, 2016.
- 1 2 Jack L. Beven (July 2, 2016). "Tropical Storm Agatha Discussion Number 3". National Hurricane Center. Retrieved July 2, 2016.
- ↑ Stacy R. Stewart (July 3, 2016). "Tropical Storm Agatha Discussion Number 6". National Hurricane Center. Retrieved July 5, 2016.
- ↑ Daniel Brown (July 4, 2016). "Tropical Storm Agatha Discussion Number 13". National Hurricane Center. Retrieved July 5, 2016.
- ↑ Stacy R. Stewart (June 27, 2016). "Tropical Weather Outlook 1100 am PDT Mon Jun 27 2016". Miami, Florida: National Hurricane Center. Retrieved July 5, 2016.
- ↑ Stacy R. Stewart (June 30, 2016). "Tropical Weather Outlook 1100 am PDT Thu Jun 30 2016". Miami, Florida: National Hurricane Center. Retrieved July 5, 2016.
- ↑ Michael J. Brennan (July 3, 2016). "Tropical Depression Three-E Discussion Number 1". Miami, Florida: National Hurricane Center. Retrieved July 5, 2016.
- ↑ Stacy R. Stewart (July 3, 2016). "Tropical Storm Blas Discussion Number 2". Miami, Florida: National Hurricane Center. Retrieved July 5, 2016.
- ↑ Todd B. Kimberlain (July 4, 2016). "Hurricane Blas Discussion Number 7". Miami, Florida: National Hurricane Center. Retrieved July 5, 2016.
- ↑ Todd B. Kimberlain (July 4, 2016). "Hurricane Blas Discussion Number 8". Miami, Florida: National Hurricane Center. Retrieved July 5, 2016.
- ↑ Stacy R. Stewart (July 5, 2016). "Hurricane Blas Discussion Number 12". Miami, Florida: National Hurricane Center. Retrieved July 5, 2016.
- ↑ Cangialosi, John (July 6, 2016). "Hurricane Blas Discussion Number 13". Miami, Florida: National Hurricane Center. Retrieved July 10, 2016.
- ↑ Daniel P. Brown (July 6, 2016). "Hurricane Blas Discussion Number 15". Miami, Florida: National Hurricane Center. Retrieved July 10, 2016.
- ↑ David P. Roberts (July 7, 2016). "Hurricane Blas Discussion Number 21". Miami, Florida: National Hurricane Center. Retrieved July 16, 2016.
- ↑ Daniel P. Brown (July 8, 2016). "Hurricane Blas Discussion Number 24". Miami, Florida: National Hurricane Center. Retrieved July 16, 2016.
- ↑ Michael J. Brennan (July 9, 2016). "Tropical Storm Blas Discussion Number 26". Miami, Florida: National Hurricane Center. Retrieved July 16, 2016.
- ↑ John P. Cangialosi (July 9, 2016). "Tropical Storm Blas Discussion Number 27". Miami, Florida: National Hurricane Center. Retrieved July 16, 2016.
- ↑ Michael J. Brennan (July 10, 2016). "Tropical Depression Blas Discussion Number 30". Miami, Florida: National Hurricane Center. Retrieved July 16, 2016.
- ↑ John P. Cangialosi (July 10, 2016). "Post-Tropical Cyclone Blas Discussion Number 31". Miami, Florida: National Hurricane Center. Retrieved July 16, 2016.
- ↑ Dudley, Malika (July 15, 2016). "Increased Windward Showers From Remnants of Blas". mauinow.com. Retrieved July 16, 2016.
- 1 2 3 National Weather Service in Honolulu, Hawaii (August 4, 2016). July 2016 Precipitation Summary. National Oceanic and Atmospheric Administration (Report). National Weather Service. Retrieved August 7, 2016.
- ↑ Stacy R. Stewart (June 27, 2016). "Tropical Weather Outlook". National Hurricane Center. Retrieved August 10, 2016.
- ↑ John L. Beven II (July 6, 2016). Tropical Depression Four-E Public Advisory Number 1 (Report). National Hurricane Center. Retrieved August 10, 2016.
- ↑ Lixion A. Avila (July 8, 2016). Tropical Depression Four-E Discussion Number 6 (Report). National Hurricane Center. Retrieved August 10, 2016.
- ↑ John L. Beven II (July 8, 2016). Tropical Storm Celia Discussion Number 8 (Report). National Hurricane Center. Retrieved August 10, 2016.
- ↑ Stacy R. Stewart (July 10, 2016). Hurricane Celia Discussion Number 17 (Report). National Hurricane Center. Retrieved August 10, 2016.
- ↑ Stacy R. Stewart (July 11, 2016). Hurricane Celia Discussion Number 21 (Report). National Hurricane Center. Retrieved August 10, 2016.
- ↑ John L. Beven II (July 13, 2016). Tropical Storm Celia Discussion Number 27 (Report). National Hurricane Center. Retrieved August 10, 2016.
- ↑ Bob Burke (July 15, 2016). Tropical Storm Celia Public Advisory Number 37 (Report). Central Pacific Hurricane Center. Retrieved August 10, 2016.
- ↑ Bob Burke (July 16, 2016). Post-Tropical Cyclone Celia Public Advisory Number 38 (Report). Central Pacific Hurricane Center. Retrieved August 10, 2016.
- ↑ "NHC Graphical Outlook Archive". nhc.noaa.gov. National Hurricane Center. July 14, 2016. Retrieved August 23, 2016.
- ↑ "National Hurricane Center-TROPICAL DEPRESSION FIVE-E ADVISORY NUMBER 1". Retrieved July 16, 2016.
- ↑ "Hurricane DARBY Advisory Archive".
- ↑ "Hawaii News Now-Big Island, Maui, Oahu under Tropical Storm Warning; watch issued for Kauai". Retrieved 23 July 2016.
- ↑ "Central Pacific Hurricane Center-TROPICAL STORM DARBY DISCUSSION NUMBER 50". Retrieved 24 July 2016.
- ↑ "NHC Graphical Outlook Archive". Retrieved 1 September 2016.
- ↑ "National Hurricane Center-TROPICAL DEPRESSION SIX-E ADVISORY NUMBER 1". Retrieved 23 July 2016.
- ↑ "National Hurricane Center-TROPICAL STORM ESTELLE ADVISORY NUMBER 3". Retrieved 23 July 2016.
- ↑ "National Hurricane Center-TROPICAL STORM ESTELLE ADVISORY NUMBER 13". Retrieved 23 July 2016.
- ↑ "National Hurricane Center-TROPICAL STORM ESTELLE ADVISORY NUMBER 18". Retrieved 23 July 2016.
- ↑ "National Hurricane Center-POST-TROPICAL CYCLONE ESTELLE ADVISORY NUMBER 29". Retrieved 23 July 2016.
- ↑ Eric S. Blake (July 16, 2016). "Tropical Weather Outlook". National Hurricane Center. Retrieved September 5, 2016.
- ↑ Eric S. Blake (July 19, 2016). "Tropical Weather Outlook". National Hurricane Center. Retrieved September 5, 2016.
- ↑ Robbie J. Berg (July 21, 2016). Tropical Storm Frank Public Advisory Number 1 (Report). National Hurricane Center. Retrieved September 5, 2016.
- ↑ Richard J. Pasch (July 25, 2016). Tropical Storm Frank Discussion Number 15 (Report). National Hurricane Center. Retrieved September 5, 2016.
- ↑ Eric S. Blake (July 26, 2016). Hurricane Frank Discussion Number 20 (Report). National Hurricane Center. Retrieved September 5, 2016.
- ↑ Lixion A. Avila (July 26, 2016). Hurricane Frank Public Advisory Number 22 (Report). National Hurricane Center. Retrieved September 5, 2016.
- ↑ Eric S. Blake (July 27, 2016). Tropical Storm Frank Public Advisory Number 24 (Report). National Hurricane Center. Retrieved September 5, 2016.
- ↑ Stacy R. Stewart (July 28, 2016). Tropical Depression Frank Public Advisory Number 28 (Report). National Hurricane Center. Retrieved September 5, 2016.
- ↑ Stacy R. Stewart (July 28, 2016). Post-Tropical Cyclone Frank Public Advisory Number 29 (Report). National Hurricane Center. Retrieved September 5, 2016.
- ↑ "Tormenta 'Frank' causa inundaciones en Nayarit". Excelsior (in Spanish). July 23, 2016. Retrieved August 9, 2016.
- ↑ "Tormenta Frank provoca inundaciones en Nayarit". Grupo Milenio (in Spanish). July 24, 2016. Retrieved August 9, 2016.
- ↑ Daniel P. Brown (July 15, 2016). "Tropical Weather Outlook". National Hurricane Center. Retrieved August 8, 2016.
- ↑ Robbie J. Berg (July 16, 2016). "Tropical Weather Outlook". National Hurricane Center. Retrieved August 8, 2016.
- ↑ Michael J. Brennan (July 21, 2016). Tropical Depression Eight-E Public Advisory Number 1 (Report). National Hurricane Center. Retrieved August 8, 2016.
- ↑ Michael J. Brennan (July 22, 2016). Tropical Storm Georgette Discussion Number 4 (Report). National Hurricane Center. Retrieved August 8, 2016.
- ↑ Christopher W. Landsea (July 24, 2016). Hurricane Georgette Public Advisory Number 10 (Report). National Hurricane Center. Retrieved August 8, 2016.
- ↑ John P. Cangialosi (July 25, 2016). Hurricane Georgette Discussion Number 14 (Report). National Hurricane Center. Retrieved August 8, 2016.
- ↑ John L. Beven II (July 26, 2016). Tropical Storm Georgette Public Advisory Number 20 (Report). National Hurricane Center. Retrieved August 8, 2016.
- ↑ John L. Beven II (July 27, 2016). Post-Tropical Cyclone Georgette Public Advisory Number 24 (Report). National Hurricane Center. Retrieved August 8, 2016.
- ↑ John P. Cangialosi (July 29, 2016). "Tropical Weather Outlook". National Hurricane Center. Retrieved August 8, 2016.
- ↑ Michael J. Brennan (July 31, 2016). "Tropical Weather Outlook". National Hurricane Center. Retrieved August 8, 2016.
- ↑ Michael J. Brennan (July 31, 2016). Tropical Depression Nine-E Discussion Number 1 (Report). National Hurricane Center. Retrieved July 8, 2016.
- ↑ Stacy R. Stewart (August 1, 2016). Tropical Storm Howard Public Advisory Number 4 (Report). National Hurricane Center. Retrieved August 8, 2016.
- ↑ Stacy R. Stewart (August 2, 2016). Tropical Storm Howard Discussion Number 8 (Report). National Hurricane Center. Retrieved August 8, 2016.
- ↑ Stacy R. Stewart (August 3, 2016). Post-Tropical Cyclone Howard Discussion Number 14 (Report). National Hurricane Center. Retrieved August 8, 2016.
- ↑ Eric S. Blake (July 25, 2016). "Tropical Weather Outlook". National Hurricane Center. Retrieved August 8, 2016.
- ↑ Eric S. Blake (July 27, 2016). "Tropical Weather Outlook". National Hurricane Center. Retrieved August 8, 2016.
- ↑ Eric S. Blake (August 2, 2016). Tropical Depression Ten-E Public Advisory Number 1 (Report). National Hurricane Center. Retrieved August 8, 2016.
- 1 2 Daniel P. Brown (August 3, 2016). Tropical Storm Ivette Discussion Number 3 (Report). National Hurricane Center. Retrieved August 8, 2016.
- ↑ John L. Beven II (August 6, 2016). Tropical Storm Ivette Public Advisory Number 15 (Report). National Hurricane Center. Retrieved August 8, 2016.
- ↑ John P. Cangialosi (August 7, 2016). Tropical Depression Ivette Public Advisory Number 22 (Report). National Hurricane Center. Retrieved August 8, 2016.
- ↑ Tom Birchard (August 8, 2016). Post-Tropical Cyclone Ivette Public Advisory Number 25 (Report). Central Pacific Hurricane Center. Retrieved August 8, 2016.
- ↑ Daniel P. Brown (August 2, 2016). "Tropical Weather Outlook". National Hurricane Center. Retrieved August 8, 2016.
- ↑ Robbie J. Berg (August 4, 2016). "Tropical Weather Outlook". National Hurricane Center. Retrieved August 8, 2016.
- ↑ Daniel P. Brown (August 7, 2016). Tropical Depression Eleven-E Public Advisory Number 1 (Report). National Hurricane Center. Retrieved August 8, 2016.
- ↑ Todd B. Kimberlain; Richard J. Pasch (August 7, 2016). Tropical Storm Javier Tropical Cyclone Update (Report). National Hurricane Center. Retrieved August 8, 2016.
- ↑ Richard J. Pasch (August 7, 2016). Tropical Storm Javier Discussion Number 3 (Report). National Hurricane Center. Retrieved August 9, 2016.
- ↑ Richard J. Pasch (August 8, 2016). Tropical Storm Javier Discussion Number 7 (Report). National Hurricane Center. Retrieved August 9, 2016.
- ↑ Richard J. Pasch (August 9, 2016). Tropical Depression Javier Public Advisory Number 10 (Report). National Hurricane Center. Retrieved August 9, 2016.
- ↑ Richard J. Pasch (August 9, 2016). Post-Tropical Cyclone Javier Public Advisory Number 11 (Report). National Hurricane Center. Retrieved August 9, 2016.
- ↑ "Deja tomenta Javier daños a carreteras e infraestructura de Colima". Terra. August 8, 2016. Retrieved August 9, 2016.
- ↑ "Tormenta 'Javier' provoca inundaciones y daños en carreteras de Colima". El Financiero (in Spanish). August 8, 2016. Retrieved August 9, 2016.
- ↑ "Activan alerta preventiva por "Javier" en Baja California Sur". El Universal (in Spanish). August 7, 2016. Retrieved August 9, 2016.
- ↑ "Mexico hunts for missing after landslides kill 45". ReliefWeb. Agence France-Presse. August 8, 2016. Retrieved August 10, 2016.
- ↑ "Emiten alerta naranja en BCS por tormenta tropical "Javier"". El Universal (in Spanish). August 8, 2016. Retrieved August 9, 2016.
- ↑ "Fuertes lluvias se mantienen en BCS por "Javier" habilitan 19 albergues". El Universal (in Spanish). August 8, 2016. Retrieved August 9, 2016.
- ↑ "Volaris cancela vuelos por tormenta Javier". El Universal (in Spanish). August 8, 2016. Retrieved August 9, 2016.
- ↑ "Sonora emite la alerta azul por la tormenta "Javier"". El Universal (in Spanish). August 8, 2016. Retrieved August 9, 2016.
- ↑ Daniel P. Brown (August 15, 2016). "Tropical Weather Outlook". National Hurricane Center. Retrieved August 19, 2016.
- ↑ Stacy R. Stewart (August 16, 2016). "Tropical Weather Outlook". National Hurricane Center. Retrieved August 19, 2016.
- ↑ David P. Roberts (August 18, 2016). Tropical Depression Twelve-E Public Advisory Number 1 (Report). National Hurricane Center. Retrieved August 19, 2016.
- ↑ Lixion A. Avila (August 19, 2016). Tropical Storm Kay Discussion Number 3 (Report). National Hurricane Center. Retrieved August 19, 2016.
- ↑ Richard J. Pasch (July 21, 2016). "Tropical Weather Outlook". National Hurricane Center. Retrieved September 5, 2016.
- ↑ John P. Cangialosi (July 21, 2016). "Tropical Weather Outlook". National Hurricane Center. Retrieved September 5, 2016.
- ↑ Michael J. Brennan (August 26, 2016). Tropical Depression Fourteen-E Public Advisory Number 1 (Report). National Hurricane Center. Retrieved September 5, 2016.
- ↑ Eric S. Blake (August 26, 2016). Tropical Storm Madeline Discussion Number 2 (Report). National Hurricane Center. Retrieved September 5, 2016.
- ↑ Jeff Powell (August 29, 2016). Hurricane Madeline Discussion Number 11 (Report). Central Pacific Hurricane Center. Retrieved September 5, 2016.
- ↑ Tom Birchard (August 29, 2016). Hurricane Madeline Discussion Number 13 (Report). Central Pacific Hurricane Center. Retrieved September 5, 2016.
- 1 2 Jeff Powell (August 30, 2016). Hurricane Madeline Discussion Number 15 (Report). Central Pacific Hurricane Center. Retrieved September 5, 2016.
- ↑ Derek Wroe (August 30, 2016). Hurricane Madeline Discussion Number 18 (Report). Central Pacific Hurricane Center. Retrieved September 5, 2016.
- ↑ Derek Wroe (August 31, 2016). Tropical Storm Madeline Intermediate Advisory Number 22A (Report). Central Pacific Hurricane Center. Retrieved September 5, 2016.
- ↑ Jon Jelsema; Robert Ballard (August 31, 2016). Tropical Depression Madeline Public Advisory Number 28 (Report). Central Pacific Hurricane Center. Retrieved September 5, 2016.
- ↑ Kevin Kodama (September 2, 2016). Post-Tropical Cyclone Madeline Public Advisory Number 30 (Report). Central Pacific Hurricane Center. Retrieved September 5, 2016.
- ↑ Eric Blake (August 27, 2016). Tropical Weather Outlook (TXT) (Report). National Hurricane Center. Retrieved September 6, 2016.
- ↑ Eric Blake (August 31, 2016). Tropical Weather Outlook (TXT) (Report). National Hurricane Center. Retrieved September 6, 2016.
- ↑ Eric Blake (September 1, 2016). Tropical Weather Outlook (TXT) (Report). National Hurricane Center. Retrieved September 6, 2016.
- ↑ Eric Blake (September 2, 2016). Tropical Weather Outlook (TXT) (Report). National Hurricane Center. Retrieved September 6, 2016.
- ↑ Robbie Berg (September 3, 2016). Tropical Weather Outlook (TXT) (Report). National Hurricane Center. Retrieved September 6, 2016.
- 1 2 John Cangialosi (September 4, 2016). Tropical Depression Fifteen-E Discussion Number 1 (Report). National Hurricane Center. Retrieved September 6, 2016.
- ↑ Robbie Berg (September 5, 2016). Tropical Storm Newton Discussion Number 2 (Report). National Hurricane Center. Retrieved September 6, 2016.
- ↑ Eric Blake (September 5, 2016). Hurricane Newton Discussion Number 5 (Report). National Hurricane Center. Retrieved September 6, 2016.
- ↑ Daniel Brown (September 6, 2016). Hurricane Newton Discussion Number 6 (Report). National Hurricane Center. Retrieved September 6, 2016.
- ↑ Stacy Stewart (September 6, 2016). Hurricane Newton Discussion Number 7 (Report). National Hurricane Center. Retrieved September 6, 2016.
- ↑ Todd Kimberlain (September 6, 2016). Hurricane Newton Discussion Number 8 (Report). National Hurricane Center. Retrieved September 6, 2016.
- ↑ Richard Pasch (September 7, 2016). Tropical Storm Newton Discussion Number 11 (Report). National Hurricane Center. Retrieved September 8, 2016.
- ↑ Robbie Berg (September 7, 2016). Tropical Storm Newton Discussion Number 12 (Report). National Hurricane Center. Retrieved September 8, 2016.
- ↑ Robbie Berg (September 7, 2016). Tropical Storm Newton Discussion Number 13 (Report). National Hurricane Center. Retrieved September 8, 2016.
- ↑ Allison Santorelli (September 7, 2016). Post-Tropical Cyclone Newton Advisory Number 14 (Report). Weather Prediction Center. Retrieved September 8, 2016.
- ↑ Allison Santorelli (September 8, 2016). Post-Tropical Cyclone Newton Advisory Number 15 (Report). Weather Prediction Center. Retrieved September 8, 2016.
- ↑ Jelsema, Jon. "TROPICAL STORM ULIKA ADVISORY NUMBER 4". Retrieved 2016-10-09.
- ↑ Berg, Robbie. "HURRICANE ULIKA ADVISORY NUMBER 8". Retrieved 2016-10-09.
- ↑ Eric S. Blake (October 18, 2016). "Tropical Weather Outlook". National Hurricane Center. Retrieved October 25, 2016.
- ↑ Eric S. Blake (October 19, 2016). "Tropical Weather Outlook". National Hurricane Center. Retrieved October 25, 2016.
- ↑ Daniel P. Brown (October 23, 2016). Tropical Depression Twenty-E Public Advisory Number 1 (Report). National Hurricane Center. Retrieved October 25, 2016.
- ↑ John P. Cangialosi (October 23, 2016). Tropical Storm Seymour Discussion Number 3 (Report). National Hurricane Center. Retrieved October 25, 2016.
- ↑ Todd B. Kimberlain (October 24, 2016). Hurricane Seymour Public Advisory Number 6 (Report). National Hurricane Center. Retrieved October 25, 2016.
- ↑ Daniel P. Brown (October 25, 2016). Hurricane Seymour Public Advisory Number 9 (Report). National Hurricane Center. Retrieved October 25, 2016.
- ↑ John L. Beven II (October 25, 2016). Hurricane Seymour Discussion Number 11 (Report). National Hurricane Center. Retrieved October 25, 2016.
- ↑ "JMA WWJP25 Warning and Summary August 11, 2016 12z". Japan Meteorological Agency. August 11, 2016. Archived from the original on August 12, 2016. Retrieved August 12, 2016.
- ↑ "JMA WWJP25 Warning and Summary August 12, 2016 00z". Japan Meteorological Agency. August 11, 2016. Archived from the original on August 12, 2016. Retrieved August 12, 2016.
- ↑ "RSMC Tropical Cyclone Best Track 1620 SONGDA (1620)". Japan Meteorological Agency. November 22, 2016.
- ↑ "Tropical Cyclone Names". National Hurricane Center. National Oceanic and Atmospheric Administration. 2013-04-11. Archived from the original on May 8, 2013. Retrieved May 8, 2013.
- ↑ "'Isis' among names removed from UN list of hurricane names". Reuters. April 17, 2015. Retrieved January 7, 2016.
- ↑ "Pacific Tropical Cyclone Names" (PHP). Central Pacific Hurricane Center. National Oceanic and Atmospheric Administration. April 11, 2013. Archived from the original on May 8, 2013. Retrieved May 8, 2013.
External links
| Wikimedia Commons has media related to 2016 Pacific hurricane season. |
- National Hurricane Center Website
- National Hurricane Center's Eastern Pacific Tropical Weather Outlook
- Central Pacific Hurricane Center
- Servicio Meteorológico Nacional Website (Spanish)
Tropical cyclones of the 2016 Pacific hurricane season | ||
|---|---|---|
| ||
| ||