Winnipeg South Centre
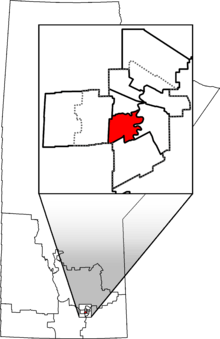 Winnipeg South Centre in relation to other Manitoba federal electoral districts as of the 2013 Representation Order. Dotted line shows Winnipeg city limits. | |||
| Federal electoral district | |||
| Legislature | House of Commons | ||
| MP |
| ||
| District created | 1987 | ||
| First contested | 1988 | ||
| Last contested | 2015 | ||
| District webpage | profile, map | ||
| Demographics | |||
| Population (2011)[1] | 90,711 | ||
| Electors (2015) | 67,988 | ||
| Area (km²)[2] | 46 | ||
| Pop. density (per km²) | 1,972 | ||
| Census divisions | Winnipeg | ||
| Census subdivisions | Winnipeg | ||
Winnipeg South Centre (French: Winnipeg-Centre-Sud) is a federal electoral district in Manitoba, Canada, that has been represented in the Canadian House of Commons from 1925 to 1979 and since 1988.
Geography
The district includes the neighbourhoods of Tuxedo, Linden woods, Sir John Franklin, River Heights, Osborne Village, Crescentwood, Earl Grey, Rockwood, Grant Park, Riverview, Lord Roberts, Beaumont, Wildwood, Fort Garry, Maybank, and the western half of the Pembina Strip in the city of Winnipeg.
History
The electoral district was originally created in 1924 from Winnipeg South and Winnipeg Centre ridings. It generally consisted of the part of the city west of the Red River and north of the Assiniboine River. In 1952, it gained parts the Rural Municipality (and later city) of St. James. In 1966, it gained parts the municipalities of Assiniboia, and Charleswood, and the Town of Tuxedo.
In 1976, it was abolished with part transferred to Selkirk—Interlake, Winnipeg—Assiniboine, Winnipeg—St. James and Winnipeg North Centre ridings.
The electoral district was re-created in 1987 from Winnipeg North Centre, Winnipeg—Assiniboine and Winnipeg—Fort Garry ridings.
The district's boundaries were redistributed in 1996 and 2004.
This riding gained territory from Winnipeg South during the 2012 electoral redistribution.
Members of Parliament
This riding has elected the following Members of Parliament:
Current Member of Parliament
Jim Carr was elected to the House of Commons in the 2015 General Election.
Election results
1988–present
| Canadian federal election, 2015 | ||||||||
|---|---|---|---|---|---|---|---|---|
| Party | Candidate | Votes | % | ∆% | Expenditures | |||
| Liberal | Jim Carr | 31,993 | 59.72 | +23.13 | $140,828.10 | |||
| Conservative | Joyce Bateman | 15,102 | 28.19 | -12.96 | $94,644.32 | |||
| New Democratic | Matt Henderson | 4,799 | 8.96 | -9.39 | $29,074.48 | |||
| Green | Andrew Park | 1,677 | 3.13 | -0.09 | $26,901.85 | |||
| Total valid votes/Expense limit | 53,571 | 100.00 | $201,744.96 | |||||
| Total rejected ballots | 188 | 0.35 | – | |||||
| Turnout | 53,759 | 77.02 | – | |||||
| Eligible voters | 69,799 | |||||||
| Liberal gain from Conservative | Swing | +18.05 | ||||||
| Source: Elections Canada[3][4][5] | ||||||||
| 2011 federal election redistributed results[6] | |||
|---|---|---|---|
| Party | Vote | % | |
| Conservative | 19,185 | 41.15 | |
| Liberal | 17,057 | 36.59 | |
| New Democratic | 8,554 | 18.35 | |
| Green | 1,502 | 3.22 | |
| Others | 321 | 0.69 | |
| Canadian federal election, 2011 | ||||||||
|---|---|---|---|---|---|---|---|---|
| Party | Candidate | Votes | % | ∆% | Expenditures | |||
| Conservative | Joyce Bateman | 15,506 | 38.82 | +2.56 | $72,590.37 | |||
| Liberal | Anita Neville | 14,784 | 37.02 | -5.24 | $79,128.33 | |||
| New Democratic | Dennis Lewycky | 7,945 | 19.89 | +5.78 | $15,656.19 | |||
| Green | Joshua McNeil | 1,383 | 3.46 | -3.89 | $1,586.80 | |||
| Independent | Matt Henderson | 218 | 0.55 | – | $129.79 | |||
| Independent | Lyndon B. Froese | 103 | 0.26 | – | $0.00 | |||
| Total valid votes/Expense limit | 39,939 | 100.00 | – | |||||
| Total rejected ballots | 154 | 0.38 | -0.01 | |||||
| Turnout | 40,093 | 70.80 | +5.12 | |||||
| Eligible voters | 56,628 | – | – | |||||
| Canadian federal election, 2008 | ||||||||
|---|---|---|---|---|---|---|---|---|
| Party | Candidate | Votes | % | ∆% | Expenditures | |||
| Liberal | Anita Neville | 16,438 | 42.26 | +3.02 | $74,911 | |||
| Conservative | Trevor Kennerd | 14,103 | 36.26 | +4.77 | $74,675 | |||
| New Democratic | Rachel Heinrichs | 5,490 | 14.11 | -7.69 | $10,465 | |||
| Green | Vere Scott | 2,860 | 7.35 | +2.90 | $1,774 | |||
| Total valid votes/Expense limit | 38,891 | 100.00 | $77,552 | |||||
| Total rejected ballots | 151 | 0.39 | ||||||
| Turnout | 39,042 | 65.68 | ||||||
| Canadian federal election, 2006 | ||||||||
|---|---|---|---|---|---|---|---|---|
| Party | Candidate | Votes | % | ∆% | Expenditures | |||
| Liberal | Anita Neville | 16,296 | 39.24 | -7.4 | $71,377 | |||
| Conservative | Michael Richards | 13,077 | 31.49 | +4.5 | $72,385 | |||
| New Democratic | Mark Wasyliw | 9,055 | 21.80 | +0.6 | $19,492 | |||
| Green | Vere H. Scott | 1,848 | 4.45 | +0.6 | $1,237 | |||
| Progressive Canadian | Dale Swirsky | 934 | 2.24 | – | $11,137 | |||
| Independent | Jeffrey Anderson | 246 | 0.59 | – | $3,204 | |||
| Canadian Action | Magnus Thompson | 66 | 0.15 | -0.1 | $2,750 | |||
| Total valid votes | 41,522 | 100.00 | – | |||||
| Total rejected ballots | 150 | 0.36 | 0.0 | |||||
| Turnout | 41,672 | 69.49 | +6.9 | |||||
| Canadian federal election, 2004 | ||||||||
|---|---|---|---|---|---|---|---|---|
| Party | Candidate | Votes | % | ∆% | Expenditures | |||
| Liberal | Anita Neville | 18,133 | 46.6 | +6.1 | $70,382 | |||
| Conservative | Raj Joshi | 10,516 | 27.0 | +7.2 | $62,453 | |||
| New Democratic | James Allum | 8,270 | 21.3 | +1.3 | $29,392 | |||
| Green | Ian Scott | 1,508 | 3.9 | – | $1,030 | |||
| Marijuana | Andy Caisse | 293 | 0.8 | -1.0 | – | |||
| Canadian Action | Magnus Thompson | 114 | 0.3 | -0.2 | $1,617 | |||
| Communist | Andrew Dalgliesh | 81 | 0.2 | -0.3 | $654 | |||
| Total valid votes | 38,915 | 100.0 | – | |||||
| Total rejected ballots | 139 | 0.4 | ||||||
| Turnout | 39,054 | 62.6 | ||||||
Note: Conservative vote is compared to the total of the Canadian Alliance vote and Progressive Conservative vote in 2000 election.
| Canadian federal election, 2000 | ||||||||
|---|---|---|---|---|---|---|---|---|
| Party | Candidate | Votes | % | ∆% | ||||
| Liberal | Anita Neville | 15,231 | 40.5 | -15.4 | ||||
| Progressive Conservative | David Newman | 10,675 | 28.4 | +14.4 | ||||
| New Democratic | James Allum | 7,501 | 19.9 | +4.0 | ||||
| Alliance | Betty Granger | 3,210 | 8.5 | -3.9 | ||||
| Marijuana | Chris Buors | 640 | 1.7 | |||||
| Canadian Action | Magnus Thompson | 202 | 0.5 | |||||
| Communist | David Allison | 181 | 0.5 | |||||
| Total valid votes | 37,640 | 100.0 | ||||||
Note: Canadian Alliance vote is compared to the Reform vote in 1997 election.
| Canadian federal election, 1997 | ||||||||
|---|---|---|---|---|---|---|---|---|
| Party | Candidate | Votes | % | ∆% | ||||
| Liberal | Lloyd Axworthy | 20,006 | 55.9 | -5.2 | ||||
| New Democratic | Sara Malabar | 5,717 | 16.0 | +7.3 | ||||
| Progressive Conservative | Andrea Rolstone | 5,011 | 14.0 | +4.8 | ||||
| Reform | Gary Hollingshead | 4,457 | 12.5 | -0.1 | ||||
| Natural Law | Ron Decter | 224 | 0.6 | +0.1 | ||||
| Independent | Jim Blomquist | 202 | 0.6 | |||||
| Marxist–Leninist | Karen Naylor | 180 | 0.5 | +0.3 | ||||
| Total valid votes | 35,797 | 100.0 | ||||||
| Canadian federal election, 1993 | ||||||||
|---|---|---|---|---|---|---|---|---|
| Party | Candidate | Votes | % | ∆% | ||||
| Liberal | Lloyd Axworthy | 25,667 | 61.1 | +2.6 | ||||
| Reform | Vern A. Hannah | 5,292 | 12.6 | +10.9 | ||||
| Progressive Conservative | Mike Radcliffe | 3,878 | 9.2 | -19.7 | ||||
| New Democratic | Lloyd Penner | 3,630 | 8.6 | -1.7 | ||||
| National | Bill Loewen | 3,104 | 7.4 | |||||
| Natural Law | Elizabeth Innes | 225 | 0.5 | |||||
| Independent | Karen Naylor | 90 | 0.2 | |||||
| Libertarian | Clancy Smith | 88 | 0.2 | -0.1 | ||||
| Canada Party | Ben J. Fulawka | 54 | – | |||||
| Total valid votes | 42,028 | 100.0 | 0.1 | |||||
| Canadian federal election, 1988 | ||||||||
|---|---|---|---|---|---|---|---|---|
| Party | Candidate | Votes | % | |||||
| Liberal | Lloyd Axworthy | 26,191 | 58.4 | |||||
| Progressive Conservative | Garth Dawley | 12,960 | 28.9 | |||||
| New Democratic | Les Campbell | 4,637 | 10.3 | |||||
| Reform | Ross Malabar | 777 | 1.7 | |||||
| Libertarian | Clancy Smith | 154 | 0.3 | |||||
| Independent | Ken Kalturnyk | 111 | 0.2 | |||||
| Total valid votes | 44,830 | 100.0 | ||||||
1925–1979
| Canadian federal election, 1974 | ||||||||
|---|---|---|---|---|---|---|---|---|
| Party | Candidate | Votes | % | ∆% | ||||
| Progressive Conservative | Dan McKenzie | 32,277 | 57.1 | +11.9 | ||||
| Liberal | Doug McEwen | 15,956 | 28.2 | -8.1 | ||||
| New Democratic | Andy Robertson | 7,823 | 13.8 | -4.7 | ||||
| Social Credit | Monty A. McDonald | 365 | 0.6 | |||||
| Marxist–Leninist | Marnie Frain | 102 | 0.2 | |||||
| Total valid votes | 56,523 | 100.0 | ||||||
| Canadian federal election, 1972 | ||||||||
|---|---|---|---|---|---|---|---|---|
| Party | Candidate | Votes | % | ∆% | ||||
| Progressive Conservative | Dan McKenzie | 25,550 | 45.2 | +16.3 | ||||
| Liberal | E. B. Osler | 20,516 | 36.3 | -15.5 | ||||
| New Democratic | Harvey H. Moats | 10,460 | 18.5 | +0.6 | ||||
| Total valid votes | 56,526 | 100.0 | ||||||
| Canadian federal election, 1968 | ||||||||
|---|---|---|---|---|---|---|---|---|
| Party | Candidate | Votes | % | ∆% | ||||
| Liberal | E. B. Osler | 23,775 | 51.8 | +15.5 | ||||
| Progressive Conservative | Duff Roblin | 13,268 | 28.9 | -12.9 | ||||
| New Democratic | Frances Thompson | 8,240 | 17.9 | -1.8 | ||||
| Independent Conservative | John McDowell | 632 | 1.4 | |||||
| Total valid votes | 45,915 | 100.0 | ||||||
| Canadian federal election, 1965 | ||||||||
|---|---|---|---|---|---|---|---|---|
| Party | Candidate | Votes | % | ∆% | ||||
| Progressive Conservative | Gordon Churchill | 15,296 | 41.8 | -0.7 | ||||
| Liberal | Fred Douglas | 13,262 | 36.3 | -3.2 | ||||
| New Democratic | Philip Petursson | 7,234 | 19.8 | +4.8 | ||||
| Social Credit | Walter Hatch | 764 | 2.1 | -0.9 | ||||
| Total valid votes | 36,556 | 100.0 | ||||||
| Canadian federal election, 1963 | ||||||||
|---|---|---|---|---|---|---|---|---|
| Party | Candidate | Votes | % | ∆% | ||||
| Progressive Conservative | Gordon Churchill | 17,092 | 42.6 | -0.4 | ||||
| Liberal | Fred Douglas | 15,849 | 39.5 | +2.3 | ||||
| New Democratic | Alistair Stewart | 6,011 | 15.0 | -1.5 | ||||
| Social Credit | Harold Bathgate | 1,182 | 2.9 | -0.4 | ||||
| Total valid votes | 40,134 | 100.0 | ||||||
| Canadian federal election, 1962 | ||||||||
|---|---|---|---|---|---|---|---|---|
| Party | Candidate | Votes | % | ∆% | ||||
| Progressive Conservative | Gordon Churchill | 16,547 | 43.0 | -23.6 | ||||
| Liberal | Ed Russenholt | 14,306 | 37.2 | +18.1 | ||||
| New Democratic | A.N. Robertson | 6,357 | 16.5 | +2.2 | ||||
| Social Credit | Asta Oddson | 1,298 | 3.4 | |||||
| Total valid votes | 38,508 | 100.0 | ||||||
Note: NDP vote is compared to CCF vote in 1958 election.
| Canadian federal election, 1958 | ||||||||
|---|---|---|---|---|---|---|---|---|
| Party | Candidate | Votes | % | ∆% | ||||
| Progressive Conservative | Gordon Churchill | 27,722 | 66.6 | +16.5 | ||||
| Liberal | Ronald Gillies | 7,927 | 19.0 | -6.2 | ||||
| Co-operative Commonwealth | Gordon Fines | 5,975 | 14.4 | -3.5 | ||||
| Total valid votes | 41,624 | 100.0 | ||||||
| Canadian federal election, 1957 | ||||||||
|---|---|---|---|---|---|---|---|---|
| Party | Candidate | Votes | % | ∆% | ||||
| Progressive Conservative | Gordon Churchill | 19,022 | 50.1 | +7.4 | ||||
| Liberal | Roy Richardson | 9,592 | 25.3 | -8.1 | ||||
| Co-operative Commonwealth | A.H. Mackling | 6,778 | 17.9 | -4.4 | ||||
| Social Credit | Asa Caswell | 2,561 | 6.7 | |||||
| Total valid votes | 37,953 | 100.0 | ||||||
| Canadian federal election, 1953 | ||||||||
|---|---|---|---|---|---|---|---|---|
| Party | Candidate | Votes | % | ∆% | ||||
| Progressive Conservative | Gordon Churchill | 12,489 | 42.7 | -0.9 | ||||
| Liberal | A.W. Hanks | 9,752 | 33.3 | -4.9 | ||||
| Co-operative Commonwealth | Gordon R. Fines | 6,506 | 22.2 | +4.1 | ||||
| Labor–Progressive | Roland Penner | 504 | 1.7 | |||||
| Total valid votes | 29,251 | 100.0 | ||||||
| Canadian federal by-election, 25 June 1951 | ||||||||
|---|---|---|---|---|---|---|---|---|
| Party | Candidate | Votes | % | ∆% | ||||
| On Mr. Maybank's resignation, 30 April 1951 | ||||||||
| Progressive Conservative | Gordon Churchill | 6,009 | 43.6 | +19.2 | ||||
| Liberal | Norman Wright | 5,273 | 38.3 | -16.4 | ||||
| Co-operative Commonwealth | Charles Biesick | 2,497 | 18.1 | -2.8 | ||||
| Total valid votes | 13,779 | 100.0 | ||||||
| Canadian federal election, 1949 | ||||||||
|---|---|---|---|---|---|---|---|---|
| Party | Candidate | Votes | % | ∆% | ||||
| Liberal | Ralph Maybank | 14,747 | 54.7 | +10.7 | ||||
| Progressive Conservative | Gordon Minto Churchill | 6,593 | 24.4 | +1.7 | ||||
| Co-operative Commonwealth | Andrew N. Robertson | 5,632 | 20.9 | -12.4 | ||||
| Total valid votes | 26,972 | 100.0 | ||||||
| Canadian federal election, 1945 | ||||||||
|---|---|---|---|---|---|---|---|---|
| Party | Candidate | Votes | % | ∆% | ||||
| Liberal | Ralph Maybank | 16,389 | 44.0 | -10.5 | ||||
| Co-operative Commonwealth | Lloyd Cleworth Stinson | 12,393 | 33.3 | +17.7 | ||||
| Progressive Conservative | Frank Edward Womersley | 8,461 | 22.7 | -7.2 | ||||
| Total valid votes | 37,243 | 100.0 | ||||||
Note: Progressive Conservative vote is compared to "National Government" vote in 1940 election.
| Canadian federal election, 1940 | ||||||||
|---|---|---|---|---|---|---|---|---|
| Party | Candidate | Votes | % | ∆% | ||||
| Liberal | Ralph Maybank | 19,486 | 54.5 | +18.1 | ||||
| National Government | William Walker Kennedy | 10,698 | 29.9 | -0.4 | ||||
| Co-operative Commonwealth | John Julius Swanson | 5,576 | 15.6 | -5.6 | ||||
| Total valid votes | 35,760 | 100.0 | ||||||
Note: "National Government" vote is compared to Conservative vote in 1935 election.
| Canadian federal election, 1935 | ||||||||
|---|---|---|---|---|---|---|---|---|
| Party | Candidate | Votes | % | ∆% | ||||
| Liberal | Ralph Maybank | 11,264 | 36.4 | -7.6 | ||||
| Conservative | William Walker Kennedy | 9,382 | 30.3 | -25.7 | ||||
| Co-operative Commonwealth | Stanley Knowles | 6,573 | 21.2 | |||||
| Reconstruction | Alfred James Susans | 2,642 | 8.5 | |||||
| Social Credit | Arthur Brown | 1,114 | 3.6 | |||||
| Total valid votes | 30,975 | 100.0 | ||||||
| Canadian federal election, 1930 | ||||||||
|---|---|---|---|---|---|---|---|---|
| Party | Candidate | Votes | % | ∆% | ||||
| Conservative | William Walker Kennedy | 17,355 | 56.0 | +7.2 | ||||
| Liberal | Joseph Thorarinn Thorson | 13,637 | 44.0 | -7.2 | ||||
| Total valid votes | 30,992 | 100.0 | ||||||
| Canadian federal election, 1926 | ||||||||
|---|---|---|---|---|---|---|---|---|
| Party | Candidate | Votes | % | ∆% | ||||
| Liberal | Joseph Thorarinn Thorson | 12,315 | 51.2 | +20.0 | ||||
| Conservative | William Walker Kennedy | 11,737 | 48.8 | -4.1 | ||||
| Total valid votes | 24,052 | 100.0 | ||||||
| Canadian federal election, 1925 | ||||||||
|---|---|---|---|---|---|---|---|---|
| Party | Candidate | Votes | % | |||||
| Conservative | William Walker Kennedy | 12,094 | 52.9 | |||||
| Liberal | Joseph Fergus Davidson | 7,132 | 31.2 | |||||
| Labour | Alexander Henry | 3,643 | 15.9 | |||||
| Total valid votes | 22,869 | 100.0 | ||||||
See also
References
- "(Code 46014) Census Profile". 2011 census. Statistics Canada. 2012. Retrieved 2011-03-03.
- Riding history for Winnipeg South Centre (1924–1976) from the Library of Parliament
- Riding history for Winnipeg South Centre (1987–2003) from the Library of Parliament
- Riding history for Winnipeg South Centre (2003– ) from the Library of Parliament
- Expenditures - 2008
- Expenditures - 2004
Notes
- ↑ Statistics Canada: 2012
- ↑ Statistics Canada: 2012
- ↑ Elections Canada – Confirmed candidates for Winnipeg South Centre, 30 September 2015
- ↑ Elections Canada – Preliminary Election Expenses Limits for Candidates
- ↑ http://www.elections.ca/WPAPPS/WPF/EN/CC/DistrictReport?act=C23&eventid=41&returntype=1&option=3&queryid=e02b567ac5674e07be3cb6033c152602
- ↑ Pundits' Guide to Canadian Elections
Coordinates: 49°51′43″N 97°09′54″W / 49.862°N 97.165°W