Calgary Signal Hill
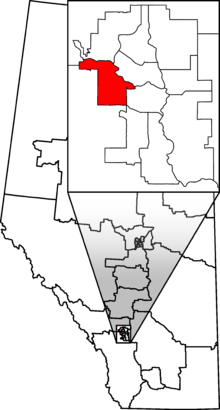 Calgary Signal Hill in relation to other Alberta federal electoral districts as of the 2013 Representation Order. | |||
| Federal electoral district | |||
| Legislature | House of Commons | ||
| MP |
| ||
| District created | 2013 | ||
| First contested | 2015 | ||
| District webpage | profile, map | ||
| Demographics | |||
| Population (2011)[1] | 109,647 | ||
| Electors (2015) | 84,765 | ||
| Area (km²)[2] | 66 | ||
| Pop. density (per km²) | 1,661.3 | ||
| Census divisions | Division No. 6 | ||
| Census subdivisions | Calgary | ||
Calgary Signal Hill is a federal electoral district in Alberta, Canada, that has been represented in the House of Commons of Canada since 2015.
Calgary Signal Hill was created by the 2012 federal electoral boundaries redistribution and was legally defined in the 2013 representation order. It came into effect upon the call of the 42nd Canadian federal election, scheduled for October 19th 2015. [3] It was created out of parts of the electoral districts of Calgary West and Calgary Centre.[4]
Geography
The Calgary Signal Hill riding extends from the Bow River south to Glenmore Trail SW and from 101 St SW east to 37 St SW. It contains the neighbourhoods of Aspen Woods, Bowness, Christie Park, Coach Hill, Cougar Ridge, Crestmont, Discovery Ridge, Glamorgan, Glenbrook, Glendale, Patterson, Rosscarrock, Signal Hill, Springbank Hill, Spruce Cliff, Strathcona Park, The Slopes, Valley Ridge, Wentworth, Westgate, West Springs and Wildwood.
Members of Parliament
This riding has elected the following members of the House of Commons of Canada:
| Parliament | Years | Member | Party | |
|---|---|---|---|---|
| Calgary Signal Hill Riding created from Calgary Centre and Calgary West |
||||
| 42nd | 2015–Present | Ron Liepert | Conservative | |
Election results
| Canadian federal election, 2015 | ||||||||
|---|---|---|---|---|---|---|---|---|
| Party | Candidate | Votes | % | ∆% | Expenditures | |||
| Conservative | Ron Liepert | 37,858 | 60.55 | –4.33 | – | |||
| Liberal | Kerry Cundal | 19,108 | 30.56 | +15.12 | – | |||
| New Democratic | Khalis Ahmed | 3,128 | 5.00 | –5.58 | – | |||
| Green | Taryn Knorren | 1,586 | 2.54 | –6.24 | – | |||
| Libertarian | Tim Moen | 679 | 1.09 | – | – | |||
| Christian Heritage | Jesse Rau | 160 | 0.26 | – | – | |||
| Total valid votes/Expense limit | 62,519 | 100.00 | $220,624.93 | |||||
| Total rejected ballots | 189 | 0.30 | – | |||||
| Turnout | 62,708 | 73.98 | – | |||||
| Eligible voters | 84,765 | |||||||
| Conservative hold | Swing | –9.74 | ||||||
| Source: Elections Canada[5][6] | ||||||||
| 2011 federal election redistributed results[7] | |||
|---|---|---|---|
| Party | Vote | % | |
| Conservative | 29,199 | 64.93 | |
| Liberal | 6,946 | 15.44 | |
| New Democratic | 4,760 | 10.58 | |
| Green | 3,948 | 8.78 | |
| Others | 120 | 0.27 | |
References
- ↑ Statistics Canada: 2011
- ↑ Statistics Canada: 2011
- ↑ Timeline for the Redistribution of Federal Electoral Districts
- ↑ Report – Alberta
- ↑ "October 19, 2015 Election Results — Calgary Signal Hill (Validated results)". Elections Canada. 21 October 2015. Retrieved 4 November 2015.
- ↑ Elections Canada – Preliminary Election Expenses Limits for Candidates
- ↑ Pundits' Guide to Canadian Elections
.png)
.png)