Cypress Hills—Grasslands
Cypress Hills—Grasslands is a federal electoral district in Saskatchewan, Canada, that has been represented in the House of Commons of Canada since 1997.
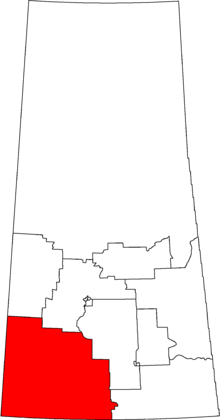
Geography
The district is in the southwestern corner of the Province of Saskatchewan.
History
The electoral district was created in 1996 from Kindersley—Lloydminster, Moose Jaw—Lake Centre and Swift Current—Maple Creek—Assiniboia ridings.
This riding lost territory to Carlton Trail—Eagle Creek and gained territory from Battlefords—Lloydminster and Palliser during the 2012 electoral redistribution.
Members of Parliament
This riding has elected the following members of the House of Commons:
Current Member of Parliament
Its Member of Parliament is David Anderson, a former farmer. He was first elected in 2000. He represents the Conservative Party of Canada. He is the Parliamentary Secretary to the Minister of Natural Resources and for the Canadian Wheat Board. In the last parliamentary session he served as a member on the 'Standing Committee on Agriculture and Agri-Food'.
Election results
| Canadian federal election, 2011 |
| Party |
Candidate |
Votes | % | ∆% | Expenditures |
|
Conservative | David L. Anderson | 20,555 | 69.8 | +5.4 | $39,752 |
|
New Democratic | Trevor Peterson | 6,248 | 21.2 | +5.4 | $9,855 |
|
Liberal | Duane Filson | 1,838 | 6.2 | -7.1 | $27,813 |
|
Green | Helmi Scott | 788 | 2.7 | -3.9 | $517 |
| Total valid votes/Expense limit |
29,429 | 100.0 | | $94,253 |
| Total rejected ballots |
79 | 0.3 | 0.0 |
| Turnout |
29,508 | 67.1 | +4 |
| Eligible voters |
43,997 | – | – |
|
Conservative hold |
Swing |
+6.25
|
| Canadian federal election, 2008 |
| Party |
Candidate |
Votes | % | ∆% | Expenditures |
|
Conservative | David L. Anderson | 17,922 | 64.4 | -2.1 | $51,570 |
|
New Democratic | Scott Wilson | 4,394 | 15.8 | -1.1 | $5,879 |
|
Liberal | Duane Filson | 3,691 | 13.3 | +0.4 | $23,849 |
|
Green | Bill Clary | 1,840 | 6.6 | +2.8 | $4,012 |
| Total valid votes/Expense limit |
27,847 | 100.0 | | $91,352 |
| Total rejected ballots |
81 | 0.3 | 0.0 |
| Turnout |
27,928 | 63 | -3 |
|
Conservative hold |
Swing |
+1.0
|
| Canadian federal election, 2006 |
| Party |
Candidate |
Votes | % | ∆% | Expenditures |
|
Conservative | David L. Anderson | 20,035 | 66.5 | +5.8 | $42,285 |
|
New Democratic | Mike Eason | 5,076 | 16.8 | +0.3 | $12,076 |
|
Liberal | Bill Caton | 3,885 | 12.9 | -5.8 | $3,553 |
|
Green | Amanda Knorr | 1,141 | 3.8 | -0.4 | – |
| Total valid votes |
30,137 | 100.0 | | – |
| Total rejected ballots |
85 | 0.3 | -0.1 |
| Turnout |
30,222 | 66.5 | +3 |
|
Conservative hold |
Swing |
+5.8
|
| Canadian federal election, 2004 |
| Party |
Candidate |
Votes | % | ∆% | Expenditures |
|
Conservative | David L. Anderson | 18,010 | 60.6 | -9.9 | $35,176 |
|
Liberal | Bill Caton | 5,547 | 18.7 | +6.1 | $29,831 |
|
New Democratic | Jeff Potts | 4,901 | 16.5 | –0.4 | $17,512 |
|
Green | Bev Currie | 1,243 | 4.2 | | $805 |
| Total valid votes |
29,701 | 100 | | – |
| Total rejected ballots |
117 | 0.4 | +0.1 |
| Turnout |
29,818 | 63 | -2 |
|
Conservative hold |
Swing |
-8.0
|
| Canadian federal election, 2000 |
| Party |
Candidate |
Votes | % | ∆% | Expenditures |
|
Alliance | David L. Anderson | 18,593 | 61.6 | +12.5 | $33,948 |
|
New Democratic | Keith Murch | 5,101 | 16.9 | -2.5 | $14,293 |
|
Liberal | Marlin Bryce Belt | 3,791 | 12.6 | -8.7 | $722 |
|
Progressive Conservative | Bill Caton | 2,676 | 8.9 | -1.3 | $7,462 |
| Total valid votes |
30,161 | 100 | | – |
| Total rejected ballots |
90 | 0.3 | 0.0 |
| Turnout |
30,251 | 65 | -2.4 |
|
Alliance hold |
Swing |
+10.6
|
| Canadian federal election, 1997 |
| Party |
Candidate |
Votes | % | ∆% | Expenditures |
|
Reform | Lee Morrison | 16,439 | 49.1 | – | $36,935 |
|
Liberal | Ron Gleim | 7,130 | 21.3 | – | $52,705 |
|
New Democratic | Dean Smith | 6,490 | 19.4 | – | $36,138 |
|
Progressive Conservative | Marcel Fournier | 3,421 | 10.2 | – | $9,917 |
| Total valid votes |
33,480 | 100 | | – |
| Total rejected ballots |
105 | 0.3 |
| Turnout |
33,585 | 67.4 |
See also
References
Notes
External links
.png)