Stockport (UK Parliament constituency)
| Stockport | |
|---|---|
|
Borough constituency for the House of Commons | |
|
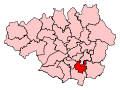
Boundary of Stockport in Greater Manchester. | |
|
Location of Greater Manchester within England. | |
| County | Greater Manchester |
| Electorate | 62,764 (December 2010)[1] |
| Major settlements | Stockport |
| Current constituency | |
| Created | 1983 |
| Member of parliament | Ann Coffey (Labour) |
| Number of members | One |
| Created from | Stockport North, Stockport South |
| 1832–1950 | |
| Number of members | Two |
| Replaced by | Stockport North, Stockport South |
| Overlaps | |
| European Parliament constituency | North West England |

Stockport is a constituency[n 1] represented in the House of Commons of the UK Parliament since 1992 by Ann Coffey, a member of the Labour Party.[n 2]
Boundaries
1983-1997: The Metropolitan Borough of Stockport wards of Cale Green, Davenport, Edgeley, Heaton Mersey, Heaton Moor, and Manor.
1997-2010: The Metropolitan Borough of Stockport wards of Brinnington, Cale Green, Davenport, Edgeley, Heaton Mersey, Heaton Moor, and Manor.
2010-present: The Metropolitan Borough of Stockport wards of Brinnington and Central, Davenport and Cale Green, Edgeley and Cheadle Heath, Heatons North, Heatons South, and Manor.
History
Stockport was created as a two-member constituency by the Reform Act 1832. It survived as such until 1950, when it was split into single-member seats of Stockport North and Stockport South.
The single Stockport seat was recreated in 1983 on a more central ambit, returning one member, with the remainder of the ex-county borough forming part of the new Denton and Reddish seat.
- Prominent members
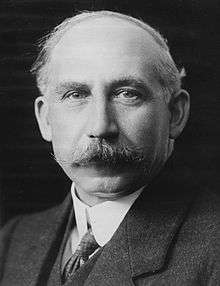
Edward William Watkin was a railway entrepreneur, who helped to fund and plan lines across Britain, in Canada and, to a lesser extent, in the USA.
George Whiteley became later in his tenure for Stockport Chief Whip between 1905 and 1908 in the Liberal administrations of Sir Henry Campbell-Bannerman and H. H. Asquith.
In the 21st century, Ann Coffey was PPS to the Chancellor of the Exchequer while this role was held by Alastair Darling.
Constituency profile
The historic town at the centre of the seat now has good links to Manchester city centre and is close to Alderley Edge and fairly close to the Peak District National Park to one side and access to the M6 on the other. The area has a Council which is currently in 'No Overall Control'. The most recent opposition has been relatively strong but equally split between the Conservatives and Liberal Democrats. The Liberal Democrats have in local elections to date been strongest in Davenport and Cale Green, and Manor whereas the Conservatives have been strongest in Heatons North, having had councillors in these wards. The Labour Party have been strongest in the other two wards to date. Workless claimants, registered jobseekers, were in November 2012 higher than the national average of 3.8%, and regional average of 4.4% at 4.9% of the population based on a statistical compilation by The Guardian.[2]
Members of Parliament
MPs 1832–1950
MPs 1983-present
- Constituency recreated (1983)
| Election | Member[3] | Party | |
|---|---|---|---|
| 1983 | Anthony Favell | Conservative | |
| 1992 | Ann Coffey | Labour | |
Elections
Elections of the 2010s
| Party | Candidate | Votes | % | ± | |
|---|---|---|---|---|---|
| Labour | Ann Coffey | 19,771 | 49.9 | +7.2 | |
| Conservative | Daniel Hamilton | 9,710 | 24.5 | -0.8 | |
| UKIP | Steven Woolfe | 5,206 | 13.1 | +10.9 | |
| Liberal Democrat | Daniel Hawthorne | 3,034 | 7.7 | -17.3 | |
| Green | Gary Lawson | 1,753 | 4.4 | +2.7 | |
| Left Unity | John Pearson | 175 | 0.4 | N/A | |
| Majority | 10,061 | 25.4 | |||
| Turnout | 39,649 | 62.0 | |||
| Labour hold | Swing | +4.0 | |||
| Party | Candidate | Votes | % | ± | |
|---|---|---|---|---|---|
| Labour | Ann Coffey | 16,697 | 42.7 | −9.6 | |
| Conservative | Stephen Holland | 9,913 | 25.3 | +1.8 | |
| Liberal Democrat | Stuart Bodsworth | 9,778 | 25.0 | +3.6 | |
| BNP | Duncan Warner | 1,201 | 3.1 | N/A | |
| UKIP | Michael N. Kelly | 862 | 2.2 | −0.5 | |
| Green | Peter Barber | 677 | 1.7 | N/A | |
| Majority | 6,784 | 17.3 | |||
| Turnout | 39,128 | 61.6 | +7.6 | ||
| Labour hold | Swing | −5.7 | |||
Elections of the 2000s
| Party | Candidate | Votes | % | ± | |
|---|---|---|---|---|---|
| Labour | Ann Coffey | 18,069 | 50.5 | −8.1 | |
| Conservative | Elizabeth Berridge | 8,906 | 24.9 | −1.0 | |
| Liberal Democrat | Lyn-Su Floodgate | 7,832 | 21.9 | +6.4 | |
| UKIP | Richard Simpson | 964 | 2.7 | +2.7 | |
| Majority | 9,163 | 25.6 | |||
| Turnout | 35,771 | 54.5 | +1.2 | ||
| Labour hold | Swing | −3.5 | |||
| Party | Candidate | Votes | % | ± | |
|---|---|---|---|---|---|
| Labour | Ann Coffey | 20,731 | 58.6 | −4.3 | |
| Conservative | John Allen | 9,162 | 25.9 | +3.6 | |
| Liberal Democrat | Mark Hunter | 5,490 | 15.5 | +4.9 | |
| Majority | 11,569 | 32.7 | |||
| Turnout | 35,383 | 53.3 | −18.0 | ||
| Labour hold | Swing | ||||
Elections of the 1990s
| Party | Candidate | Votes | % | ± | |
|---|---|---|---|---|---|
| Labour | Ann Coffey | 29,338 | 62.9 | ||
| Conservative | Stephen Fitzsimmons | 10,426 | 22.3 | ||
| Liberal Democrat | Sylvia Roberts | 4,951 | 10.6 | ||
| Referendum | William Morley-Scott | 1,280 | 2.7 | ||
| Socialist Labour | Geoff Southern | 255 | 0.5 | ||
| Monster Raving Loony | Colin Newitt | 213 | 0.5 | ||
| Independent Conservative | Christopher Dronfield | 206 | 0.4 | ||
| Majority | 18,912 | 40.6 | |||
| Turnout | 46,769 | 71.5 | |||
| Labour hold | Swing | ||||
| Party | Candidate | Votes | % | ± | |
|---|---|---|---|---|---|
| Labour | Ann Coffey | 21,096 | 44.1 | +8.8 | |
| Conservative | Anthony Favell | 19,674 | 41.2 | −0.2 | |
| Liberal Democrat | Mrs Anne C. Corris | 6,539 | 13.7 | −8.4 | |
| Green | Miss Judith A. Filmore | 436 | 0.9 | −0.3 | |
| Natural Law | David N. Saunders | 50 | 0.1 | N/A | |
| Majority | 1,422 | 3.0 | −3.1 | ||
| Turnout | 47,795 | 82.3 | +4.2 | ||
| Labour gain from Conservative | Swing | +4.5 | |||
Elections of the 1980s
| Party | Candidate | Votes | % | ± | |
|---|---|---|---|---|---|
| Conservative | Anthony Favell | 19,410 | 41.4 | −0.7 | |
| Labour | Mrs. Shirley Haines | 16,557 | 35.3 | +6.3 | |
| Social Democratic | John Lovat Begg | 10,365 | 22.1 | −5.5 | |
| Green | Michael John Shipley | 573 | 1.2 | +0.4 | |
| Majority | 2,853 | 6.1 | |||
| Turnout | 46,332 | 78.1 | |||
| Conservative hold | Swing | −3.5 | |||
| Party | Candidate | Votes | % | ± | |
|---|---|---|---|---|---|
| Conservative | Anthony Favell | 18,517 | 42.1 | N/A | |
| Labour | Peter R. Ward | 12,731 | 29.0 | N/A | |
| Social Democratic | Tom McNally | 12,129 | 27.6 | N/A | |
| Ecology | Michael John Shipley | 369 | 0.8 | N/A | |
| Nationalist Party | Kenneth S. Walker | 194 | 0.4 | N/A | |
| Majority | 5,786 | 13.2 | N/A | ||
| Turnout | 43,940 | 74.6 | N/A | ||
| Conservative win (new seat) | |||||
Elections of the 1940s
| Party | Candidate | Votes | % | ± | |
|---|---|---|---|---|---|
| Conservative | Arnold Babb Gridley | 31,039 | 20.6 | - 10.1 | |
| Conservative | Norman John Hulbert | 30,792 | 20.4 | - 9.6 | |
| Labour | A. Reginald Stamp | 29,674 | 19.6 | - 0.5 | |
| Labour | Rowland William Casasola | 28,798 | 19.6 | + 0.4 | |
| Liberal | Hugh Sutherland | 14,994 | 9.9 | N/A | |
| Liberal | Frederick William Malbon | 14,942 | 9.9 | N/A | |
| Majority | 1,118 | 0.8 | - 9.1 | ||
| Turnout | 77.2 | - 2.3 | |||
| Conservative hold | Swing | ||||
| Conservative hold | Swing | ||||
Elections of the 1930s
| Party | Candidate | Votes | % | ± | |
|---|---|---|---|---|---|
| Conservative | Arnold Babb Gridley | 43,882 | 30.7 | - 6.3 | |
| Conservative | Norman John Hulbert | 43,001 | 30.0 | - 4.7 | |
| Labour | James Hindle Hudson | 28,798 | 20.1 | + 3.1 | |
| Labour | Christopher Thomas Douthwaite | 27,528 | 19.2 | N/A | |
| Majority | 14,203 | 9.9 | - 7.8 | ||
| Turnout | 79.5 | - 4.6 | |||
| Conservative hold | Swing | ||||
| Conservative hold | Swing | ||||
| Party | Candidate | Votes | % | ± | |
|---|---|---|---|---|---|
| Conservative | Samuel Schofield Hammersley | 50,936 | 37.0 | + 11.3 | |
| Conservative | Alan Vincent Gandar Dower | 47,757 | 34.7 | + 15.2 | |
| Labour | Arnold Ernest Townend | 23,350 | 17.0 | - 10.4 | |
| Ind. Labour Party | John Thomas Abbott | 15,591 | 11.3 | N/A | |
| Majority | 24,407 | 17.7 | + 12.0 | ||
| Turnout | 84.1 | - 0.5 | |||
| Conservative gain from Labour | Swing | ||||
| Conservative hold | Swing | ||||
Elections of the 1920s
| Party | Candidate | Votes | % | ± | |
|---|---|---|---|---|---|
| Labour | Arnold Ernest Townend | 30,955 | 27.4 | n/a | |
| Unionist | Samuel Schofield Hammersley | 29,043 | 25.7 | n/a | |
| Liberal | Henry Fildes | 22,595 | 20.0 | n/a | |
| Unionist | Edwin Noel Lingen-Barker | 22,047 | 19.5 | n/a | |
| Independent Liberal | Charles Royle | 8,355 | 7.4 | n/a | |
| Majority | 6,448 | 5.7 | n/a | ||
| Turnout | 84.6 | -1.1 | |||
| Labour gain from Unionist | Swing | n/a | |||
| Unionist hold | Swing | n/a | |||
| Party | Candidate | Votes | % | ± | |
|---|---|---|---|---|---|
| Labour | Arnold Ernest Townend | 20,219 | 36.5 | n/a | |
| Unionist | Thomas Eastham | 17,892 | 32.3 | n/a | |
| Liberal | Henry Fildes | 17,296 | 31.2 | n/a | |
| Majority | 2,327 | 4.2 | n/a | ||
| Turnout | 55,407 | 85.7 | −0.2 | ||
| Labour gain from Unionist | Swing | n/a | |||
| Party | Candidate | Votes | % | ± | |
|---|---|---|---|---|---|
| Unionist | William Greenwood | 28,057 | 31.6 | +9.2 | |
| Unionist | Samuel Schofield Hammersley | 26,417 | 29.7 | +9.7 | |
| Labour | Arnold Ernest Townend | 21,986 | 24.8 | +6.8 | |
| Liberal | Charles Royle | 12,386 | 13.9 | -7.3 | |
| Majority | 4,431 | 4.9 | |||
| Turnout | 88,846 | 85.9 | +4.2 | ||
| Unionist hold | Swing | ||||
| Unionist gain from Liberal | Swing | ||||
| Party | Candidate | Votes | % | ± | |
|---|---|---|---|---|---|
| Unionist | William Greenwood | 20,308 | 22.4 | -10.7 | |
| Liberal | Charles Royle | 19,223 | 21.2 | n/a | |
| Unionist | Samuel Schofield Hammersley | 18,129 | 20.0 | n/a | |
| Liberal | Henry Fildes | 16,756 | 18.4 | -16.0 | |
| Labour | Arnold Ernest Townend | 16,340 | 18.0 | +2.2 | |
| Majority | 3,552 | 4.0 | |||
| Majority | 1,094 | 1.2 | |||
| Turnout | 71.7 | -9.5 | |||
| Unionist hold | Swing | ||||
| Liberal hold | Swing | ||||

| Party | Candidate | Votes | % | ± | |
|---|---|---|---|---|---|
| National Liberal | Henry Fildes | 35,241 | 34.4 | +9.3 | |
| Unionist | William Greenwood | 33,852 | 33.1 | +7.4 | |
| Co-operative Party | Samuel Frederick Perry | 17,059 | 16.7 | +0.5 | |
| Labour | James C.H. Robinson | 16,126 | 15.8 | -2.2 | |
| Majority | 18,182 | 17.7 | |||
| Majority | 16,793 | 16.4 | |||
| Turnout | 83.4 | +7.7 | |||
| National Liberal hold | Swing | ||||
| Unionist hold | Swing | ||||
| Party | Candidate | Votes | % | ± | |
|---|---|---|---|---|---|
| Unionist | William Greenwood | 22,847 | 25.7 | n/a | |
| Coalition Liberal | Henry Fildes | 22,386 | 25.1 | n/a | |
| Labour | Sir Leo George Chiozza Money | 16,042 | 18.0 | n/a | |
| Co-operative Party | Samuel Frederick Perry | 14,434 | 16.2 | n/a | |
| Independent | Albert Alfred George Kindell | 5,644 | 6.3 | n/a | |
| Independent | John Joseph Terrett | 5,443 | 6.1 | n/a | |
| Independent Republican | William X. O'Brien | 2,336 | 2.6 | n/a | |
| Majority | 6,805 | 7.7 | n/a | ||
| Majority | 6,344 | 7.1 | n/a | ||
| Turnout | 75.7 | n/a | |||
| Unionist gain from Coalition Labour | Swing | n/a | |||
| Coalition Liberal hold | Swing | n/a | |||
Elections of the 1910s

| Party | Candidate | Votes | % | ± | |
|---|---|---|---|---|---|
| Coalition Liberal | Spencer Leigh Hughes | unopposed | n/a | n/a | |
| Coalition Labour | George Wardle | unopposed | n/a | n/a | |
| Coalition Liberal hold | Swing | ||||
| Coalition Labour hold | Swing | ||||
Hughes was endorsed by the Coalition Government. The Coalition had a policy of not publicly endorsing Labour Party candidates but Wardle was a known supporter of the Coalition.
Elections in the 1910s
| Party | Candidate | Votes | % | ± | |
|---|---|---|---|---|---|
| Liberal | Spencer Leigh Hughes | 6,169 | |||
| Labour | George James Wardle | 6,094 | |||
| Conservative | John Rolleston Lort-Williams | 5,234 | |||
| Conservative | Robert Campbell | 5,183 | |||
| Majority | |||||
| Turnout | |||||
| Labour hold | Swing | ||||
| Liberal hold | Swing | ||||
| Party | Candidate | Votes | % | ± | |
|---|---|---|---|---|---|
| Labour | George James Wardle | 6,682 | 28.0 | ||
| Liberal | Spencer Leigh Hughes | 6,645 | 27.9 | ||
| Conservative | George Edward Raine | 5,268 | 22.1 | ||
| Conservative | James Stuart Rankin | 5,249 | |||
| Majority | |||||
| Turnout | 94.2 | ||||
| Labour hold | Swing | ||||
| Liberal hold | Swing | ||||
Elections in the 1900s
| Party | Candidate | Votes | % | ± | |
|---|---|---|---|---|---|
| Labour | George James Wardle | 7,299 | 32.4 | ||
| Liberal | James Duckworth | 6,544 | 29.1 | ||
| Conservative | Harry Barnston | 4,591 | 20.4 | ||
| Conservative | Hon. Robert William Hugh O'Neill | 4,064 | 18.1 | ||
| Turnout | 93.1 | ||||
| Majority | 2,708 | 12.0 | |||
| Labour gain from Conservative | Swing | ||||
| Majority | 1,953 | 8.7 | |||
| Liberal hold | Swing | ||||
| Party | Candidate | Votes | % | ± | |
|---|---|---|---|---|---|
| Liberal | Sir Joseph Leigh | 5,666 | 26.5 | +1.8 | |
| Conservative | Beresford Valentine Melville | 5,377 | 25.2 | -0.2 | |
| Liberal | George Green | 5,200 | 24.4 | +1.6 | |
| Conservative | Alfred Peter Hillier | 5,098 | 23.9 | -3.2 | |
| Turnout | 87.6 | -3.8 | |||
| Majority | 568 | 2.6 | |||
| Majority | 177 | 0.8 | |||
| Conservative hold | Swing | ||||
| Liberal gain from Conservative | Swing | ||||
See also
- Stockport by-election, 1920
- Stockport by-election, 1925
- List of Parliamentary constituencies in Greater Manchester
Notes and references
- Notes
- ↑ A borough constituency (for the purposes of election expenses and type of returning officer)
- ↑ As with all constituencies, the constituency elects one Member of Parliament (MP) by the first past the post system of election at least every five years.
- References
- ↑ "Electorate Figures - Boundary Commission for England". 2011 Electorate Figures. Boundary Commission for England. 4 March 2011. Archived from the original on November 6, 2010. Retrieved 13 March 2011.
- ↑ Unemployment claimants by constituency The Guardian
- 1 2 3 Leigh Rayment's Historical List of MPs – Constituencies beginning with "S" (part 5)
- ↑ "Election Data 2015". Electoral Calculus. Archived from the original on 17 October 2015. Retrieved 17 October 2015.
- ↑ "Stockport". BBC News. Retrieved 11 May 2015.
- ↑ "Election Data 2010". Electoral Calculus. Archived from the original on 17 October 2015. Retrieved 17 October 2015.
- ↑ "Election Data 2005". Electoral Calculus. Archived from the original on 15 October 2011. Retrieved 18 October 2015.
- ↑ "Election Data 2001". Electoral Calculus. Archived from the original on 15 October 2011. Retrieved 18 October 2015.
- ↑ "Election Data 1997". Electoral Calculus. Archived from the original on 15 October 2011. Retrieved 18 October 2015.
- ↑ "Election Data 1992". Electoral Calculus. Archived from the original on 15 October 2011. Retrieved 18 October 2015.
- ↑ "UK General Election results April 1992". Richard Kimber's Political Science Resources. Politics Resources. 9 April 1992. Retrieved 2010-12-06.
- ↑ "Election Data 1987". Electoral Calculus. Archived from the original on 15 October 2011. Retrieved 18 October 2015.
- ↑ "Election Data 1983". Electoral Calculus. Archived from the original on 15 October 2011. Retrieved 18 October 2015.
- 1 2 3 4 British parliamentary election results, 1885-1918 (Craig)
Sources
- Craig, F. W. S. (1983) [1969]. British parliamentary election results 1918–1949 (3rd ed.). Chichester: Parliamentary Research Services. ISBN 0-900178-06-X.
- Election results, 1992–2005 (Guardian)
- Election results 1983–1992
- John McHugh, The Stockport by-election of 1920