Manchester Withington (UK Parliament constituency)
Coordinates: 53°25′59″N 2°14′02″W / 53.433°N 2.234°W
| Manchester, Withington | |
|---|---|
|
Borough constituency for the House of Commons | |
|
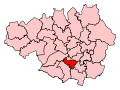
Boundary of Manchester, Withington in Greater Manchester. | |
|
Location of Greater Manchester within England. | |
| County | Greater Manchester |
| Electorate | 73,656 (December 2010)[1] |
| Current constituency | |
| Created | 1918 |
| Member of parliament | Jeff Smith (Labour Party) |
| Number of members | One |
| Overlaps | |
| European Parliament constituency | North West England |

Manchester Withington is a constituency[n 1] represented in the House of Commons of the UK Parliament since 2015 by Jeff Smith of Labour.[n 2]
Boundaries
1918-1950: The County Borough of Manchester wards of Chorlton-cum-Hardy, Didsbury, and Withington.
1950-1955: The County Borough of Manchester wards of Rusholme and Withington.
1955-1974: The County Borough of Manchester wards of Barlow Moor, Burnage, Levenshulme, Old Moat, and Withington.
1974-1983: The County Borough of Manchester wards of Barlow Moor, Burnage, Didsbury, Old Moat, and Withington.
1983-2010: The City of Manchester wards of Barlow Moor, Burnage, Chorlton, Didsbury, Old Moat, and Withington.
2010–present: The City of Manchester wards of Burnage, Chorlton, Chorlton Park, Didsbury East, Didsbury West, Old Moat, and Withington.
Members of Parliament
Jeff Smith is the current Labour MP for the constituency. He was elected at the 2015 general election, defeating the Liberal Democrat incumbent John Leech who had held the seat since 2005.
History
Manchester Withington was mostly before 1987 (with three years of Liberal Party representation near its 1918 inception) Conservative. With this designation of MP, it even resisted being gained by Labour in its massive landslide victories in 1945 and 1966. However, in 1987 the seat turned red for the first time and remained so until 2005 when it was gained by a Liberal Democrat.
Constituency profile
This constituency contains the medium-to-high income average areas of Chorlton and Didsbury, as well as mixed[3] Old Moat and Withington neighbourhoods.[4] A seat south of Manchester's city centre with a large student population,[3] the seat had in 2005 a strong reaction by many voters including students, opposing Labour's policy of top-up fees. The Conservatives have, bucking the national and regional results in both 2010 and 2015, faced a significant fall in their share of the vote, dropping into third place both times. In 2015, facing the electoral opposition to the Liberal Democrat involvement in the First Cameron ministry, Leech, who had held the seat for ten years and was a well respected local MP, lost the seat to Labour.
Elections
Elections in the 2010s
| Party | Candidate | Votes | % | ± | |
|---|---|---|---|---|---|
| Labour | Jeff Smith | 26,843 | 53.7 | +13.3 | |
| Liberal Democrat | John Leech | 11,970 | 24.0 | −20.7 | |
| Conservative | Robert Manning | 4,872 | 9.8 | −1.4 | |
| Green | Lucy Bannister | 4,048 | 8.1 | +6.3 | |
| UKIP | Mark Davies | 2,172 | 4.3 | +2.8 | |
| Independent | Marcus Farmer | 61 | 0.1 | 0.0 | |
| Majority | 14,873 | 29.8 | |||
| Turnout | 49,966 | 67.5 | +5.5 | ||
| Labour gain from Liberal Democrat | Swing | +17.0 | |||
| |||||
| Party | Candidate | Votes | % | ± | |
|---|---|---|---|---|---|
| Liberal Democrat | John Leech | 20,110 | 44.6 | +2.4 | |
| Labour | Lucy Powell | 18,260 | 40.5 | −0.4 | |
| Conservative | Chris Green | 5,005 | 11.1 | +0.7 | |
| Green | Brian A. Candeland | 798 | 1.8 | −2.5 | |
| UKIP | Robert Gutfreund-Walmsley | 698 | 1.5 | +0.4 | |
| Independent | Yasmin Zalzala | 147 | 0.3 | −0.1 | |
| Independent | Marcus Farmer | 57 | 0.1 | N/A | |
| Majority | 1,850 | 4.1 | |||
| Turnout | 45,075 | 62.2 | +6.8 | ||
| Liberal Democrat hold | Swing | +1.4 | |||
Elections in the 2000s
| Party | Candidate | Votes | % | ± | |
|---|---|---|---|---|---|
| Liberal Democrat | John Leech | 15,872 | 42.4 | +20.4 | |
| Labour | Keith John Charles Bradley | 15,205 | 40.6 | −14.3 | |
| Conservative | Karen Bradley | 3,919 | 10.5 | −4.8 | |
| Green | Brian A. Candeland | 1,595 | 4.3 | −0.1 | |
| UKIP | Robert Gutfreund-Walmsley | 424 | 1.1 | N/A | |
| Independent | Ivan Benett | 243 | 0.6 | N/A | |
| Independent | Yasmin Zalzala | 152 | 0.4 | N/A | |
| Their Party | Richard Reed | 47 | 0.1 | N/A | |
| Majority | 667 | 1.8 | |||
| Turnout | 37,459 | 55.3 | +3.4 | ||
| Liberal Democrat gain from Labour | Swing | +17.3 | |||
| Party | Candidate | Votes | % | ± | |
|---|---|---|---|---|---|
| Labour | Keith John Charles Bradley | 19,239 | 54.9 | ||
| Liberal Democrat | Yasmin Zalzala | 7,715 | 22.0 | ||
| Conservative | Julian Samways | 5,349 | 15.3 | ||
| Green | Michelle Valentine | 1,539 | 4.4 | N/A | |
| Socialist Alliance | John Clegg | 1,208 | 3.4 | N/A | |
| Majority | 11,524 | 32.9 | |||
| Turnout | 35,050 | 51.9 | |||
| Labour hold | Swing | ||||
Elections in the 1990s
| Party | Candidate | Votes | % | ± | |
|---|---|---|---|---|---|
| Labour | Keith John Charles Bradley | 27,103 | 61.56 | +8.9 | |
| Conservative | Jonathan M. Smith | 8,522 | 19.4 | −11.9 | |
| Liberal Democrat | Yasmin Zalzala | 6,000 | 13.6 | −0.6 | |
| Referendum | Mark B.B. Sheppard | 1,079 | 2.5 | N/A | |
| ProLife Alliance | Simon P. Caldwell | 614 | 1.4 | N/A | |
| Socialist Alternative | Julie White | 376 | 0.9 | N/A | |
| Rainbow Dream Ticket | Stephen Kingston | 181 | 0.4 | N/A | |
| Natural Law | Mark E.J. Gaskell | 152 | 0.4 | +0.1 | |
| Majority | 18,581 | 42.2 | |||
| Turnout | 44,027 | 65.8 | |||
| Labour hold | Swing | +10.4 | |||
| Party | Candidate | Votes | % | ± | |
|---|---|---|---|---|---|
| Labour | Keith John Charles Bradley | 23,962 | 52.7 | +9.7 | |
| Conservative | Eric N. Farthing | 14,227 | 31.3 | −5.0 | |
| Liberal Democrat | Gordon Hennell | 6,457 | 14.2 | −5.6 | |
| Green | Brian A. Candeland | 725 | 1.6 | +0.6 | |
| Natural Law | Clive E. Menhinick | 128 | 0.3 | N/A | |
| Majority | 9,735 | 21.4 | +14.7 | ||
| Turnout | 45,499 | 71.3 | −5.9 | ||
| Labour hold | Swing | +7.3 | |||
Elections in the 1980s
| Party | Candidate | Votes | % | ± | |
|---|---|---|---|---|---|
| Labour | Keith John Charles Bradley | 21,650 | 42.9 | +8.7 | |
| Conservative | Fred Silvester | 18,259 | 36.2 | −3.0 | |
| Liberal | Audrey Jones | 9,978 | 19.8 | −6.4 | |
| Green | Michael Terence Abberton | 524 | 1.0 | N/A | |
| Majority | 3,391 | 6.7 | |||
| Turnout | 50,411 | 77.1 | +4.8 | ||
| Labour gain from Conservative | Swing | +5.9 | |||
| Party | Candidate | Votes | % | ± | |
|---|---|---|---|---|---|
| Conservative | Fred Silvester | 18,329 | 39.2 | −8.1 | |
| Labour | Frances Done | 15,956 | 34.2 | −4.7 | |
| Social Democratic | Bernard L. Lever | 12,231 | 26.2 | ||
| Independent | Michael George Gibson | 184 | 0.4 | +0.0 | |
| Majority | 2,373 | 5.1 | |||
| Turnout | 46,700 | 72.3 | |||
| Conservative hold | Swing | −3.4 | |||
Elections in the 1970s
| Party | Candidate | Votes | % | ± | |
|---|---|---|---|---|---|
| Conservative | Fred Silvester | 18,862 | 47.3 | +4.3 | |
| Labour | Geoff M. Hodgson | 15,510 | 38.9 | +1.1 | |
| Liberal | John T. Mitchell | 5,387 | 13.5 | −5.7 | |
| Independent | Michael George Gibson | 157 | 0.4 | N/A | |
| Majority | 3,352 | 8.4 | |||
| Turnout | 39,916 | 74.7 | |||
| Conservative hold | Swing | +1.6 | |||
| Party | Candidate | Votes | % | ± | |
|---|---|---|---|---|---|
| Conservative | Fred Silvester | 16,937 | 43.0 | ||
| Labour | Peter J. Hildrew | 14,936 | 37.8 | ||
| Liberal | Mrs. Nan Davies | 7,555 | 19.2 | ||
| Majority | 2,001 | 5.1 | |||
| Turnout | 39,428 | 67.8 | |||
| Conservative hold | Swing | ||||
| Party | Candidate | Votes | % | ± | |
|---|---|---|---|---|---|
| Conservative | Fred Silvester | 17,997 | 42.4 | ||
| Labour | Sholto N.M. Moxley | 13,584 | 32.0 | ||
| Liberal | Ian McWilliam-Fowler | 10,877 | 25.6 | ||
| Majority | 4,413 | 10.39 | |||
| Turnout | 73.6 | ||||
| Conservative hold | Swing | ||||
| Party | Candidate | Votes | % | ± | |
|---|---|---|---|---|---|
| Conservative | Robert Archibald Cary | 18,854 | 48.64 | ||
| Labour | Michael Alfred Noble | 13,365 | 39.64 | ||
| Liberal | James Clarney | 4,540 | 11.71 | ||
| Majority | 3,489 | 9.00 | |||
| Turnout | 67.84 | ||||
| Conservative hold | Swing | ||||
Elections in the 1960s
| Party | Candidate | Votes | % | ± | |
|---|---|---|---|---|---|
| Conservative | Robert Archibald Cary | 16,676 | 42.92 | ||
| Labour | David George Clark | 16,029 | 41.25 | ||
| Liberal | Geoffrey Vaughan Davies | 6,150 | 15.83 | ||
| Majority | 647 | 1.67 | |||
| Turnout | 71.18 | ||||
| Conservative hold | Swing | ||||
| Party | Candidate | Votes | % | ± | |
|---|---|---|---|---|---|
| Conservative | Robert Archibald Cary | 18,259 | 44.28 | ||
| Labour | Keith Openshaw | 13,117 | 31.18 | ||
| Liberal | Geoffrey Vaughan Davies | 9,860 | 23.91 | ||
| Majority | 5,142 | 12.47 | |||
| Turnout | 72.35 | ||||
| Conservative hold | Swing | ||||
Elections in the 1950s
| Party | Candidate | Votes | % | ± | |
|---|---|---|---|---|---|
| Conservative | Robert Archibald Cary | 23,170 | 52.28 | ||
| Labour | Robert Edward Sheldon | 13,476 | 30.41 | ||
| Liberal | Geoffrey Vaughan Davies | 7,675 | 17.32 | ||
| Majority | 9,694 | 21.84 | |||
| Turnout | 74.54 | ||||
| Conservative hold | Swing | ||||
| Party | Candidate | Votes | % | ± | |
|---|---|---|---|---|---|
| Conservative | Robert Archibald Cary | 25,707 | 58.64 | ||
| Labour | John B. Hayes | 13,054 | 29.78 | ||
| Liberal | Geoffrey Vaughan Davies | 5,077 | 11.58 | ||
| Majority | 12,653 | 28.86 | |||
| Turnout | 71.94 | ||||
| Conservative hold | Swing | ||||
| Party | Candidate | Votes | % | ± | |
|---|---|---|---|---|---|
| Conservative | Robert Archibald Cary | 26,804 | 64.73 | ||
| Labour | James Clough | 14,604 | 35.27 | ||
| Majority | 12,200 | 29.46 | |||
| Turnout | 80.29 | ||||
| Conservative hold | Swing | ||||
| Party | Candidate | Votes | % | ± | |
|---|---|---|---|---|---|
| Conservative | Frederick William Cundiff | 22,817 | 52.32 | ||
| Labour | Lewis Tatham Wright | 14,206 | 32.57 | ||
| Liberal | Leonard Frederick Behrens | 6,591 | 15.11 | ||
| Majority | 8,611 | 19.74 | |||
| Turnout | 85.31 | ||||
| Conservative hold | Swing | ||||
Election in the 1940s
| Party | Candidate | Votes | % | ± | |
|---|---|---|---|---|---|
| Conservative | Edward Lascelles Fleming | 30,881 | 46.4 | ||
| Labour | R. Edwards | 22,634 | 34.0 | ||
| Liberal | Leonard Frederick Behrens | 13,107 | 19.7 | ||
| Majority | 8,247 | 12.4 | |||
| Turnout | 74.5 | ||||
| Conservative hold | Swing | ||||
Election in the 1930s
| Party | Candidate | Votes | % | ± | |
|---|---|---|---|---|---|
| Conservative | Edward Lascelles Fleming | 35,564 | 62.27 | ||
| Labour | D. Scott Morton | 12,248 | 21.45 | ||
| Liberal | William C. Ross | 9,298 | 16.28 | ||
| Majority | 23,316 | 40.83 | |||
| Turnout | 70.89 | ||||
| Conservative hold | Swing | ||||
| Party | Candidate | Votes | % | ± | |
|---|---|---|---|---|---|
| Conservative | Edward Lascelles Fleming | 36,097 | 62.8 | +23.0 | |
| Liberal | Philip Guedalla | 21,379 | 37.2 | -6.6 | |
| Majority | 5,562 | 11.5 | 15.5 | ||
| Turnout | 48,168 | 75.8 | -2.0 | ||
| Conservative gain from Liberal | Swing | +14.8 | |||
Elections in the 1920s
| Party | Candidate | Votes | % | ± | |
|---|---|---|---|---|---|
| Liberal | Ernest Emil Darwin Simon | 20,948 | 43.8 | +4.8 | |
| Unionist | Sir Thomas Watts | 19,063 | 39.8 | -11.1 | |
| Labour | Joseph Robinson | 7,853 | 16.4 | +7.2 | |
| Majority | 1,885 | 4.0 | 15.9 | ||
| Turnout | 77.8 | -4.0 | |||
| Liberal gain from Unionist | Swing | +8.0 | |||
| Party | Candidate | Votes | % | ± | |
|---|---|---|---|---|---|
| Unionist | Thomas Watts | 13,633 | 50.9 | ||
| Liberal | Ernest Emil Darwin Simon | 10,435 | 39.0 | ||
| Labour | Edgar Whiteley | 2,467 | 9.2 | n/a | |
| Independent | Kenneth Burke | 236 | 0.9 | n/a | |
| Majority | 3,198 | 11.9 | |||
| Turnout | 81.8 | ||||
| Unionist gain from Liberal | Swing | ||||
| Party | Candidate | Votes | % | ± | |
|---|---|---|---|---|---|
| Liberal | Ernest Emil Darwin Simon | 13,944 | 58.2 | +9.7 | |
| Unionist | Thomas Watts | 10,026 | 41.8 | -9.7 | |
| Majority | 3,918 | 16.4 | 19.4 | ||
| Turnout | 78.0 | +0.6 | |||
| Liberal gain from Unionist | Swing | +9.7 | |||
| Party | Candidate | Votes | % | ± | |
|---|---|---|---|---|---|
| Unionist | Thomas Watts | 11,678 | 51.5 | -17.8 | |
| Liberal | Ernest Emil Darwin Simon | 11,008 | 48.5 | +17.8 | |
| Majority | 670 | 3.0 | -35.6 | ||
| Turnout | 77.4 | +16.4 | |||
| Unionist hold | Swing | -17.8 | |||
Elections in the 1910s
| Party | Candidate | Votes | % | ± | |
|---|---|---|---|---|---|
| Unionist | Alfred Deakin Carter | 11,677 | 69.3 | ||
| Liberal | George Frederick Burditt | 5,166 | 30.7 | ||
| Majority | 6,511 | 38.6 | |||
| Turnout | 16,843 | ||||
| Unionist hold | Swing | ||||
See also
- List of Parliamentary constituencies in Greater Manchester
- Opinion polling for the next United Kingdom general election in individual constituencies
Notes and references
- Notes
- ↑ A borough constituency (for the purposes of election expenses and type of returning officer)
- ↑ As with all constituencies, the constituency elects one Member of Parliament (MP) by the first past the post system of election at least every five years.
- References
- ↑ "Electorate Figures - Boundary Commission for England". 2011 Electorate Figures. Boundary Commission for England. 4 March 2011. Retrieved 13 March 2011.
- ↑ Leigh Rayment's Historical List of MPs – Constituencies beginning with "W" (part 4)
- 1 2 2001 Census
- ↑ Constituency Profile The Guardian
- ↑ "Election Data 2015". Electoral Calculus. Archived from the original on 17 October 2015. Retrieved 17 October 2015.
- ↑ "Manchester Withington". BBC News. Retrieved 11 May 2015.
- ↑ http://www.bbc.co.uk/news/uk-politics-25949029
- ↑ "Election Data 2010". Electoral Calculus. Archived from the original on 17 October 2015. Retrieved 17 October 2015.
- ↑ "Election Data 2005". Electoral Calculus. Archived from the original on 15 October 2011. Retrieved 18 October 2015.
- ↑ "Parliamentary Election Results 2005". manchester.gov.uk. Manchester City Council.
- ↑ "Election Data 2001". Electoral Calculus. Archived from the original on 15 October 2011. Retrieved 18 October 2015.
- ↑ "Election Data 1997". Electoral Calculus. Archived from the original on 15 October 2011. Retrieved 18 October 2015.
- ↑ "UK General Election results May 1997". Richard Kimber's Political Science Resources. Politics Resources. 1 May 1997. Retrieved 2011-09-22.
- ↑ "Election Data 1992". Electoral Calculus. Archived from the original on 15 October 2011. Retrieved 18 October 2015.
- ↑ "UK General Election results April 1992". Richard Kimber's Political Science Resources. Politics Resources. 9 April 1992. Retrieved 6 December 2010.
- ↑ "Election Data 1987". Electoral Calculus. Archived from the original on 15 October 2011. Retrieved 18 October 2015.
- ↑ "Election Data 1983". Electoral Calculus. Archived from the original on 15 October 2011. Retrieved 18 October 2015.
- ↑ UK General Election results: July 1945
- ↑ British parliamentary election results, 1918–1949 by FWS Craig