Bootle (UK Parliament constituency)
Coordinates: 53°26′46″N 2°59′20″W / 53.446°N 2.989°W
| Bootle | |
|---|---|
|
Borough constituency for the House of Commons | |
|
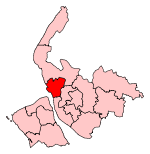
Boundary of Bootle in Merseyside. | |
|
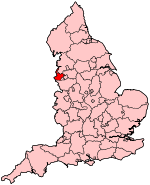
Location of Merseyside within England. | |
| County | Merseyside |
| Population | 98,449 (2011 census)[1] |
| Electorate | 70,824 (December 2010)[2] |
| Major settlements | Bootle |
| Current constituency | |
| Created | 1885 |
| Member of parliament | Peter Dowd (Labour) |
| Number of members | One |
| Overlaps | |
| European Parliament constituency | North West England |
Bootle is a constituency[n 1] which has been represented in the House of Commons of the UK Parliament by Peter Dowd of the Labour Party since 2015.[n 2]
History
The constituency was originally a Conservative seat, being represented by Conservative Party leader Andrew Bonar Law from 1911 until 1918 when property qualifications for the vote were abolished. A Liberal seat in the 1920s, it then became a Conservative - Labour marginal in the 1930s. The Labour Party has held it continually since the 1945 general election which saw two decades of steep decline in the profitability of Liverpool Docks, manufacturing and shipbuilding which employed many workers. In each general election from 1997 until 2010 it was the safest seat for any party in Britain.
In 1990, there were two by-elections in Bootle. The first followed the death of Allan Roberts on 21 February, and was held on 24 May. That by-election is remembered because Jack Holmes, the candidate of the continuing Social Democratic Party (representing the part of the SDP which did not merge with the Liberal Democrats) was humiliatingly beaten by Screaming Lord Sutch of the Official Monster Raving Loony Party. The victorious Labour candidate, Michael Carr, died on 20 July 1990 after just 57 days in office.
The second by-election, held on 8 November 1990, was won by Labour's Joe Benton. Benton held in subsequent elections with large majorities. In the 2005 election the seat both was the safest seat and also had the highest winning share of the vote.[3] In June 2014, Benton announced he would retire at the 2015 general election after 25 years as the seat's MP.
After the 2015 general election, Bootle is the fifth safest seat in the United Kingdom, with a winning vote share of 74.5% and a majority of 63.6%[4]
Constituency profile
The seat has some small neighbourhoods with middle-to-high incomes, but generally residents have some of the lowest UK incomes and there is a higher-than-average proportion of social housing.[5] The constituency has long been one of the safest seats in the United Kingdom and since 1983 has given majorities in excess of 50% to the Labour Party candidate at General Elections.
Boundaries
1885-1918: The Municipal Boroughs of Bootle-cum-Linacre and Liverpool, the civil parishes of Childwall, Fazakerley, Walton-on-the-Hill, and Wavertree, and parts of the civil parishes of Toxteth Park and West Derby.
1918-1950: The County Borough of Bootle.
1950-1955: The County Borough of Bootle, and the Urban District of Litherland.
1955-1974: The County Borough of Bootle.
1974-1983: The County Borough of Bootle, and the Urban District of Litherland.
1983-1997: The Metropolitan Borough of Sefton wards of Church, Derby, Ford, Linacre, Litherland, Netherton, Orrell, and St Oswald.
1997-2010: The Metropolitan Borough of Sefton wards of Derby, Ford, Linacre, Litherland, Netherton, Orrell, and St Oswald.
2010–present: The Metropolitan Borough of Sefton wards of Church, Derby, Ford, Linacre, Litherland, Netherton and Orrell, St Oswald, and Victoria.
The constituency covers the southern part of the Metropolitan Borough of Sefton in Merseyside. This comprises Bootle itself plus other localities including Crosby, Waterloo, Seaforth, Litherland, Netherton, Orrell and Ford.
Boundary changes that came into force as a result of the 2010 general election being called saw the constituency grow to also include parts of the old Crosby constituency, with the electoral wards of Church and Victoria being added. Although these areas are more affluent than some parts of Bootle, it has not changed the seat from being anything other than a safe Labour one.
Members of Parliament
Elections
Elections in the 2010s
| Party | Candidate | Votes | % | ± | |
|---|---|---|---|---|---|
| Labour | Peter Dowd | 33,619 | 74.5 | +8.0 | |
| UKIP | Paul Nuttall | 4,915 | 10.9 | +4.8 | |
| Conservative | Jade Marsden | 3,639 | 8.1 | -0.9 | |
| Green | Lisa Tallis | 1,501 | 3.3 | N/A | |
| Liberal Democrat | David Newman | 978 | 2.2 | -13.0 | |
| TUSC | Peter Glover | 500 | 1.1 | 0.0 | |
| Majority | 28,704 | 63.6 | +12.3 | ||
| Turnout | 45,152 | 64.4 | +6.6 | ||
| Labour hold | Swing | +1.6 | |||
| Party | Candidate | Votes | % | ± | |
|---|---|---|---|---|---|
| Labour | Joe Benton | 27,426 | 66.5 | −9.0 | |
| Liberal Democrat | James Murray | 6,245 | 15.1 | +3.5 | |
| Conservative | Sohail Qureshi | 3,678 | 8.9 | +2.8 | |
| UKIP | Paul Nuttall | 2,514 | 6.1 | +2.8 | |
| BNP | Charles Stewart | 942 | 2.3 | N/A | |
| TUSC | Peter Glover | 472 | 1.1 | N/A | |
| Majority | 21,181 | 51.3 | |||
| Turnout | 41,227 | 57.8 | 7.0 | ||
| Labour hold | Swing | −1.6 | |||
Elections in the 2000s
| Party | Candidate | Votes | % | ± | |
|---|---|---|---|---|---|
| Labour | Joe Benton | 19,345 | 75.5 | −2.1 | |
| Liberal Democrat | Chris Newby | 2,988 | 11.7 | +3.2 | |
| Conservative | Wafik Moustafa | 1,580 | 6.2 | −1.8 | |
| UKIP | Paul Nuttall | 1,054 | 4.1 | N/A | |
| Socialist Alternative | Peter Glover | 655 | 2.6 | +0.2 | |
| Majority | 16,357 | 63.8 | |||
| Turnout | 25,622 | 47.7 | −2.1 | ||
| Labour hold | Swing | −2.6 | |||
| Party | Candidate | Votes | % | ± | |
|---|---|---|---|---|---|
| Labour | Joe Benton | 21,400 | 77.6 | −5.3 | |
| Liberal Democrat | Jim Murray | 2,357 | 8.5 | +2.8 | |
| Conservative | Judith Symes | 2,194 | 8.0 | −0.5 | |
| Socialist Labour | Dave Flynn | 971 | 3.5 | +2.4 | |
| Socialist Alliance | Peter Glover | 672 | 2.4 | N/A | |
| Majority | 19,043 | 69.1 | |||
| Turnout | 27,594 | 49.8 | −17.0 | ||
| Labour hold | Swing | −5.3 | |||
Elections in the 1990s
| Party | Candidate | Votes | % | ± | |
|---|---|---|---|---|---|
| Labour | Joe Benton | 31,668 | 82.9 | +8.3 | |
| Conservative | Rupert Matthews | 3,247 | 8.5 | −7.5 | |
| Liberal Democrat | Kiron Reid | 2,191 | 5.7 | −0.9 | |
| Referendum | James Elliot | 571 | 1.5 | N/A | |
| Socialist Labour | Peter Glover | 420 | 1.1 | N/A | |
| Natural Law | Simon Cohen | 126 | 0.3 | −0.2 | |
| Majority | 28,421 | 74.4 | |||
| Turnout | 38,223 | 66.7 | −5.8 | ||
| Labour hold | Swing | +6.0 | |||
| Party | Candidate | Votes | % | ± | |
|---|---|---|---|---|---|
| Labour | Joe Benton | 37,464 | 74.6 | +7.7 | |
| Conservative | Christopher J. Varley | 8,022 | 16.0 | −4.1 | |
| Liberal Democrat | John Cunningham | 3,301 | 6.6 | −6.4 | |
| Liberal | Ms Medina Hall | 1,174 | 2.3 | N/A | |
| Natural Law | Thomas Haynes | 264 | 0.5 | N/A | |
| Majority | 29,442 | 58.6 | +11.8 | ||
| Turnout | 50,225 | 72.5 | −0.4 | ||
| Labour hold | Swing | +5.9 | |||
| Party | Candidate | Votes | % | ± | |
|---|---|---|---|---|---|
| Labour | Joe Benton | 22,052 | 78.2 | +2.8 | |
| Conservative | James Clappison | 2,587 | 9.2 | −0.1 | |
| Liberal Democrat | John Cunningham | 2,216 | 7.9 | −1.0 | |
| Green | Sean Brady | 557 | 2.0 | −1.6 | |
| Monster Raving Loony | Lord David Sutch | 310 | 1.1 | −0.1 | |
| Liberal | Kevin White | 291 | 1.0 | +0.3 | |
| Christian Alliance | David Black | 132 | 0.5 | +0.5 | |
| Majority | 19,465 | 69.1 | |||
| Turnout | 28,145 | 39.7 | −10.9 | ||
| Labour hold | Swing | +1.5 | |||
| Party | Candidate | Votes | % | ± | |
|---|---|---|---|---|---|
| Labour | Michael Carr | 26,737 | 75.4 | +8.5 | |
| Conservative | James Clappison | 3,220 | 9.1 | −11.0 | |
| Liberal Democrat | John Cunningham | 3,179 | 8.9 | −4.1 | |
| Green | Sean Brady | 1,269 | 3.6 | +3.6 | |
| Liberal | Kevin White | 474 | 1.3 | +1.3 | |
| Monster Raving Loony | Lord David Sutch | 418 | 1.2 | +1.2 | |
| Social Democratic | Jack Holmes | 155 | 0.4 | +0.4 | |
| Independent | T. J. Schofield | 27 | 0.1 | +0.1 | |
| Majority | 23,517 | 66.3 | |||
| Turnout | 35,477 | 50.6 | −22.3 | ||
| Labour hold | Swing | +9.8 | |||
Elections in the 1980s
| Party | Candidate | Votes | % | ± | |
|---|---|---|---|---|---|
| Labour | Allan Roberts | 34,975 | 66.9 | +13.9 | |
| Conservative | Peter Robert Papworth | 10,498 | 20.1 | −3.5 | |
| Social Democratic | Paul Victor Denham | 6,820 | 13.0 | −10.4 | |
| Majority | 24,477 | 46.8 | +17.4 | ||
| Turnout | 52,293 | 72.9 | +4.6 | ||
| Labour hold | Swing | +8.7 | |||
| Party | Candidate | Votes | % | ± | |
|---|---|---|---|---|---|
| Labour | Allan Roberts | 27,282 | 53.0 | −8.0 | |
| Conservative | Ronald Watson | 12,143 | 23.6 | −3.0 | |
| Social Democratic | John Wall | 12,068 | 23.4 | +13.1 | |
| Majority | 15,139 | 29.4 | −5.0 | ||
| Turnout | 51,493 | 68.3 | −2.1 | ||
| Labour hold | Swing | ||||
Elections in the 1970s
| Party | Candidate | Votes | % | ± | |
|---|---|---|---|---|---|
| Labour | Allan Roberts | 26,900 | 61.0 | −3.0 | |
| Conservative | Ronald Watson | 11,741 | 26.6 | +1.7 | |
| Liberal | D.L. Mahon | 4,531 | 10.3 | +0.4 | |
| Independent Liberal | H.I. Fjortoft | 911 | 2.1 | N/A | |
| Majority | 15,159 | 34.4 | −4.7 | ||
| Turnout | 44,083 | 70.4 | +3.2 | ||
| Labour hold | Swing | ||||
| Party | Candidate | Votes | % | ± | |
|---|---|---|---|---|---|
| Labour | Simon Mahon | 27,633 | 64.0 | +5.4 | |
| Conservative | J F Borrows | 10,743 | 24.9 | −1.7 | |
| Liberal | H.I. Fjortoft | 4,266 | 9.9 | 3−.6 | |
| Communist | R. Morris | 512 | 1.2 | −0.1 | |
| Majority | 16,890 | 39.1 | +7.1 | ||
| Turnout | 43,158 | 67.2 | −6.1 | ||
| Labour hold | Swing | +3.6 | |||
| Party | Candidate | Votes | % | ± | |
|---|---|---|---|---|---|
| Labour | Simon Mahon | 27,301 | 58.6 | −5.0 | |
| Conservative | J.F. Borrows | 12,366 | 26.6 | −9.8 | |
| Liberal | H.I. Fjortoft | 6,258 | 13.5 | N/A | |
| Communist | R. Morris | 586 | 1.3 | N/A | |
| Majority | 14,935 | 32.0 | |||
| Turnout | 46,511 | 73.3 | +8.1 | ||
| Labour hold | Swing | +2.4 | |||
| Party | Candidate | Votes | % | ± | |
|---|---|---|---|---|---|
| Labour | Simon Mahon | 20,101 | 63.6 | +3.2 | |
| Conservative | G. Halliwell | 11,496 | 36.4 | +2.8 | |
| Majority | 8,614 | 27.3 | |||
| Turnout | 31,633 | 65.2 | −3.0 | ||
| Labour hold | Swing | +0.2 | |||
Elections in the 1960s
| Party | Candidate | Votes | % | ± | |
|---|---|---|---|---|---|
| Labour | Simon Mahon | 19,412 | 60.4 | −1.6 | |
| Conservative | G. Halliwell | 10,813 | 33.6 | −4.4 | |
| Independent Labour | W. Grant | 1,931 | 6.0 | N/A | |
| Majority | 8,599 | 26.7 | |||
| Turnout | 32,156 | 68.2 | −2.7 | ||
| Labour hold | Swing | +1.4 | |||
| Party | Candidate | Votes | % | ± | |
|---|---|---|---|---|---|
| Labour | Simon Mahon | 21,677 | 62.0 | +8.3 | |
| Conservative | G Halliwell | 13,285 | 38.0 | −8.3 | |
| Majority | 8,392 | 24.0 | |||
| Turnout | 34,962 | 70.9 | −7.4 | ||
| Labour hold | Swing | +8.3 | |||
Elections in the 1950s
| Party | Candidate | Votes | % | ± | |
|---|---|---|---|---|---|
| Labour | Simon Mahon | 21,294 | 53.7 | +1.7 | |
| Conservative | H.O. Cullen | 18,379 | 46.3 | −1.7 | |
| Majority | 2,915 | 7.4 | |||
| Turnout | 39,673 | 78.3 | +2.6 | ||
| Labour hold | Swing | +1.7 | |||
| Party | Candidate | Votes | % | ± | |
|---|---|---|---|---|---|
| Labour | Simon Mahon | 19,020 | 52.0 | −0.7 | |
| Conservative | H.W. Jones | 17,582 | 48.0 | +3.3 | |
| Majority | 1,438 | 3.9 | |||
| Turnout | 36,602 | 75.7 | −5.5 | ||
| Labour hold | Swing | −2.0 | |||
| Party | Candidate | Votes | % | ± | |
|---|---|---|---|---|---|
| Labour | John Kinley | 26,597 | 52.7 | −0.1 | |
| Conservative | A O Hughes | 22,535 | 44.7 | −0.2 | |
| Anti-Partition | H. McHugh | 1,340 | 2.7 | +0.4 | |
| Majority | 4,062 | 8.1 | |||
| Turnout | 50,472 | 81.2 | −0.9 | ||
| Labour hold | Swing | +0.2 | |||
| Party | Candidate | Votes | % | ± | |
|---|---|---|---|---|---|
| Labour | John Kinley | 25,472 | 52.8 | −5.8 | |
| Conservative | W. Hill | 21,673 | 44.9 | +3.5 | |
| Anti-Partition | B McGinnity | 1,029 | 2.3 | N/A | |
| Majority | 3,799 | 7.9 | |||
| Turnout | 48,174 | 82.1 | +12.4 | ||
| Labour hold | Swing | −4.7 | |||
Elections in the 1940s
| Party | Candidate | Votes | % | ± | |
|---|---|---|---|---|---|
| Labour | John Kinley | 15,823 | 58.6 | +19.8 | |
| Conservative | Eric Errington | 11,180 | 41.4 | −7.2 | |
| Majority | 4,643 | 17.2 | |||
| Turnout | 27,003 | 69.7 | −1.6 | ||
| Labour gain from Conservative | Swing | ||||
Elections in the 1930s
| Party | Candidate | Votes | % | ± | |
|---|---|---|---|---|---|
| Conservative | Eric Errington | 16,653 | 48.6 | −13.3 | |
| Labour | John Kinley | 13,285 | 38.8 | +0.7 | |
| Liberal | James Burnie | 4,319 | 12.6 | ||
| Majority | 3,368 | 9.8 | −14.0 | ||
| Turnout | 34,257 | 71.3 | −7.6 | ||
| Conservative hold | Swing | ||||
| Party | Candidate | Votes | % | ± | |
|---|---|---|---|---|---|
| Conservative | Chichester de Windt Crookshank | 22,966 | 61.9 | +21.2 | |
| Labour | John Kinley | 14,160 | 38.1 | −5.5 | |
| Majority | 8,806 | 23.8 | |||
| Turnout | 37,126 | 78.9 | +1.0 | ||
| Conservative gain from Labour | Swing | ||||
Elections in the 1920s
| Party | Candidate | Votes | % | ± | |
|---|---|---|---|---|---|
| Labour | John Kinley | 15,294 | 43.6 | +8.9 | |
| Unionist | Vivian Leonard Henderson | 14,263 | 40.7 | −4.8 | |
| Liberal | Ernest Eric Edwards | 5,523 | 15.7 | −4.1 | |
| Majority | 1,031 | 2.9 | 13.7 | ||
| Turnout | 35,080 | 77.9 | +0.9 | ||
| Labour gain from Unionist | Swing | +6.8 | |||
| Party | Candidate | Votes | % | ± | |
|---|---|---|---|---|---|
| Unionist | Vivian Leonard Henderson | 12,361 | 45.5 | +3.4 | |
| Labour | John Kinley | 9,427 | 34.7 | +20.9 | |
| Liberal | James Burnie | 5,386 | 19.8 | −24.3 | |
| Majority | 2,934 | 10.8 | |||
| Turnout | 27,174 | 77.0 | +8.9 | ||
| Unionist gain from Liberal | Swing | ||||
| Party | Candidate | Votes | % | ± | |
|---|---|---|---|---|---|
| Liberal | James Burnie | 10,444 | 44.1 | −12.2 | |
| Unionist | Vivian Leonard Henderson | 9,991 | 42.1 | +0.2 | |
| Labour | John Kinley | 3,272 | 13.8 | n/a | |
| Majority | 453 | 2.0 | −12.4 | ||
| Turnout | 23,707 | 68.1 | −3.0 | ||
| Liberal hold | Swing | -6.2 | |||
| Party | Candidate | Votes | % | ± | |
|---|---|---|---|---|---|
| Liberal | James Burnie | 13,276 | 56.3 | ||
| Unionist | Sir Alexander Bicket | 9,867 | 41.9 | ||
| Independent | J E Burke | 425 | 1.8 | ||
| Majority | 3,409 | 14.4 | |||
| Turnout | 23,568 | 71.1 | |||
| Liberal gain from Unionist | Swing | ||||
Elections in the 1910s
| Party | Candidate | Votes | % | ± | |
|---|---|---|---|---|---|
| Unionist | 12,312 | 63.0 | |||
| Sailors' Union | Edmund Cathery | 7,235 | 37.0 | ||
| Majority | 5,077 | 26.0 | |||
| Turnout | 19,547 | 58.5 | |||
| Unionist hold | Swing | ||||
- endorsed by Coalition Government
| Party | Candidate | Votes | % | ± | |
|---|---|---|---|---|---|
| Conservative | Andrew Bonar Law | 9,976 | 56.2 | ||
| Liberal | Max Muspratt | 7,782 | 43.8 | ||
| Majority | 2,194 | 12.4 | |||
| Turnout | 17,758 | 69.7 | |||
| Conservative hold | Swing | ||||
| Party | Candidate | Votes | % | ± | |
|---|---|---|---|---|---|
| Conservative | Thomas Myles Sandys | Unopposed | |||
| Conservative hold | Swing | ||||
| Party | Candidate | Votes | % | ± | |
|---|---|---|---|---|---|
| Conservative | Thomas Myles Sandys | 9,954 | 52.9 | +1.8 | |
| Liberal | Dr W Permewan | 8,869 | 47.1 | -1.8 | |
| Majority | 1,085 | 5.8 | +3.6 | ||
| Turnout | 18,823 | 78.7 | +4.9 | ||
| Conservative hold | Swing | ||||
Elections in the 1900s
| Party | Candidate | Votes | % | ± | |
|---|---|---|---|---|---|
| Conservative | Thomas Myles Sandys | 7,821 | 51.1 | ||
| Liberal | Alfred Patten Thomas | 7,481 | 48.9 | ||
| Majority | 340 | 2.2 | |||
| Turnout | 15,302 | 73.8 | |||
| Conservative hold | Swing | ||||
| Party | Candidate | Votes | % | ± | |
|---|---|---|---|---|---|
| Conservative | Thomas Myles Sandys | Unopposed | |||
| Conservative hold | Swing | ||||
Elections in the 1890s
| Party | Candidate | Votes | % | ± | |
|---|---|---|---|---|---|
| Conservative | Thomas Myles Sandys | Unopposed | |||
| Conservative hold | Swing | ||||
| Party | Candidate | Votes | % | ± | |
|---|---|---|---|---|---|
| Conservative | Thomas Myles Sandys | 6,532 | 59.4 | ||
| Liberal | A McDougall | 4,460 | 40.6 | ||
| Majority | 2,072 | 18.8 | |||
| Turnout | 10,992 | 69.7 | |||
| Conservative hold | Swing | ||||
Elections in the 1880s
| Party | Candidate | Votes | % | ± | |
|---|---|---|---|---|---|
| Conservative | Thomas Myles Sandys | Unopposed | |||
| Conservative hold | Swing | ||||
| Party | Candidate | Votes | % | ± | |
|---|---|---|---|---|---|
| Conservative | Thomas Myles Sandys | 6,715 | 63.1 | N/A | |
| Liberal | S H Whitbread | 3,933 | 36.9 | N/A | |
| Majority | 2,782 | 26.2 | N/A | ||
| Turnout | 10,648 | 72.6 | N/A | ||
| Conservative win (new seat) | |||||
See also
Notes and references
- Notes
- ↑ A borough constituency (for the purposes of election expenses and type of returning officer)
- ↑ As with all constituencies, the constituency elects one Member of Parliament (MP) by the first past the post system of election at least every five years.
- References
- ↑ "Bootle: Usual Resident Population, 2011". Neighbourhood Statistics. Office for National Statistics. Retrieved 31 January 2015.
- ↑ "Electorate Figures - Boundary Commission for England". 2011 Electorate Figures. Boundary Commission for England. 4 March 2011. Archived from the original on 6 November 2010. Retrieved 13 March 2011.
- ↑ report, p14
- ↑ http://geo.digiminster.com/election/2015-05-07/Statistics/Majority
- ↑ 2001 Census
- ↑ Leigh Rayment's Historical List of MPs – Constituencies beginning with "B" (part 4)
- ↑ "Election Data 2015". Electoral Calculus. Archived from the original on 17 October 2015. Retrieved 17 October 2015.
- ↑ "Bootle". BBC News. Retrieved 10 May 2015.
- ↑ "Election Data 2010". Electoral Calculus. Archived from the original on 17 October 2015. Retrieved 17 October 2015.
- ↑ "Election Data 2005". Electoral Calculus. Archived from the original on 15 October 2011. Retrieved 18 October 2015.
- ↑ "Election Data 2001". Electoral Calculus. Archived from the original on 15 October 2011. Retrieved 18 October 2015.
- ↑ "Election Data 1997". Electoral Calculus. Archived from the original on 15 October 2011. Retrieved 18 October 2015.
- ↑ "Election Data 1992". Electoral Calculus. Archived from the original on 15 October 2011. Retrieved 18 October 2015.
- ↑ "UK General Election results April 1992". Richard Kimber's Political Science Resources. Politics Resources. 9 April 1992. Retrieved 2010-12-06.
- ↑ The changes and swing are calculated relative to the 1987 general election, not to either of the 1990 by-elections.
- ↑ "Election Data 1987". Electoral Calculus. Archived from the original on 15 October 2011. Retrieved 18 October 2015.
- ↑ "Election Data 1983". Electoral Calculus. Archived from the original on 15 October 2011. Retrieved 18 October 2015.
- Sources
- Election results, 1950 - 2005
- F. W. S. Craig, British Parliamentary Election Results 1885 - 1918
- F. W. S. Craig, British Parliamentary Election Results 1918 - 1949
External links
- nomis Constituency Profile for Bootle — presenting data from the ONS annual population survey and other official statistics.