Crewe and Nantwich (UK Parliament constituency)
| Crewe and Nantwich | |
|---|---|
|
County constituency for the House of Commons | |
|
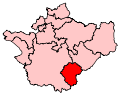
Boundary of Crewe and Nantwich in Cheshire. | |
|
Location of Cheshire within England. | |
| County | Cheshire |
| Electorate | 78,845 (December 2010)[1] |
| Current constituency | |
| Created | 1983 |
| Member of parliament | Edward Timpson (Conservative) |
| Number of members | One |
| Created from | Crewe and Nantwich |
| Overlaps | |
| European Parliament constituency | North West England |

Crewe and Nantwich is a constituency in Cheshire[n 1] represented in the House of Commons of the UK Parliament since 2008 by Edward Timpson of the Conservative Party.[n 2]
History
The constituency was created for the 1983 General Election. For 25 years the constituency elected the Labour MP Gwyneth Dunwoody. Dunwoody gained increasing majorities in the elections of 1987, 1992 and 1997. Her majority was slightly reduced in the 2001 and 2005 elections. Gwyneth Dunwoody died on 17 April 2008 leading to a by-election held on 22 May 2008 which was won by the Conservative candidate Edward Timpson.[2][3][4][5]
The by-election produced the first Conservative MP for the seat and nationally the first gain for a Conservative at a parliamentary by-election since the Mitcham and Morden by-election in 1982 during the Falklands War, and the first from Labour since the Ilford North by-election of 1978.
Boundaries
1983-1997: The Borough of Crewe and Nantwich wards of Acton, Alexandra, Audlem, Barony Weaver, Bunbury, Combermere, Coppenhall, Delamere, Grosvenor, Maw Green, Minshull, Peckforton, Queens Park, Ruskin Park, St Barnabas, St John's, Shavington, Waldron, Wellington, Weston Park, Willaston East, Willaston West, Wistaston, Wrenbury, and Wybunbury.
1997-2010: The Borough of Crewe and Nantwich wards of Alexandra, Barony Weaver, Coppenhall, Delamere, Grosvenor, Haslington, Maw Green, Queens Park, Ruskin Park, St Barnabas, St John's, Shavington, Waldron, Wellington, Weston Park, Willaston East, Willaston West, Wistaston, and Wybunbury.
2010-present: The Borough of Crewe and Nantwich wards of Alexandra, Barony Weaver, Birchin, Coppenhall, Delamere, Englesea, Grosvenor, Haslington, Leighton, Maw Green, St Barnabas, St John's, St Mary's, Shavington, Valley, Waldron, Wellington, Wells Green, Willaston, Wistaston Green, and Wybunbury.
The constituency was created from parts of the constituencies of Crewe and Nantwich. Crewe had elected Labour MPs since 1945, while Nantwich had only elected Conservative MPs since its creation in 1955.
The boundaries of the constituency include the towns of Crewe and Nantwich in the unitary authority of Cheshire East; however, much of the rural area west of Nantwich, and parts of the north of the town of Crewe are in the Eddisbury constituency. Part of Delamere Forest is included in its area.
Members of Parliament
| Election | Member[6] | Party | |
|---|---|---|---|
| 1983 | Gwyneth Dunwoody | Labour | |
| 2008 by-election | Edward Timpson | Conservative | |
Elections
Elections in the 2010s
| Party | Candidate | Votes | % | ± | |
|---|---|---|---|---|---|
| Conservative | Edward Timpson | 22,445 | 45.0 | -0.9 | |
| Labour | Adrian Heald | 18,825 | 37.7 | +3.7 | |
| UKIP | Richard Lee | 7,252 | 14.5 | +11.8 | |
| Liberal Democrat | Roy Wood | 1,374 | 2.8 | -12.2 | |
| Majority | 3,620 | 7.3 | -4.5 | ||
| Turnout | 49,896 | 67.4 | +1.5 | ||
| Conservative hold | Swing | -2.3 | |||
| Party | Candidate | Votes | % | ± | |
|---|---|---|---|---|---|
| Conservative | Edward Timpson | 23,420 | 45.8 | +12.9 | |
| Labour | David Williams | 17,374 | 34.0 | -14.4 | |
| Liberal Democrat | Roy Wood | 7,656 | 15 | -3.7 | |
| UKIP | James Clutton | 1,414 | 2.8 | N/A | |
| BNP | Phil Williams | 1,043 | 2.0 | N/A | |
| Independent | Mike Parsons | 177 | 0.3 | N/A | |
| Majority | 6,046 | 11.8 | N/A | ||
| Turnout | 51,084 | 65.9 | -2.0 | ||
| Conservative gain from Labour | Swing | +17.6 | |||
Elections in the 2000s
| Party | Candidate | Votes | % | ± | |
|---|---|---|---|---|---|
| Conservative | Edward Timpson | 20,539 | 49.5 | +16.9 | |
| Labour | Tamsin Dunwoody | 12,679 | 30.6 | -18.3 | |
| Liberal Democrat | Elizabeth Shenton | 6,040 | 14.6 | -4.0 | |
| UKIP | Mike Nattrass | 922 | 2.2 | N/A | |
| Green | Robert Smith | 359 | 0.9 | N/A | |
| English Democrat | David Roberts | 275 | 0.7 | N/A | |
| Monster Raving Loony | The Flying Brick | 236 | 0.6 | N/A | |
| Independent | Mark Walklate | 217 | 0.5 | N/A | |
| Cut Tax on Diesel and Petrol | Paul Thorogood | 118 | 0.3 | N/A | |
| Independent | Gemma Garrett | 113 | 0.3 | N/A | |
| Majority | 7,860 | 18.9 | N/A | ||
| Turnout | 41,498 | 58.2 | -2.0 | ||
| Conservative gain from Labour | Swing | +17.6 | |||
| Party | Candidate | Votes | % | ± | |
|---|---|---|---|---|---|
| Labour | Gwyneth Dunwoody | 21,240 | 48.8 | -5.5 | |
| Conservative | Eveleigh Moore-Dutton | 14,162 | 32.6 | +2.2 | |
| Liberal Democrat | Paul Roberts | 8,083 | 18.6 | +5.1 | |
| Majority | 7,078 | 16.9 | -7.3 | ||
| Turnout | 43,485 | 60.0 | -13.9 | ||
| Labour hold | Swing | -3.7 | |||
| Party | Candidate | Votes | % | ± | |
|---|---|---|---|---|---|
| Labour | Gwyneth Dunwoody | 22,556 | 54.3 | −3.9 | |
| Conservative | Donald Potter | 12,650 | 30.4 | +3.5 | |
| Liberal Democrat | David Cannon | 5,595 | 13.5 | +1.7 | |
| UKIP | Roger Croston | 746 | 1.8 | N/A | |
| Majority | 9,906 | 23.8 | -7.4 | ||
| Turnout | 41,547 | 60.2 | 0.0 | ||
| Labour hold | Swing | −3.8 | |||
Elections in the 1990s
| Party | Candidate | Votes | % | ± | |
|---|---|---|---|---|---|
| Labour | Gwyneth Dunwoody | 29,460 | 58.2 | +12.5 | |
| Conservative | Michael Loveridge | 13,662 | 27.0 | −14.3 | |
| Liberal Democrat | David Cannon | 5,940 | 11.7 | −0.2 | |
| Referendum | Peter Astbury | 1,543 | 3.0 | N/A | |
| Majority | 15,798 | 31.2 | +26.8 | ||
| Turnout | 50,605 | 73.7 | −8.2 | ||
| Labour hold | Swing | +13.4 | |||
| Party | Candidate | Votes | % | ± | |
|---|---|---|---|---|---|
| Labour | Gwyneth Dunwoody | 28,065 | 45.7 | +1.7 | |
| Conservative | Brian Silvester | 25,370 | 41.3 | −0.8 | |
| Liberal Democrat | Gwyn Griffiths | 7,315 | 11.9 | −2.0 | |
| Green | Natalie Wilkinson | 651 | 1.1 | N/A | |
| Majority | 2,695 | 4.4 | +2.5 | ||
| Turnout | 61,401 | 81.9 | +2.6 | ||
| Labour hold | Swing | +1.3 | |||
Elections in the 1980s
| Party | Candidate | Votes | % | ± | |
|---|---|---|---|---|---|
| Labour | Gwyneth Dunwoody | 25,457 | 44.0 | +2.9 | |
| Conservative | Angela Francis Browning | 24,365 | 42.1 | +1.5 | |
| Social Democratic | Kenneth Roberts | 8,022 | 13.9 | −4.4 | |
| Majority | 1,092 | 1.9 | +1.6 | ||
| Turnout | 57,844 | 79.3 | +4.6 | ||
| Labour hold | Swing | ||||
| Party | Candidate | Votes | % | ± | |
|---|---|---|---|---|---|
| Labour | Gwyneth Dunwoody | 22,031 | 41.1 | N/A | |
| Conservative | Patrick Rock | 21,741 | 40.6 | N/A | |
| Social Democratic | John Pollard | 9,820 | 18.3 | N/A | |
| Majority | 290 | 0.5 | N/A | ||
| Turnout | 53,592 | 74.7 | N/A | ||
| Labour win (new seat) | |||||
See also
Notes and references
- Notes
- ↑ A county constituency (for the purposes of election expenses and type of returning officer)
- ↑ As with all constituencies, the constituency elects one Member of Parliament (MP) by the first past the post system of election at least every five years.
- References
- ↑ "Electorate Figures - Boundary Commission for England". 2011 Electorate Figures. Boundary Commission for England. 4 March 2011. Archived from the original on 6 November 2010. Retrieved 13 March 2011.
- ↑ "MP Gwyneth Dunwoody dies aged 77". BBC News. 17 April 2008.
- ↑ "By-election to replace veteran MP". BBC News. 29 April 2008.
- 1 2 Watt, Nicholas (23 May 2008). "Conservatives win Crewe and Nantwich byelection with 7,860 majority". London: The Guardian. Retrieved 23 May 2008.
- 1 2 "Tories snatch Crewe from Labour". BBC News. 23 May 2008. Retrieved 23 May 2008.
Tory candidate Edward Timpson won 7,860 more votes than his Labour rival, overturning a 7,000 Labour majority at the general election - a 17.6% swing.
- ↑ Leigh Rayment's Historical List of MPs – Constituencies beginning with "C" (part 6)
- ↑ "Election Data 2015". Electoral Calculus. Archived from the original on 17 October 2015. Retrieved 17 October 2015.
- ↑ General Election 2015 - Crewe and Nantwich BBC News
- ↑ "Election Data 2010". Electoral Calculus. Archived from the original on 26 July 2013. Retrieved 17 October 2015.
- ↑ General Election 2010 - Crewe and Nantwich BBC News
- ↑ "Election Data 2005". Electoral Calculus. Archived from the original on 15 October 2011. Retrieved 18 October 2015.
- 1 2 3 4 "Aristotle: Crewe and Nantwich", Guardian Unlimited
- ↑ "Election Data 2001". Electoral Calculus. Archived from the original on 15 October 2011. Retrieved 18 October 2015.
- ↑ "Election Data 1997". Electoral Calculus. Archived from the original on 15 October 2011. Retrieved 18 October 2015.
- ↑ "Election Data 1992". Electoral Calculus. Archived from the original on 15 October 2011. Retrieved 18 October 2015.
- ↑ "UK General Election results April 1992". Richard Kimber's Political Science Resources. Politics Resources. 9 April 1992. Retrieved 6 December 2010.
- ↑ "Election Data 1987". Electoral Calculus. Archived from the original on 15 October 2011. Retrieved 18 October 2015.
- ↑ "UK General Election results June 1987". Political Science Resources.
- ↑ "Election Data 1983". Electoral Calculus. Archived from the original on 15 October 2011. Retrieved 18 October 2015.
- ↑ "UK General Election results June 1983". Political Science Resources.
Coordinates: 53°5′N 2°29′W / 53.083°N 2.483°W