Nuneaton (UK Parliament constituency)
| Nuneaton | |
|---|---|
|
County constituency for the House of Commons | |
|
Boundary of Nuneaton in Warwickshire. | |
|
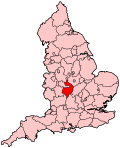
Location of Warwickshire within England. | |
| County | Warwickshire |
| Electorate | 68,288 (December 2010)[1] |
| Current constituency | |
| Created | 1885 |
| Member of parliament | Marcus Jones (Conservative) |
| Number of members | One |
| Created from | North Warwickshire |
| Overlaps | |
| European Parliament constituency | West Midlands |

Nuneaton is a constituency[n 1] represented in the House of Commons of the UK Parliament since 2010 by Marcus Jones, a Conservative.[n 2] Since 1997, the seat has been seen as an important national bellwether.[2]
In the 2015 general election, Nuneaton was the first key marginal seat between the Conservatives and Labour to declare its results.[3] Instead of seeing the predicted victory for Labour,[4] the seat saw a swing of 3.0% towards the Conservatives which proved to be a big indication that they were heading for victory in the 2015 general election, contrary to prior opinion poll projections.
Boundaries
1885-1918: The Sessional Division of Coventry, the Municipal Borough of Coventry, and part of the Sessional Divisions of Atherstone and Coleshill.
1918-1945: The Municipal Borough of Nuneaton, the Urban District of Bulkington, and the Rural Districts of Atherstone, Coventry, Foleshill, and Nuneaton.
1945-1955: The Municipal Borough of Nuneaton, the Urban District of Bedworth, and the Rural District of Atherstone.
1955-1974: The Municipal Borough of Nuneaton, and the Urban District of Bedworth.
1974-1983: The Municipal Borough of Nuneaton, and the Urban District of Bedworth as altered by the Coventry Order 1965.
1983-2010: The Borough of Nuneaton and Bedworth wards of Abbey, Arbury, Attleborough, Bulkington, Camp Hill, Chilvers Coton, Galley Common, St Nicolas, Stockingford, Weddington, and Whitestone, and the Borough of Rugby wards of Earl Craven, Fosse, and Wolvey.
2010-present: The Borough of Nuneaton and Bedworth wards of Abbey, Arbury, Attleborough, Bar Pool, Camp Hill, Galley Common, Kingswood, St Nicolas, Weddington, Wem Brook, and Whitestone, and the Borough of North Warwickshire wards of Arley and Whitacre, and Hartshill.
The boundary changes which took effect for the 1983 general election removed the town of Bedworth, which was transferred to the newly created North Warwickshire constituency. As a result, the sitting MP Les Huckfield declined to stand and unsuccessfully sought nomination in other constituencies such as Wigan[5] and Sedgefield.[6]
History
The constituency was created as a result of the Redistribution of Seats Act 1885, in an area whose population had expanded as coal miners poured in from other parts of the country. At one time 20 collieries operated in the area and now one of three major British coal mines continued with operations in the constituency at Daw Mill atop the Warwickshire Coalfield (known as the Warwickshire Thick) in the north of the county until 2012 when it closed. The associated heavy industry and mining-centred economy coupled with the Representation of the People Act 1918 (Fourth Reform Act) led to Nuneaton being held by the Labour Party for nearly 50 years until lost in the 1983 Conservative Landslide to Lewis Stevens, a Conservative who retained the seat in 1987.
Labour regained the constituency at the 1992 election. Bill Olner beat Stevens and retained the seat in 2001 and 2005. Olner announced in 2007 that he would not be contesting the 2010 general election and would be standing down at the end of the 2005-2010 parliament.[7] Former Nuneaton and Bedworth Council Leader, Marcus Jones was successful in taking the seat for the Conservative Party at the 2010 election and retained the seat in 2015.
2015 general election significance
In the 2015 general election, Nuneaton was the first marginal constituency between the Conservatives and Labour to declare its results. The result proved to be significant as it saw a 3.0% swing to the Conservatives, despite the seat being Labour's 38th biggest target[8] and Labour being predicted to win the seat.[4] The result therefore proved to be a major indication that the Conservatives were going to win a majority of seats in the House of Commons for the first time since the 1992 general election, something which went against national opinion polls which pointed towards Labour gains in the key marginal constituencies.[9]
It was later reported that the moment incumbent Prime Minister David Cameron knew his Conservative Party had won the general election was when Nuneaton declared its results at 1.53 am on the 8th May 2015.[10]
This has led to many pointing out the similarities between Nuneaton and the former constituency of Basildon which in 1987 and 1992, Labour unexpectedly failed to win. This is why the Nuneaton result has been seen as the 'Basildon Moment' of 2015, since the Basildon constituency similarly foreshadowed the Conservative's election victory in 1992.[11]
Labour's failure to win Nuneaton in the 2015 general election was seen as symbolic of their national failure. This meant Nuneaton was chosen by the Labour Party as the host of their first televised leadership debate during their 2015 leadership election.[12]
Members of Parliament
Elections
Elections in the 2010s
| Party | Candidate | Votes | % | ± | |
|---|---|---|---|---|---|
| Conservative | Marcus Jones | 20,827 | 45.5 | +4.0 | |
| Labour | Vicky Fowler | 15,945 | 34.9 | -2.0 | |
| UKIP | Alwyn Waine [15] | 6,582 | 14.4 | N/A | |
| Green | Keith Kondakor [16] | 1,281 | 2.8 | N/A | |
| Liberal Democrat | Christina Jebb [17] | 816 | 1.8 | -13.6 | |
| TUSC | Paul Reilly | 194 | 0.4 | N/A | |
| English Democrat | Steve Paxton | 104 | 0.2 | N/A | |
| Majority | 4,882 | 10.7 | +6.1 | ||
| Turnout | 45,749 | 67.2 | +1.4 | ||
| Conservative hold | Swing | +3.0 | |||
| Party | Candidate | Votes | % | ± | |
|---|---|---|---|---|---|
| Conservative | Marcus Jones | 18,536 | 41.5 | +4.6 | |
| Labour | Jayne Innes [20] | 16,467 | 36.9 | -9.8 | |
| Liberal Democrat | Christina Jebb | 6,846 | 15.3 | +2.8 | |
| BNP | Martyn Findley | 2,797 | 6.3 | N/A | |
| Majority | 2,069 | 4.6 | N/A | ||
| Turnout | 44,646 | 65.8 | +6.9 | ||
| Conservative gain from Labour | Swing | +7.2 | |||
Elections in the 2000s
| Party | Candidate | Votes | % | ± | |
|---|---|---|---|---|---|
| Labour | Bill Olner | 19,945 | 44.0 | -8.1 | |
| Conservative | Mark Pawsey | 17,665 | 39.0 | +4.3 | |
| Liberal Democrat | Ali Asghar | 5,884 | 13.0 | +1.9 | |
| UKIP | Keith Tyson | 1,786 | 3.9 | +1.9 | |
| Majority | 2,280 | 5.0 | -12.4 | ||
| Turnout | 45,279 | 61.7 | +1.6 | ||
| Labour hold | Swing | -6.2 | |||
| Party | Candidate | Votes | % | ± | |
|---|---|---|---|---|---|
| Labour | Bill Olner | 22,577 | 52.1 | -4.1 | |
| Conservative | Mark Lancaster | 15,042 | 34.7 | +3.8 | |
| Liberal Democrat | Tony Ferguson | 4,820 | 11.1 | +2.3 | |
| UKIP | Brian James | 873 | 2.0 | +1.5 | |
| Majority | 7,535 | 17.4 | -7.9 | ||
| Turnout | 43,312 | 60.1 | -14.3 | ||
| Labour hold | Swing | -3.95 | |||
Elections in the 1990s
| Party | Candidate | Votes | % | ± | |
|---|---|---|---|---|---|
| Labour | Bill Olner | 30,080 | 56.2 | +10.5 | |
| Conservative | Richard Blunt | 16,540 | 30.9 | -12.1 | |
| Liberal Democrat | Ron Cockings | 4,732 | 8.8 | -2.4 | |
| Referendum | Roy English | 1,533 | 2.9 | N/A | |
| Independent | David Bray | 390 | 0.7 | N/A | |
| UKIP | Peter Everitt | 238 | 0.5 | N/A | |
| Majority | 13,540 | 25.3 | +22.5 | ||
| Turnout | 53,513 | 74.4 | -8.6 | ||
| Labour hold | Swing | +11.3 | |||
| Party | Candidate | Votes | % | ± | |
|---|---|---|---|---|---|
| Labour | Bill Olner | 27,157 | 45.8 | +11.2 | |
| Conservative | Lewis Stevens | 25,526 | 43.0 | -1.9 | |
| Liberal Democrat | Ruth Merritt | 6,671 | 11.2 | -8.0 | |
| Majority | 1,631 | 2.8 | N/A | ||
| Turnout | 59,354 | 83.0 | +2.7 | ||
| Labour gain from Conservative | Swing | +6.55 | |||
Elections in the 1980s
| Party | Candidate | Votes | % | ± | |
|---|---|---|---|---|---|
| Conservative | Lewis Stevens | 24,630 | 44.9 | +4.4 | |
| Labour | Valerie Veness | 18,975 | 34.6 | +4.0 | |
| Liberal | Andrew Trembath | 10,550 | 19.2 | N/A | |
| Green | John Morrissey | 719 | 1.3 | N/A | |
| Majority | 5,655 | 10.3 | +0.4 | ||
| Turnout | 54,874 | 80.3 | +3.0 | ||
| Conservative hold | Swing | +0.2 | |||
| Party | Candidate | Votes | % | ± | |
|---|---|---|---|---|---|
| Conservative | Lewis Stevens | 20,666 | 40.5 | +2.8 | |
| Labour | John Haynes | 15,605 | 30.6 | -19.3 | |
| Social Democratic | Ruth Levitt | 14,264 | 28.0 | N/A | |
| Independent | GE Davies | 504 | 1.0 | +0.0 | |
| Majority | 5,061 | 9.9 | N/A | ||
| Turnout | 51,039 | 77.3 | -1.2 | ||
| Conservative gain from Labour | Swing | +11.05 | |||
Elections in the 1970s
| Party | Candidate | Votes | % | ± | |
|---|---|---|---|---|---|
| Labour | Leslie John Huckfield | 31,403 | 49.9 | -6.2 | |
| Conservative | Lewis Stevens | 23,715 | 37.7 | +12.5 | |
| Liberal | CEG Williams | 6,184 | 9.8 | -8.8 | |
| National Front | RP Matthews | 6,184 | 9.8 | -8.8 | |
| Independent | GE Davies | 504 | 1.0 | N/A | |
| Majority | 7,688 | 12.2 | -18.6 | ||
| Turnout | 62,959 | 78.5 | +4.6 | ||
| Labour hold | Swing | -9.35 | |||
| Party | Candidate | Votes | % | ± | |
|---|---|---|---|---|---|
| Labour | Leslie John Huckfield | 32,308 | 56.1 | +2.25 | |
| Conservative | R Freeman | 14,547 | 25.3 | -1.05 | |
| Liberal | N Hawkins | 10,729 | 18.6 | -1.19 | |
| Majority | 17,761 | 30.8 | +2.58 | ||
| Turnout | 57,584 | 73.9 | -8.51 | ||
| Labour hold | Swing | +1.65 | |||
| Party | Candidate | Votes | % | ± | |
|---|---|---|---|---|---|
| Labour | Leslie John Huckfield | 34,258 | 53.85 | -3.58 | |
| Conservative | D Samuel | 16,765 | 26.35 | -6.34 | |
| Liberal | D Inman | 12,491 | 19.79 | +10.00 | |
| Majority | 17,493 | 27.50 | +2.86 | ||
| Turnout | 63,614 | 82.41 | +6.21 | ||
| Labour hold | Swing | +1.38 | |||
| Party | Candidate | Votes | % | ± | |
|---|---|---|---|---|---|
| Labour | Leslie John Huckfield | 32,877 | 57.43 | +15.35 | |
| Conservative | Susan M Lewis-Smith | 18,769 | 32.79 | +0.06 | |
| Liberal | Alex DN Harrison | 5,602 | 9.79 | -7.85 | |
| Majority | 14,108 | 24.64 | +2.22 | ||
| Turnout | 57,248 | 76.20 | -3.48 | ||
| Labour hold | Swing | +7.65 | |||
Elections in the 1960s
| Party | Candidate | Votes | % | ± | |
|---|---|---|---|---|---|
| Labour | Leslie John Huckfield | 18,239 | 42.08 | -11.9 | |
| Conservative | David Laidlaw Knox | 14,185 | 32.73 | +1.17 | |
| Liberal | Alan Meredith | 7,644 | 17.64 | +3.18 | |
| All Party Alliance | John Creasey | 2,755 | 6.36 | N/A | |
| Independent | Donald Clifford Tyndall Bennett | 517 | 1.19 | N/A | |
| Majority | 4,054 | 9.35 | -13.07 | ||
| Turnout | 43,340 | 67.90 | -11.78 | ||
| Labour hold | Swing | -5.37 | |||
| Party | Candidate | Votes | % | ± | |
|---|---|---|---|---|---|
| Labour | Frank Cousins | 27,452 | 53.98 | +5.06 | |
| Conservative | David S Marland | 16,049 | 31.56 | -3.37 | |
| Liberal | Alan Meredith | 7,356 | 14.46 | -1.68 | |
| Majority | 11,403 | 22.42 | -1.28 | ||
| Turnout | 50,857 | 79.68 | -0.43 | ||
| Labour hold | Swing | +4.22 | |||
| Party | Candidate | Votes | % | ± | |
|---|---|---|---|---|---|
| Labour | Frank Cousins | 18,325 | 48.92 | -3.86 | |
| Conservative | David S Marland | 13,084 | 34.93 | +5.85 | |
| Liberal | John Campbell | 6,047 | 16.14 | -1.99 | |
| Majority | 5,241 | 13.99 | -9.71 | ||
| Turnout | 37,456 | 60.80 | -19.91 | ||
| Labour hold | Swing | -4.86 | |||
| Party | Candidate | Votes | % | ± | |
|---|---|---|---|---|---|
| Labour | Francis George Bowles | 26,059 | 52.78 | +0.34 | |
| Conservative | David S Marland | 14,357 | 29.08 | -3.26 | |
| Liberal | John Campbell | 8,953 | 18.13 | +2.91 | |
| Majority | 11,702 | 23.70 | +3.61 | ||
| Turnout | 49,369 | 80.11 | -1.69 | ||
| Labour hold | Swing | +1.80 | |||
Elections in the 1950s
| Party | Candidate | Votes | % | ± | |
|---|---|---|---|---|---|
| Labour | Francis George Bowles | 24,894 | 52.44 | -3.39 | |
| Conservative | Charles G Miller | 15,354 | 32.34 | -0.62 | |
| Liberal | John Campbell | 7,227 | 15.22 | +4.00 | |
| Majority | 9,540 | 20.09 | -2.77 | ||
| Turnout | 47,475 | 81.80 | -2.11 | ||
| Labour hold | Swing | -1.39 | |||
| Party | Candidate | Votes | % | ± | |
|---|---|---|---|---|---|
| Labour | Francis George Bowles | 25,112 | 55.83 | -5.8 | |
| Conservative | Robert Dermott D Griffith | 14,828 | 32.96 | +3.74 | |
| Liberal | John Beeching Frankenburg | 5,048 | 11.22 | +0.47 | |
| Majority | 10,284 | 22.86 | -7.94 | ||
| Turnout | 44,988 | 79.69 | -5.33 | ||
| Labour hold | Swing | -2.06 | |||
| Party | Candidate | Votes | % | ± | |
|---|---|---|---|---|---|
| Labour | Francis George Bowles | 35,651 | 60.03 | +1.33 | |
| Conservative | JE Tippett | 17,356 | 29.22 | +1.62 | |
| Liberal | GC Middleton | 6,386 | 10.75 | -2.95 | |
| Majority | 18,295 | 30.80 | -0.40 | ||
| Turnout | 59,393 | 85.02 | -2.28 | ||
| Labour hold | Swing | -0.15 | |||
| Party | Candidate | Votes | % | ± | |
|---|---|---|---|---|---|
| Labour | Francis George Bowles | 35,129 | 58.7 | ||
| Conservative | Mrs. Phylis G Spencer | 16,488 | 27.6 | ||
| Liberal | Jack A Harris | 8,177 | 13.7 | ||
| Majority | 18,641 | 31.2 | |||
| Turnout | 87.3 | ||||
| Labour hold | Swing | ||||
Elections in the 1940s
| Party | Candidate | Votes | % | ± | |
|---|---|---|---|---|---|
| Labour | Francis George Bowles | 30,587 | 58.5 | ||
| Conservative | Com. John Maurice Fitzroy-Newdegate | 12,267 | 23.4 | ||
| Liberal | Wing-Com. Peter John Ambrose Calvocoressi | 8,986 | 17.2 | ||
| Independent | Leonard Melling | 468 | 0.9 | ||
| Majority | 18,320 | 35.0 | |||
| Turnout | 78.7 | ||||
| Labour hold | Swing | ||||
| Party | Candidate | Votes | % | ± | |
|---|---|---|---|---|---|
| Labour | Francis George Bowles | unopposed | |||
| Labour hold | Swing | ||||
General Election 1939/40: Another general election was required to take place before the end of 1940. The political parties had been making preparations for an election to take place from 1939 and by the end of this year, the following candidates had been selected;
- Labour: Reginald Fletcher
Elections in the 1930s
| Party | Candidate | Votes | % | ± | |
|---|---|---|---|---|---|
| Labour | Reginald Thomas Herbert Fletcher | 33,237 | 48.4 | ||
| Conservative | John Moores | 28,000 | 40.8 | ||
| Liberal | William Thomas Stanton | 7,384 | 10.8 | ||
| Majority | 5,237 | 7.6 | |||
| Turnout | 68,621 | 75.9 | |||
| Labour gain from Conservative | Swing | ||||
| Party | Candidate | Votes | % | ± | |
|---|---|---|---|---|---|
| Conservative | Edward Tempest Tunstall North | 25,839 | 41.7 | ||
| Labour | Francis Samuel Smith | 23,375 | 37.7 | ||
| Liberal National | Herbert Willison | 12,811 | 20.6 | ||
| Majority | 2,464 | 4.0 | |||
| Turnout | 62,025 | 78.0 | |||
| Conservative gain from Labour | Swing | ||||
Elections in the 1920s
| Party | Candidate | Votes | % | ± | |
|---|---|---|---|---|---|
| Labour | Francis Samuel Smith | 27,102 | 44.4 | +13.1 | |
| Liberal | Herbert Willison | 19,104 | 31.3 | +0.3 | |
| Unionist | Arthur Oswald James Hope | 14,189 | 24.3 | -13.4 | |
| Majority | 7,998 | 13.1 | 19.5 | ||
| Turnout | 84.1 | +5.4 | |||
| Labour gain from Unionist | Swing | +13.2 | |||
| Party | Candidate | Votes | % | ± | |
|---|---|---|---|---|---|
| Unionist | Arthur Oswald James Hope | 15,242 | 37.7 | +7.2 | |
| Labour | Francis Samuel Smith | 12,679 | 31.3 | +2.2 | |
| Liberal | Herbert Willison | 12,550 | 31.0 | -9.4 | |
| Majority | 2,563 | 6.4 | |||
| Turnout | 78.7 | ||||
| Unionist gain from Liberal | Swing | n/a | |||
| Party | Candidate | Votes | % | ± | |
|---|---|---|---|---|---|
| Liberal | Herbert Willison | 14,518 | 40.4 | +11.2 | |
| Unionist | Sir Henry Maddocks | 10,940 | 30.5 | -7.8 | |
| Labour | Thomas Barron | 10,437 | 29.1 | -3.4 | |
| Majority | 3,578 | 9.9 | 15.7 | ||
| Turnout | 72.6 | +2.8 | |||
| Liberal gain from Unionist | Swing | +9.5 | |||
| Party | Candidate | Votes | % | ± | |
|---|---|---|---|---|---|
| Unionist | Henry Maddocks | 12,765 | 38.3 | -7.9 | |
| Labour | J Stevenson | 10,842 | 32.5 | +6.7 | |
| Liberal | T Slack | 9,730 | 29.2 | +5.7 | |
| Majority | 1,923 | 5.8 | -14.6 | ||
| Turnout | 69.8 | +13.9 | |||
| Unionist hold | Swing | -7.3 | |||
Elections in the 1910s
| Party | Candidate | Votes | % | ± | |
|---|---|---|---|---|---|
| Unionist | 11,198 | 46.2 | |||
| Labour | Ivor Gregory | 6,269 | 25.8 | ||
| Liberal | William Henry Grant | 5,707 | 23.5 | ||
| National Democratic | William Henry Dyson | 1,101 | 4.5 | ||
| Majority | 4,929 | 20.4 | |||
| Turnout | 55.9 | ||||
| Unionist gain from Liberal | Swing | ||||
- denotes candidate who was endorsed by the Coalition Government.
See also
References
Craig, F. W. S. (1983). British parliamentary election results 1918-1949 (3 ed.). Chichester: Parliamentary Research Services. ISBN 0-900178-06-X.
Notes and references
- Notes
- ↑ A county constituency (for the purposes of election expenses and type of returning officer)
- ↑ As with all constituencies, the constituency elects one Member of Parliament (MP) by the first past the post system of election at least every five years.
- References
- ↑ "Electorate Figures - Boundary Commission for England". 2011 Electorate Figures. Boundary Commission for England. 4 March 2011. Retrieved 13 March 2011.
- ↑ Editorial, Reuters. "Parliamentary bellwether Nuneaton votes strongly for Leave". Retrieved 2016-09-17.
- ↑ "Conservatives win Nuneaton key battleground". BBC News. Retrieved 2016-05-16.
- 1 2 http://lordashcroftpolls.com/wp-content/uploads/2015/03/NuneatonCX3-March-2015-Full-tables.pdf
- ↑ Alamanac of British Politics, 3rd edition, Robert Waller
- ↑ "The glittering prize", The Telegraph, 16 July 2000 accessed 24 April 2010
- ↑ Coventry Telegraph 27 March 2007 Accessed 26 November 2007
- ↑ http://labourlist.org/2013/01/labours-106-battleground-target-seats-for-2015/
- ↑ Holehouse, Matthew (17 March 2015). "Labour ahead in key marginals". The Daily Telegraph. London.
- ↑ Walker, Peter (2015-05-12). "Can the explanation for Labour's election failure be found in Nuneaton?". The Guardian. ISSN 0261-3077. Retrieved 2016-09-17.
- ↑ "Why Nuneaton was the Basildon of 2015". BBC News. 13 May 2015.
- ↑ http://www.theguardian.com/politics/2015/jun/14/nuneaton-labour-party-voters-rejected
- ↑ Leigh Rayment's Historical List of MPs – Constituencies beginning with "N" (part 3)
- ↑ "Election Data 2015". Electoral Calculus. Archived from the original on 17 October 2015. Retrieved 17 October 2015.
- ↑ http://www.coventrytelegraph.net/news/local-news/wife-expelled-tory-stand-ukip-8309064
- ↑ http://www.nuneaton-news.co.uk/Green-councillor-joins-MP-battle/story-24521088-detail/story.html
- ↑ http://www.libdems.org.uk/list_of_selected_candidates
- ↑ "Election Data 2010". Electoral Calculus. Archived from the original on 17 October 2015. Retrieved 17 October 2015.
- ↑ "UK > England > West Midlands > Nuneaton". Election 2010. BBC. 7 May 2010. Retrieved 11 May 2010.
- ↑ http://news.bbc.co.uk/1/shared/election2010/results/constituency/d42.stm
- ↑ "Election Data 2005". Electoral Calculus. Archived from the original on 15 October 2011. Retrieved 18 October 2015.
- ↑ "Results for Nuneaton".
- ↑ "Election Data 2001". Electoral Calculus. Archived from the original on 15 October 2011. Retrieved 18 October 2015.
- ↑ "Nuneaton". BBC News.
- ↑ "Election Data 1997". Electoral Calculus. Archived from the original on 15 October 2011. Retrieved 18 October 2015.
- ↑ "Election Data 1992". Electoral Calculus. Archived from the original on 15 October 2011. Retrieved 18 October 2015.
- ↑ "Politics Resources". Election 1992. Politics Resources. 9 April 1992. Retrieved 2010-12-06.
- ↑ "Election Data 1987". Electoral Calculus. Archived from the original on 15 October 2011. Retrieved 18 October 2015.
- ↑ "Election Data 1983". Electoral Calculus. Archived from the original on 15 October 2011. Retrieved 18 October 2015.
- ↑ British Parliamentary Election Results 1918-1949, FWS Craig
External links
Coordinates: 52°30′N 1°27′W / 52.50°N 1.45°W