Solihull (UK Parliament constituency)
| Solihull | |
|---|---|
|
Borough constituency for the House of Commons | |
|
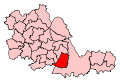
Boundary of Solihull in West Midlands. | |
|
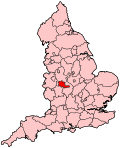
Location of West Midlands within England. | |
| County | West Midlands |
| Electorate | 77,354 (December 2010)[1] |
| Major settlements | Solihull |
| Current constituency | |
| Created | 1945 |
| Member of parliament | Julian Knight (Conservative) |
| Number of members | One |
| Overlaps | |
| European Parliament constituency | West Midlands |
Solihull is a constituency[n 1] represented in the House of Commons of the UK Parliament since 2015 by Julian Knight, a Conservative.[n 2]
Boundaries
1945-1974: The Urban District of Solihull.
1974-1983: The County Borough of Solihull.
1983–present: The Metropolitan Borough of Solihull wards of Elmdon, Lyndon, Olton, St Alphege, Shirley East, Shirley South, Shirley West, and Silhill.
The constituency is one of two covering the Metropolitan Borough of Solihull. It covers the town of Solihull itself, as well as Shirley and Olton. It is a largely well-off, residential area, in the south-east of the West Midlands conurbation.
History
The Conservative Party held the seat since it was established in 1945 until 2005.
In the 2005 general election it was won by the Liberal Democrats, with Lorely Burt beating the incumbent John Taylor by a majority of 279 votes. Burt won the seat again at the 2010 general election, this time by just 175 votes following two recounts. Since 2015 the seat has been represented by Julian Knight, who holds the seat with a majority of 12,902 beating incumbent Lorely Burt.
Constituency profile
The Solihull area is home to some of the West Midlands's more affluent residents and includes a high proportion of Birmingham workers and the managerial classes in manufacturing, retail, industry and the public sector. There are smaller villages and undeveloped green belt areas in its peripheral countryside, though the seat is primarily suburban and middle-class, with low levels of deprivation throughout. Workless claimants stood at only 2% of the population in November 2012, below every regional average in the UK. In the study of that date, only three of the 59 West Midlands seats had a lower proportion of registered jobseekers.[2]
Following boundary changes, the northernmost tip of the seat now contains the point in England furthest from the coast in any direction.
Members of Parliament
| Election | Member[3] | Party | |
|---|---|---|---|
| 1945 | Sir Martin Lindsay | Conservative | |
| 1964 | Percy Grieve | Conservative | |
| 1983 | John Mark Taylor | Conservative | |
| 2005 | Lorely Burt | Liberal Democrat | |
| 2015 | Julian Knight | Conservative | |
Elections
Elections in the 2010s
| Party | Candidate | Votes | % | ± | |
|---|---|---|---|---|---|
| Conservative | Julian Knight | 26,956 | 49.2 | +6.6 | |
| Liberal Democrat | Lorely Burt | 14,054 | 25.7 | -17.2 | |
| UKIP | Phil Henrick[6] | 6,361 | 11.6 | +9.4 | |
| Labour | Nigel Knowles | 5,693 | 10.4 | +1.5 | |
| Green | Howard Allen | 1,632 | 3.0 | N/A | |
| An Independence from Europe | Mike Nattrass | 50 | 0.1 | N/A | |
| Democratic | Matthew J. Ward | 33 | 0.1 | N/A | |
| Majority | 12,902 | 23.6 | |||
| Turnout | 54,779 | 70.9 | -1.36 | ||
| Conservative gain from Liberal Democrat | Swing | +6.6 | |||
| Party | Candidate | Votes | % | ± | |
|---|---|---|---|---|---|
| Liberal Democrat | Lorely Burt | 23,635 | 42.9 | +3.5 | |
| Conservative | Maggie Throup | 23,460 | 42.6 | +2.9 | |
| Labour | Sarah Merrill | 4,891 | 8.9 | -6.7 | |
| BNP | Andrew Terry | 1,624 | 2.9 | -0.5 | |
| UKIP | John Ison | 1,200 | 2.2 | +0.3 | |
| Solihull and Meriden Residents' Association | Neill Watts | 319 | 0.6 | N/A | |
| Majority | 175 | 0.3 | |||
| Turnout | 55,129 | 71.9 | +4.5 | ||
| Liberal Democrat hold | Swing | +0.3 | |||
- Due to Boundary Changes this seat was notionally Conservative, even though it was previously held by the Liberal Democrats, making it a Liberal Democrat gain.
Elections in the 2000s
| Party | Candidate | Votes | % | ± | |
|---|---|---|---|---|---|
| Liberal Democrat | Lorely Burt | 20,896 | 39.9 | +13.9 | |
| Conservative | John Mark Taylor | 20,617 | 39.4 | -6.0 | |
| Labour | Rory Vaughan | 8,058 | 15.4 | -10.2 | |
| BNP | Diane Carr | 1,752 | 3.3 | N/A | |
| UKIP | Andrew Moore | 990 | 1.9 | -0.3 | |
| Majority | 279 | 0.5 | |||
| Turnout | 52,313 | 63.1 | +4.7 | ||
| Liberal Democrat gain from Conservative | Swing | +10.0 | |||
| Party | Candidate | Votes | % | ± | |
|---|---|---|---|---|---|
| Conservative | John Mark Taylor | 21,935 | 45.4 | +0.8 | |
| Liberal Democrat | Jo Byron | 12,528 | 26.0 | +0.7 | |
| Labour | Brendan O’Brien | 12,373 | 25.6 | +1.3 | |
| UKIP | Andy Moore | 1,061 | 2.2 | N/A | |
| ProLife Alliance | Mary Pyne | 374 | 0.8 | -0.3 | |
| Majority | 9,407 | 19.4 | |||
| Turnout | 48,271 | 63.3 | -11.4 | ||
| Conservative hold | Swing | ||||
Elections in the 1990s
| Party | Candidate | Votes | % | ± | |
|---|---|---|---|---|---|
| Conservative | John Mark Taylor | 26,299 | 44.7 | -16.1 | |
| Liberal Democrat | Michael J. Southcombe | 14,902 | 25.3 | 4.3 | |
| Labour | Mrs. Rachel N. Harris | 14,334 | 24.3 | 7.6 | |
| Referendum | Mike Nattrass | 2,748 | 4.7 | N/a | |
| ProLife Alliance | Jim Caffery | 623 | 1.1 | N/a | |
| Majority | 11,397 | 19.35 | -20.55 | ||
| Turnout | 58,906 | 74.6 | -7.0 | ||
| Conservative hold | Swing | −10.3 | |||
| Party | Candidate | Votes | % | ± | |
|---|---|---|---|---|---|
| Conservative | John Mark Taylor | 38,385 | 60.8 | −0.2 | |
| Liberal Democrat | Michael J. Southcombe | 13,239 | 21.0 | −3.0 | |
| Labour | Mrs Nicola Kutapan | 10,544 | 16.7 | +1.7 | |
| Green | Clifford G. Hards | 925 | 1.5 | N/A | |
| Majority | 25,146 | 39.9 | +2.7 | ||
| Turnout | 63,093 | 81.6 | +6.5 | ||
| Conservative hold | Swing | +1.4 | |||
Elections in the 1980s
| Party | Candidate | Votes | % | ± | |
|---|---|---|---|---|---|
| Conservative | John Mark Taylor | 35,844 | 61.07 | ||
| Liberal | Geoff E. Gadie | 14,058 | 23.95 | ||
| Labour | Sue E. Knowles | 8,791 | 14.98 | ||
| Majority | 21,786 | 37.12 | |||
| Turnout | 75.13 | ||||
| Conservative hold | Swing | ||||
| Party | Candidate | Votes | % | ± | |
|---|---|---|---|---|---|
| Conservative | John Mark Taylor | 31,947 | 60.76 | ||
| Liberal | I. Gillett | 14,553 | 27.68 | ||
| Labour | I. Jamieson | 6,075 | 11.55 | ||
| Majority | 17,394 | 33.08 | |||
| Turnout | 71.36 | ||||
| Conservative hold | Swing | ||||
Elections in the 1970s
| Party | Candidate | Votes | % | ± | |
|---|---|---|---|---|---|
| Conservative | Percy Grieve | 43,027 | 66.16 | ||
| Labour | David Hallam | 10,820 | 16.64 | ||
| Liberal | I. Gillett | 10,214 | 15.70 | ||
| National Front | D. Stevenson | 978 | 1.50 | ||
| Majority | 32,207 | 49.52 | |||
| Turnout | 77.18 | ||||
| Conservative hold | Swing | ||||
| Party | Candidate | Votes | % | ± | |
|---|---|---|---|---|---|
| Conservative | Percy Grieve | 31,707 | 52.67 | ||
| Liberal | J.A. Windmill | 15,848 | 26.33 | ||
| Labour | Denis MacShane | 12,640 | 21.00 | ||
| Majority | 15,859 | 26.35 | |||
| Turnout | 75.25 | ||||
| Conservative hold | Swing | ||||
| Party | Candidate | Votes | % | ± | |
|---|---|---|---|---|---|
| Conservative | Percy Grieve | 35,049 | 54.47 | ||
| Liberal | J.A. Windmill | 17,686 | 27.49 | ||
| Labour | D.A. Norman | 11,608 | 18.04 | ||
| Majority | 17,363 | 26.99 | |||
| Turnout | 81.30 | ||||
| Conservative hold | Swing | ||||
| Party | Candidate | Votes | % | ± | |
|---|---|---|---|---|---|
| Conservative | Percy Grieve | 37,756 | 64.29 | ||
| Labour | D. Gray | 13,181 | 22.44 | ||
| Liberal | R.A. Davis | 7,795 | 13.27 | ||
| Majority | 24,575 | 41.84 | |||
| Turnout | 72.14 | ||||
| Conservative hold | Swing | ||||
Elections in the 1960s
| Party | Candidate | Votes | % | ± | |
|---|---|---|---|---|---|
| Conservative | Percy Grieve | 34,008 | 65.69 | ||
| Labour | D.A. Forwood | 17,760 | 34.31 | ||
| Majority | 16,248 | 31.39 | |||
| Turnout | 74.80 | ||||
| Conservative hold | Swing | ||||
| Party | Candidate | Votes | % | ± | |
|---|---|---|---|---|---|
| Conservative | Percy Grieve | 32,355 | 59.45 | ||
| Labour | T.W.K. Scott | 11,969 | 21.99 | ||
| Liberal | L. Farell | 10,097 | 18.55 | ||
| Majority | 20,386 | 37.46 | |||
| Turnout | 80.46 | ||||
| Conservative hold | Swing | ||||
Elections in the 1950s
| Party | Candidate | Votes | % | ± | |
|---|---|---|---|---|---|
| Conservative | Sir Martin Lindsay | 35,862 | 73.88 | ||
| Labour | E.J. Bowen | 12,682 | 26.12 | ||
| Majority | 23,180 | 47.75 | |||
| Turnout | 80.60 | ||||
| Conservative hold | Swing | ||||
| Party | Candidate | Votes | % | ± | |
|---|---|---|---|---|---|
| Conservative | Sir Martin Lindsay | 29,323 | 72.18 | ||
| Labour | M. Large | 11,300 | 27.82 | ||
| Majority | 18,023 | 44.37 | |||
| Turnout | 78.28 | ||||
| Conservative hold | Swing | ||||
| Party | Candidate | Votes | % | ± | |
|---|---|---|---|---|---|
| Conservative | Sir Martin Lindsay | 27,871 | 70.35 | ||
| Labour | J. Johnson | 11,747 | 29.65 | ||
| Majority | 16,124 | 40.70 | |||
| Turnout | 83.18 | ||||
| Conservative hold | Swing | ||||
| Party | Candidate | Votes | % | ± | |
|---|---|---|---|---|---|
| Conservative | Sir Martin Lindsay | 25,758 | 63.28 | ||
| Labour | W.N. Camp | 11,741 | 28.84 | ||
| Liberal | Mrs Ada M Hayes | 3,206 | 7.88 | ||
| Majority | 14,017 | 34.44 | |||
| Turnout | 86.92 | ||||
| Conservative hold | Swing | ||||
Election in the 1940s
| Party | Candidate | Votes | % | ± | |
|---|---|---|---|---|---|
| Conservative | Sir Martin Lindsay | 26,696 | 55.22 | ||
| Labour | Roy Jenkins | 21,647 | 44.78 | ||
| Majority | 5,049 | 10.44 | |||
| Turnout | 71.79 | ||||
| Conservative win | |||||
See also
Notes
- ↑ A borough constituency (for the purposes of election expenses and type of returning officer)
- ↑ As with all constituencies, the constituency elects one Member of Parliament (MP) by the first past the post system of election at least every five years.
References
- ↑ "Electorate Figures - Boundary Commission for England". 2011 Electorate Figures. Boundary Commission for England. 4 March 2011. Retrieved 13 March 2011.
- ↑ Unemployment claimants by constituency The Guardian
- ↑ Leigh Rayment's Historical List of MPs – Constituencies beginning with "S" (part 3)
- ↑ "Election Data 2015". Electoral Calculus. Archived from the original on 17 October 2015. Retrieved 17 October 2015.
- ↑ "Solihull Results". bbc.co.uk.
- ↑ http://ukpollingreport.co.uk/2015guide/solihull/
- ↑ "Election Data 2010". Electoral Calculus. Archived from the original on 17 October 2015. Retrieved 17 October 2015.
- ↑ BBC Election 2010, Solihull
- ↑ "Election Data 2005". Electoral Calculus. Archived from the original on 15 October 2011. Retrieved 18 October 2015.
- ↑ "Election Data 2001". Electoral Calculus. Archived from the original on 15 October 2011. Retrieved 18 October 2015.
- ↑ "Election Data 1992". Electoral Calculus. Archived from the original on 15 October 2011. Retrieved 18 October 2015.
- ↑ "UK General Election results April 1992". Richard Kimber's Political Science Resources. Politics Resources. 9 April 1992. Retrieved 2010-12-06.
- ↑ "Election Data 1987". Electoral Calculus. Archived from the original on 15 October 2011. Retrieved 18 October 2015.
- ↑ "Election Data 1983". Electoral Calculus. Archived from the original on 15 October 2011. Retrieved 18 October 2015.
Coordinates: 52°25′N 1°47′W / 52.41°N 1.78°W