Coventry North East (UK Parliament constituency)
| Coventry North East | |
|---|---|
|
Borough constituency for the House of Commons | |
|
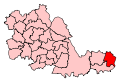
Boundary of Coventry North East in West Midlands. | |
|
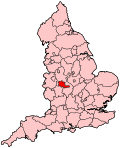
Location of West Midlands within England. | |
| County | West Midlands |
| Electorate | 74,870 (December 2010)[1] |
| Major settlements | Coventry |
| Current constituency | |
| Created | 1974 |
| Member of parliament | Colleen Fletcher (Labour) |
| Number of members | One |
| Created from | Coventry North, Coventry East |
| Overlaps | |
| European Parliament constituency | West Midlands |
Coventry North East is a constituency[n 1] represented in the House of Commons of the UK Parliament from the 2015 General Election by Colleen Fletcher of the Labour Party.[n 2]
Boundaries
1974-1983: The County Borough of Coventry wards of Foleshill, Henley, Longford, Upper Stoke, and Wyken.
1983-1997: The City of Coventry wards of Foleshill, Henley, Longford, Upper Stoke, and Wyken.
1997-present: The City of Coventry wards of Foleshill, Henley, Longford, Lower Stoke, Upper Stoke, and Wyken.
Based entirely within the borough of Coventry, the seat of Coventry North East includes the Stoke, Walsgrave-on-Sowe, Wyken, Longford, and Foleshill areas of the cathedral city.
Constituency profile
In the seat is a wide demographic mix, across it is scattered an above UK average level of social housing and unemployment claimants however income is close to the UK average.[2] The constituency has a large ethnic minority population, mainly Sikhs and Muslims and one ward, Foleshill, has a majority ethnic minority population.
History
Since its 1974 creation the area has been a Labour Party stronghold with the Conservative Party finishing second. The Liberal Democrats including their two predecessor parties amassed their largest shares of the vote in 1983 and in 2010 on 16.6% of the vote. In 2010 between 2% and 5% of the vote were a British National Party, Socialist and UKIP candidates completing the choice of seven was a Christian party's candidate who attracted the least votes.
Members of Parliament
| Election | Member[3] | Party | |
|---|---|---|---|
| Feb 1974 | George Park | Labour | |
| 1987 | John Hughes | Labour | |
| 1992 | Bob Ainsworth | Labour | |
| 2015 | Colleen Fletcher | Labour | |
Elections
Elections in the 2010s
| Party | Candidate | Votes | % | ± | |
|---|---|---|---|---|---|
| Labour | Colleen Fletcher [5] | 22,025 | 52.2 | +2.9 | |
| Conservative | Michelle Lowe | 9,751 | 23.1 | +0.9 | |
| UKIP | Avtar Taggar | 6,278 | 14.9 | +11.9 | |
| Liberal Democrat | Russell Field [6] | 2,007 | 4.8 | −11.9 | |
| Green | Matthew Handley[7] | 1,245 | 2.9 | +2.9 | |
| TUSC | Nicky Downes | 633 | 1.5 | +1.5 | |
| Christian Movement for Great Britain | William Sidhu | 292 | 0.7 | −0.3 | |
| Majority | 12,274 | 29.1 | +2 | ||
| Turnout | 42,231 | 55.3 | −4.1 | ||
| Labour hold | Swing | ||||
| Party | Candidate | Votes | % | ± | |
|---|---|---|---|---|---|
| Labour | Bob Ainsworth | 21,384 | 49.3 | −7.6 | |
| Conservative | Hazel Noonan | 9,609 | 22.1 | +3.3 | |
| Liberal Democrat | Russell Field | 7,210 | 16.6 | +0.1 | |
| BNP | Tom Gower | 1,863 | 4.3 | N/A | |
| Socialist Alternative | Dave Nellist | 1,592 | 3.7 | −1.2 | |
| UKIP | Christ Forbes | 1,291 | 3.0 | −0.1 | |
| Christian Movement for Great Britain | Ron Lebar | 434 | 1.0 | N/A | |
| Majority | 11,775 | 27.1 | |||
| Turnout | 43,383 | 59.4 | +6.0 | ||
| Labour hold | Swing | −5.5 | |||
Elections in the 2000s
| Party | Candidate | Votes | % | ± | |
|---|---|---|---|---|---|
| Labour | Bob Ainsworth | 21,178 | 56.94 | −4.1 | |
| Conservative | Jaswant Singh Birdi | 6,956 | 18.70 | −0.1 | |
| Liberal Democrat | Russell Field | 6,123 | 16.46 | +5.3 | |
| Socialist Alternative | Dave Nellist | 1,874 | 5.04 | −2.1 | |
| UKIP | Paul Sootheran | 1,064 | 2.9 | N/A | |
| Majority | 14,222 | 38.24 | −4.0 | ||
| Turnout | 37,195 | 52.97 | +2.61 | ||
| Labour hold | Swing | −2.0 | |||
| Party | Candidate | Votes | % | ± | |
|---|---|---|---|---|---|
| Labour | Bob Ainsworth | 22,739 | 61.0 | −5.2 | |
| Conservative | Gordon Bell | 6,988 | 18.8 | −0.6 | |
| Liberal Democrat | Geoffrey Sewards | 4,163 | 11.2 | +3.1 | |
| Socialist Alliance | Dave Nellist | 2,638 | 7.1 | N/A | |
| BNP | Edward Sheppard | 737 | 2.0 | N/A | |
| Majority | 15,751 | 42.2 | |||
| Turnout | 37,265 | 50.3 | −14.5 | ||
| Labour hold | Swing | ||||
Elections in the 1990s
| Party | Candidate | Votes | % | ± | |
|---|---|---|---|---|---|
| Labour | Bob Ainsworth | 31,856 | 66.3 | +16.6 | |
| Conservative | Michael Burnett | 9,287 | 19.3 | −8.7 | |
| Liberal Democrat | Geoffrey Sewards | 3,866 | 8.0 | −2.5 | |
| Liberal | Nick Brown | 1,181 | 2.5 | N/A | |
| Referendum | Ron Hurrell | 1,125 | 2.3 | N/A | |
| Socialist Labour | Hanna Khamis | 597 | 1.2 | N/A | |
| Rainbow Dream Ticket | Christopher Sidwell | 173 | 0.4 | N/A | |
| Majority | 22,569 | 47.0 | |||
| Turnout | 48,085 | 64.8 | |||
| Labour hold | Swing | ||||
| Party | Candidate | Votes | % | ± | |
|---|---|---|---|---|---|
| Labour | Bob Ainsworth | 24,896 | 52.5 | −1.8 | |
| Conservative | Keith R. Perrin | 13,220 | 27.9 | −1.5 | |
| Liberal Democrat | Vincent J. McKee | 5,306 | 11.2 | −4.6 | |
| Independent Labour | John Hughes | 4,008 | 8.5 | N/A | |
| Majority | 11,676 | 24.6 | −0.3 | ||
| Turnout | 47,430 | 73.2 | +2.7 | ||
| Labour hold | Swing | −0.2 | |||
Elections in the 1980s
| Party | Candidate | Votes | % | ± | |
|---|---|---|---|---|---|
| Labour | John Hughes | 25,832 | 54.3 | +6.5 | |
| Conservative | Charles Campbell Leathes Prior | 13,965 | 29.3 | +0.4 | |
| Liberal | Stephen Woods | 7,502 | 15.8 | −6.3 | |
| Communist | Michael Anthony McNally | 310 | 0.7 | +0.3 | |
| Majority | 11,867 | 24.9 | +6.0 | ||
| Turnout | 47,573 | 70.5 | +1.3 | ||
| Labour hold | Swing | ||||
| Party | Candidate | Votes | % | ± | |
|---|---|---|---|---|---|
| Labour | George MacLean Park | 22,190 | 47.8 | −9.5 | |
| Conservative | D. Weeks | 13,415 | 28.9 | −6.1 | |
| Social Democratic | D. Simmons | 10,251 | 22.1 | +18.1 | |
| Workers Revolutionary | R. Prince | 342 | 0.7 | −0.1 | |
| Communist | J. Meacham | 193 | 0.4 | −0.4 | |
| Majority | 8,775 | 18.9 | −3.4 | ||
| Turnout | 46,389 | 69.2 | +1.3 | ||
| Labour hold | Swing | ||||
Elections in the 1970s
| Party | Candidate | Votes | % | ± | |
|---|---|---|---|---|---|
| Labour | George MacLean Park | 27,010 | 57.3 | −2.2 | |
| Conservative | Earl of Shelburne | 16,487 | 35.0 | +11.4 | |
| Liberal | Raj-Mal Singh | 2,291 | 4.9 | −10.5 | |
| National Front | H. Robbins | 546 | 1.2 | N/A | |
| Communist | Paul David Corrigan | 390 | 0.8 | +0.1 | |
| Workers Revolutionary | S. Perkin | 378 | 0.8 | +0.0 | |
| Majority | 10,523 | 22.3 | |||
| Turnout | 47,062 | 72.7 | |||
| Labour hold | Swing | −6.8 | |||
| Party | Candidate | Votes | % | ± | |
|---|---|---|---|---|---|
| Labour | George MacLean Park | 26,489 | 59.5 | −4.4 | |
| Conservative | I. Clarke | 10,520 | 23.6 | −8.0 | |
| Liberal | R. Dredge | 6,846 | 15.4 | N/A | |
| Workers Revolutionary | A. Wilkins | 352 | 0.8 | N/A | |
| Communist | John Hosey | 309 | 0.7 | −1.1 | |
| Majority | 15,969 | 35.9 | |||
| Turnout | 44,516 | 70.0 | |||
| Labour hold | Swing | +1.8 | |||
| Party | Candidate | Votes | % | ± | |
|---|---|---|---|---|---|
| Labour | George MacLean Park | 30,496 | 63.9 | N/A | |
| Conservative | Francis Nigel Forman | 15,069 | 31.6 | N/A | |
| People | A. Pickard | 1,332 | 2.8 | N/A | |
| Communist | John Hosey | 838 | 1.8 | N/A | |
| Majority | 15,427 | 32.3 | N/A | ||
| Turnout | 47,735 | 75.5 | N/A | ||
| Labour win (new seat) | |||||
See also
Notes and references
- Notes
- ↑ A borough constituency (for the purposes of election expenses and type of returning officer)
- ↑ As with all constituencies, the constituency elects one Member of Parliament (MP) by the first past the post system of election at least every five years.
- References
- ↑ "Electorate Figures - Boundary Commission for England". 2011 Electorate Figures. Boundary Commission for England. 4 March 2011. Archived from the original on November 6, 2010. Retrieved 13 March 2011.
- ↑ 2001 Census
- ↑ Leigh Rayment's Historical List of MPs – Constituencies beginning with "C" (part 6)
- ↑ "Election Data 2015". Electoral Calculus. Archived from the original on 17 October 2015. Retrieved 17 October 2015.
- ↑ http://electionresults.blogspot.co.uk/2013/04/coventry-north-east-2015.html
- ↑ "List of selected candidates". Liberal Democrats. 4 March 2015. Retrieved 15 March 2015.
- ↑ https://my.greenparty.org.uk/candidates/105903
- ↑ "Election Data 2010". Electoral Calculus. Archived from the original on 17 October 2015. Retrieved 17 October 2015.
- ↑ "UK > England >West Midlands > Coventry North East". Election 2010. BBC. 7 May 2010. Retrieved 14 May 2010.
- ↑ "Election Data 2005". Electoral Calculus. Archived from the original on 15 October 2011. Retrieved 18 October 2015.
- ↑ "Election Data 2001". Electoral Calculus. Archived from the original on 15 October 2011. Retrieved 18 October 2015.
- ↑ "Election Data 1997". Electoral Calculus. Archived from the original on 15 October 2011. Retrieved 18 October 2015.
- ↑ "Election Data 1992". Electoral Calculus. Archived from the original on 15 October 2011. Retrieved 18 October 2015.
- ↑ "UK General Election results April 1992". Richard Kimber's Political Science Resources. Politics Resources. 9 April 1992. Retrieved 2010-12-06.
- ↑ "Election Data 1987". Electoral Calculus. Archived from the original on 15 October 2011. Retrieved 18 October 2015.
- ↑ "Election Data 1983". Electoral Calculus. Archived from the original on 15 October 2011. Retrieved 18 October 2015.
Coordinates: 52°26′N 1°28′W / 52.43°N 1.47°W