Alfred-Pellan
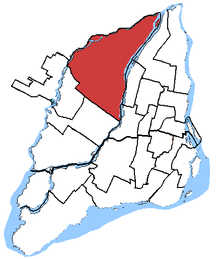 Alfred-Pellan in relation to other Montreal federal electoral districts | |||
| Federal electoral district | |||
| Legislature | House of Commons | ||
| MP |
| ||
| District created | 2003 | ||
| First contested | 2004 | ||
| Last contested | 2015 | ||
| District webpage | profile, map | ||
| Demographics | |||
| Population (2011)[1] | 98,045 | ||
| Electors (2015) | 77,898 | ||
| Area (km²)[2] | 116 | ||
| Pop. density (per km²) | 845.2 | ||
| Census divisions | Laval | ||
| Census subdivisions | Laval | ||
Alfred-Pellan (formerly Duvernay and Laval East) is a federal electoral district in Quebec, Canada, that has been represented in the House of Commons of Canada since 1968. Its population in 2006 was 104,765.
Geography
The district includes the neighbourhoods of Duvernay, Pont-Viau, Saint-François, Saint-Vincent-de-Paul and the eastern part of the neighbourhood of Vimont in the City of Laval.
The neighbouring ridings are Marc-Aurèle-Fortin, Terrebonne—Blainville, Montcalm, Honoré-Mercier, Ahuntsic, and Vimy.
History
The riding was created in 1968 from Laval and was known as Duvernay until 1990 when it became Laval East. Upon redistribution in 2003 it was renamed Alfred-Pellan, and lost a small part of its territory to the newly created Marc-Aurèle-Fortin riding.
The riding lost territory to Vimy and Marc-Aurèle-Fortin during the 2012 electoral redistribution.
Member of Parliament
This riding has elected the following Member of Parliament:
| Parliament | Years | Member | Party | |
|---|---|---|---|---|
| Duvernay Riding created from Laval |
||||
| 28th | 1968–1972 | Eric Kierans | Liberal | |
| 29th | 1972–1974 | Yves Demers | ||
| 30th | 1974–1979 | |||
| 31st | 1979–1980 | |||
| 32nd | 1980–1984 | |||
| 33rd | 1984–1988 | Vincent Della Noce | Progressive Conservative | |
| 34th | 1988–1993 | |||
| Laval East | ||||
| 35th | 1993–1997 | Maud Debien | Bloc Québécois | |
| 36th | 1997–2000 | |||
| 37th | 2000–2004 | Carole-Marie Allard | Liberal | |
| Alfred-Pellan | ||||
| 38th | 2004–2006 | Robert Carrier | Bloc Québécois | |
| 39th | 2006–2008 | |||
| 40th | 2008–2011 | |||
| 41st | 2011–2015 | Rosane Doré Lefebvre | New Democratic | |
| 42nd | 2015–Present | Angelo Iacono | Liberal | |
Election results
Alfred-Pellan, 2003 - present
| Canadian federal election, 2015: Alfred-Pellan | ||||||||
|---|---|---|---|---|---|---|---|---|
| Party | Candidate | Votes | % | ∆% | Expenditures | |||
| Liberal | Angelo Iacono | 24,557 | 44.51 | +22.19 | – | |||
| New Democratic | Rosane Doré Lefebvre | 13,225 | 23.97 | -18.24 | – | |||
| Bloc Québécois | Daniel St-Hilaire | 9,836 | 17.83 | -4.52 | $39,790.52 | |||
| Conservative | Gabriel Purcarus | 6,259 | 11.35 | +0.14 | $8,181.47 | |||
| Green | Lynda Briguene | 1,089 | 1.97 | +0.52 | $4,610.57 | |||
| Independent | Renata Isopo | 203 | 0.37 | – | – | |||
| Total valid votes/Expense limit | 55,169 | 100.0 | $212,103.04 | |||||
| Total rejected ballots | 679 | – | – | |||||
| Turnout | 55,848 | 71.34 | – | |||||
| Eligible voters | 78,288 | |||||||
| Liberal gain from New Democratic | Swing | +20.22 | ||||||
| Source: Elections Canada[3][4] | ||||||||
| 2011 federal election redistributed results[5] | |||
|---|---|---|---|
| Party | Vote | % | |
| New Democratic | 20,329 | 42.21 | |
| Bloc Québécois | 10,766 | 22.35 | |
| Liberal | 10,751 | 22.32 | |
| Conservative | 5,398 | 11.21 | |
| Green | 697 | 1.45 | |
| Others | 219 | 0.45 | |
| Canadian federal election, 2011 | ||||||||
|---|---|---|---|---|---|---|---|---|
| Party | Candidate | Votes | % | ∆% | ||||
| New Democratic | Rosane Doré Lefebvre | 23,098 | 42.09 | +30.06 | ||||
| Bloc Québécois | Robert Carrier | 12,504 | 22.79 | -16.04 | ||||
| Liberal | Angelo Iacono | 12,070 | 22.00 | -7.27 | ||||
| Conservative | Pierre Lefebvre | 6,157 | 11.22 | -5.04 | ||||
| Green | Dylan Perceval-Maxwell | 798 | 1.45 | -1.68 | ||||
| Independent | Régent Millette | 245 | 0.45 | -0.04 | ||||
| Total valid votes/Expense limit | 54,872 | 100.00 | ||||||
| Total rejected ballots | 745 | 1.34 | -0.02 | |||||
| Turnout | 55,617 | 65.91 | -0.14 | |||||
| New Democratic gain from Bloc Québécois | Swing | +23.05 | ||||||
| Canadian federal election, 2008: Alfred-Pellan | ||||||||
|---|---|---|---|---|---|---|---|---|
| Party | Candidate | Votes | % | ∆% | Expenditures | |||
| Bloc Québécois | Robert Carrier | 20,686 | 38.83 | −4.14 | $59,983 | |||
| Liberal | Wilson Saintelmy | 15,594 | 29.27 | +1.68 | $51,830 | |||
| Conservative | Alexandre Salameh | 8,662 | 16.26 | −2.66 | $72,184 | |||
| New Democratic | Cynthia Roy | 6,406 | 12.03 | +4.92 | $3,131 | |||
| Green | Tristan Desjardins Drouin | 1,665 | 3.13 | −0.28 | $325 | |||
| Independent | Régent Millette | 259 | 0.49 | – | none listed | |||
| Total valid votes | 53,272 | 100.00 | ||||||
| Total rejected ballots | 737 | 1.36 | ||||||
| Turnout | 54,009 | 66.05 | ||||||
| Electors on the lists | 81,766 | |||||||
| Canadian federal election, 2006 | ||||||||
|---|---|---|---|---|---|---|---|---|
| Party | Candidate | Votes | % | ∆% | Expenditures | |||
| Bloc Québécois | Robert Carrier | 23,193 | 42.97 | -6.23 | $40,539 | |||
| Liberal | Jean-Claude Gobe | 14,895 | 27.59 | -12.00 | $78,159 | |||
| Conservative | Rosanne Raymond | 10,210 | 18.92 | +13.85 | $16,233 | |||
| New Democratic | Martin Leduc | 3,838 | 7.11 | +3.64 | $4,371 | |||
| Green | Christien Lajoie | 1,842 | 3.41 | +1.29 | ||||
| Total valid votes/Expense limit | 53,978 | 100.00 | $80,448 | |||||
| Total rejected ballots | 791 | 1.44 | ||||||
| Turnout | 54,769 | 68.18 | +2.13 | |||||
| Canadian federal election, 2004: Alfred-Pellan | ||||||||
|---|---|---|---|---|---|---|---|---|
| Party | Candidate | Votes | % | ∆% | Expenditures | |||
| Bloc Québécois | Robert Carrier | 26,239 | 49.20 | +6.65 | $38,963 | |||
| Liberal | Carole-Marie Allard | 21,116 | 39.59 | −5.18 | $70,978 | |||
| Conservative | Rosane Raymond | 2,703 | 5.07 | −3.21 | $10,199 | |||
| New Democratic | Benjamin Le Bel | 1,849 | 3.47 | +2.48 | $2,108 | |||
| Green | Louis-Philippe Verenka | 1,132 | 2.12 | +0.98 | $0 | |||
| Independent | Yves Denois | 204 | 0.38 | – | none listed | |||
| Independent | Régent Millette | 89 | 0.17 | −0.27 | none listed | |||
| Total valid votes | 53,232 | 100.00 | ||||||
| Total rejected ballots | 1,128 | 2.07 | ||||||
| Turnout | 54,460 | 67.95 | ||||||
| Electors on the lists | 80,148 | |||||||
| Note: Conservative vote is compared to the total of the Canadian Alliance vote and Progressive Conservative vote in the 2000 election. | ||||||||
Laval East, 1990 - 2003
| Canadian federal election, 2000: Laval East | ||||||||
|---|---|---|---|---|---|---|---|---|
| Party | Candidate | Votes | % | ∆% | Expenditures | |||
| Liberal | Carole-Marie Allard | 26,018 | 44.77 | +12.66 | $69,391 | |||
| Bloc Québécois | Mathieu Alarie | 24,726 | 42.55 | +4.09 | $71,179 | |||
| Progressive Conservative | André G. Plourde | 2,459 | 4.23 | −23.93 | none listed | |||
| Alliance | Rosane Raymond | 2,354 | 4.05 | – | $877 | |||
| Marijuana | Christian Lajoie | 892 | 1.53 | – | $157 | |||
| Green | Frédéric Gauvin | 660 | 1.14 | – | $108 | |||
| New Democratic | Sujata Dey | 573 | 0.99 | −0.28 | none listed | |||
| Independent | Régent Millette | 255 | 0.44 | – | none listed | |||
| Marxist–Leninist | Gabriel Cornellier-Brunelle | 178 | 0.31 | – | $10 | |||
| Total valid votes | 58,115 | 100.00 | ||||||
| Total rejected ballots | 1,535 | |||||||
| Turnout | 59,650 | 68.75 | ||||||
| Electors on the lists | 86,759 | |||||||
| Sources: Official Results, Elections Canada and Financial Returns, Elections Canada. | ||||||||
| Canadian federal election, 1997 | ||||||||
|---|---|---|---|---|---|---|---|---|
| Party | Candidate | Votes | % | ∆% | ||||
| Bloc Québécois | Maud Debien | 23,093 | 38.46 | -13.48 | ||||
| Liberal | Nathalie Paradis | 19,279 | 32.11 | +5.27 | ||||
| Progressive Conservative | Vincent Della Noce | 16,912 | 28.16 | +9.80 | ||||
| New Democratic | Peter Graefe | 765 | 1.27 | +0.18 | ||||
| Total valid votes | 60,049 | 100.00 | ||||||
| Canadian federal election, 1993 | ||||||||
|---|---|---|---|---|---|---|---|---|
| Party | Candidate | Votes | % | ∆% | ||||
| Bloc Québécois | Maud Debien | 31,491 | 51.94 | – | ||||
| Liberal | Raymonde Folco | 16,270 | 26.84 | +3.93 | ||||
| Progressive Conservative | Vincent Della Noce | 11,131 | 18.36 | -42.38 | ||||
| New Democratic | Stéphane Houle | 662 | 1.09 | -13.72 | ||||
| Natural Law | Denis Cauchon | 587 | 0.97 | – | ||||
| Abolitionist | Denise Beaubien | 363 | 0.60 | – | ||||
| Commonwealth of Canada | François Lépine | 125 | 0.21 | -0.46 | ||||
| Total valid votes | 60,629 | 100.00 | ||||||
Duvernay, 1966 - 1990
| Canadian federal election, 1988 | ||||||||
|---|---|---|---|---|---|---|---|---|
| Party | Candidate | Votes | % | ∆% | ||||
| Progressive Conservative | Vincent Della Noce | 33,426 | 60.47 | +10.38 | ||||
| Liberal | Pierre Amaranian | 12,607 | 22.91 | -8.21 | ||||
| New Democratic | Michel Agnaieff | 8,147 | 14.81 | +6.36 | ||||
| Social Credit | Émilien Martel | 480 | 0.87 | +0.58 | ||||
| Commonwealth of Canada | Brigitte Bergeron | 368 | 0.67 | +0.56 | ||||
| Total valid votes | 55,028 | 100.00 | ||||||
| Canadian federal election, 1984 | ||||||||
|---|---|---|---|---|---|---|---|---|
| Party | Candidate | Votes | % | ∆% | ||||
| Progressive Conservative | Vincent Della Noce | 29,877 | 50.36 | +42.72 | ||||
| Liberal | Yves Demers | 18,465 | 31.12 | -41.31 | ||||
| New Democratic | John Shatilla | 5,013 | 8.45 | -2.17 | ||||
| Nationaliste | Denis Monière | 3,195 | 5.39 | – | ||||
| Rhinoceros | Patrice Charlot St-Onge | 2,088 | 3.52 | -1.68 | ||||
| Independent | A. Léo Larocque | 453 | 0.76 | – | ||||
| Social Credit | Émilien Martel | 174 | 0.29 | -2.94 | ||||
| Commonwealth of Canada | Pierre Leheurteux | 66 | 0.11 | – | ||||
| Total valid votes | 59,331 | 100.00 | ||||||
| Canadian federal election, 1980 | ||||||||
|---|---|---|---|---|---|---|---|---|
| Party | Candidate | Votes | % | ∆% | ||||
| Liberal | Yves Demers | 34,560 | 72.43 | +4.30 | ||||
| New Democratic | John Shatilla | 5,069 | 10.62 | +5.14 | ||||
| Progressive Conservative | Pierre Pelletier | 3,647 | 7.64 | -0.38 | ||||
| Rhinoceros | Pierre Elliott Vaillancourt | 2,479 | 5.20 | +2.12 | ||||
| Social Credit | Émilien Martel | 1,542 | 3.23 | -11.15 | ||||
| Union populaire | Roger-Marc Lalande | 218 | 0.46 | +0.04 | ||||
| Marxist–Leninist | Sylvie Bourgeois | 112 | 0.23 | -0.01 | ||||
| Communist | Jacques Grenier | 88 | 0.18 | -0.06 | ||||
| Total valid votes | 47,715 | 100.00 | ||||||
| Canadian federal election, 1979 | ||||||||
|---|---|---|---|---|---|---|---|---|
| Party | Candidate | Votes | % | ∆% | ||||
| Liberal | Yves Demers | 35,270 | 68.13 | +8.58 | ||||
| Social Credit | François Chagnon | 7,446 | 14.38 | +2.79 | ||||
| Progressive Conservative | Richard B. Morin | 4,152 | 8.02 | -13.24 | ||||
| New Democratic | John Shatilla | 2,839 | 5.48 | -2.12 | ||||
| Rhinoceros | Pierre J. Hamel | 1,592 | 3.08 | – | ||||
| Union populaire | Marcel Lavigne | 220 | 0.42 | – | ||||
| Communist | Jacques Grenier | 125 | 0.24 | – | ||||
| Marxist–Leninist | Sylvie Bourgeois | 122 | 0.24 | – | ||||
| Total valid votes | 51,766 | 100.00 | ||||||
| Canadian federal election, 1974 | ||||||||
|---|---|---|---|---|---|---|---|---|
| Party | Candidate | Votes | % | ∆% | ||||
| Liberal | Yves Demers | 25,674 | 59.55 | +9.80 | ||||
| Progressive Conservative | Gilles David | 9,165 | 21.26 | +4.10 | ||||
| Social Credit | Émilien Martel | 4,996 | 11.59 | -9.26 | ||||
| New Democratic | Edmond Ciccarelli | 3,275 | 7.60 | -4.64 | ||||
| Total valid votes | 43,110 | 100.00 | ||||||
| Canadian federal election, 1972 | ||||||||
|---|---|---|---|---|---|---|---|---|
| Party | Candidate | Votes | % | ∆% | ||||
| Liberal | Yves Demers | 23,050 | 49.75 | -0.79 | ||||
| Social Credit | Émilien Martel | 9,659 | 20.85 | +18.13 | ||||
| Progressive Conservative | Bernard Roy | 7,950 | 17.16 | +14.27 | ||||
| New Democratic | Gaston McKenty | 5,669 | 12.24 | -31.61 | ||||
| Total valid votes | 46,328 | 100.00 | ||||||
| Canadian federal election, 1968 | ||||||||
|---|---|---|---|---|---|---|---|---|
| Party | Candidate | Votes | % | |||||
| Liberal | Eric Kierans | 18,701 | 50.54 | |||||
| New Democratic | Robert Cliche | 16,225 | 43.85 | |||||
| Progressive Conservative | Simon Bédard | 1,068 | 2.89 | |||||
| Ralliement créditiste | Fernand Bélisle | 1,006 | 2.72 | |||||
| Total valid votes | 37,000 | 100.00 | ||||||
See also
References
- "(Code 24003) Census Profile". 2011 census. Statistics Canada. 2012. Retrieved 2011-03-07.
- Riding history from the Library of Parliament
- Riding history for Laval East from the Library of Parliament
- Riding history for Duvernay from the Library of Parliament
- Campaign expense data from Elections Canada
Notes
.png)
Coordinates: 45°39′58″N 73°37′41″W / 45.666°N 73.628°W