Lac-Saint-Louis (electoral district)
Lac-Saint-Louis is a federal electoral district in Quebec, Canada, that has been represented in the Canadian House of Commons since 1997. Its population in 2001 was 101,919.
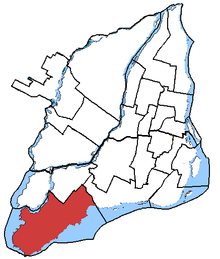
Geography
The district includes the Cities of Beaconsfield, and Pointe-Claire; the Towns of Baie-d'Urfé, Kirkland and Sainte-Anne-de-Bellevue; the Municipality of Senneville; and the western part of the borough of Pierrefonds-Roxboro of the city of Montreal.
The neighbouring ridings are Pierrefonds—Dollard, Dorval—Lachine—LaSalle and Vaudreuil—Soulanges.
History
The electoral district was created in 1996 from Lachine—Lac-Saint-Louis and Vaudreuil ridings.
This riding was largely untouched by the 2012 electoral redistribution, gaining a small territory from Notre-Dame-de-Grâce—Lachine.
Members of Parliament
This riding has elected the following Members of Parliament:
Election results
| Canadian federal election, 2015 |
| Party |
Candidate |
Votes | % | ∆% | Expenditures |
|
Liberal | Francis Scarpaleggia | 39,965 | 64.14 | +30.03 | – |
|
Conservative | Eric Girard | 10,857 | 17.42 | -11.02 | – |
|
New Democratic | Ryan Young | 7,997 | 12.83 | -17.23 | – |
|
Green | Bradford Dean | 1,812 | 2.91 | -1.36 | – |
|
Bloc Québécois | Gabriel Bernier | 1,681 | 2.7 | -0.42 | $4,317.92 |
| Total valid votes/Expense limit |
62,312 | 100.0 | | $224,522.81 |
| Total rejected ballots |
321 | 0.51 | -0.02 |
| Turnout |
62,633 | 73.06 | +6.93 |
| Eligible voters |
85,727 |
|
Liberal hold |
Swing |
+23.63
|
| Source: Elections Canada[3][4] |
| Canadian federal election, 2008 |
| Party |
Candidate |
Votes | % | ∆% | Expenditures |
|
Liberal | Francis Scarpaleggia | 23,842 | 46.38 | -1.8 | $71,566 |
|
Conservative | Andrea Paine | 12,085 | 23.51 | -3.2 | $54,850 |
|
New Democratic | Daniel Quinn | 8,105 | 15.76 | +5.1 | |
|
Green | Peter Graham | 4,415 | 8.58 | +1.8 | $7,679 |
|
Bloc Québécois | Maxime Clément | 2,953 | 5.74 | -2.0 | $6,931 |
| Total valid votes/Expense limit |
51,400 | 100.00 | – |
| Rejected ballots |
277 | 0.54 |
| Turnout |
51,677 | 64.03 |
|
Liberal hold |
Swing |
-2.5
|
| Canadian federal election, 2006 |
| Party |
Candidate |
Votes | % | ∆% | Expenditures |
|
Liberal | Francis Scarpaleggia | 25,588 | 48.2 | -15.7 | $46,751 |
|
Conservative | Andrea Paine | 14,164 | 26.7 | +14.6 | $74,919 |
|
New Democratic | Daniel Quinn | 5,702 | 10.7 | +5.6 | $8,129 |
|
Bloc Québécois | Anne-Marie Guertin | 4,064 | 7.7 | -2.5 | $9,298 |
|
Green | Peter Graham | 3,605 | 6.8 | +1.6 | $1,340 |
| Total valid votes/Expense limit |
53,123 | 100.0 | $80,616 |
|
Liberal hold |
Swing |
-215.15
|
| Canadian federal election, 2004 |
| Party |
Candidate |
Votes | % | ∆% | Expenditures |
|
Liberal | Francis Scarpaleggia | 32,122 | 63.9 | -10.3 | $41,498 |
|
Conservative | Jeff Howard | 6,082 | 12.1 | -2.6 | $15,262 |
|
Bloc Québécois | Maxime Côté | 5,106 | 10.2 | +3.5 | $7,084 |
|
New Democratic | Daniel Quinn | 3,789 | 7.5 | +5.0 | $6,036 |
|
Green | Peter Graham | 2,584 | 5.1 | – | $1,808 |
|
Marijuana | Patrick Cardinal | 578 | 1.1 | -0.6 | |
| Total valid votes/Expense limit |
50,261 | 100.0 | $79,772 |
|
Liberal hold |
Swing |
-6.45
|
Note: Conservative vote is compared to the total of the Canadian Alliance vote and Progressive Conservative vote in the 2000 election.
Note: Canadian Alliance vote is compared to the Reform vote in 1997 election.
See also
References
Notes
|
|---|
|
| Until 2015 | |
|---|
|
| Until 2006 | |
|---|
|
| Until 2004 | |
|---|
|
| Until 2000 | |
|---|
|
| Until 1997 | |
|---|
|
| Until 1993 | |
|---|
|
| Until 1988 | |
|---|
|
| Until 1984 | |
|---|
|
| Until 1980 | |
|---|
|
| Until 1979 | |
|---|
|
| Until 1974 | |
|---|
|
| Until 1972 | |
|---|
|
| Until 1968 | |
|---|
|
| Until 1962 | |
|---|
|
| Until 1953 | |
|---|
|
| Until 1949 | |
|---|
|
| Until 1935 | |
|---|
|
| Until 1925 | |
|---|
|
| Until 1917 | |
|---|
|
| Before 1900 | |
|---|
.png)