Compton—Stanstead
Compton—Stanstead Quebec electoral district Quebec electoral district |
|---|
|
|
| Federal electoral district |
|---|
| Legislature |
House of Commons |
|---|
| MP |
Marie-Claude Bibeau
Liberal |
|---|
| District created |
1996 |
|---|
| First contested |
1997 |
|---|
| Last contested |
2015 |
|---|
| District webpage |
profile, map |
|---|
| Demographics |
|---|
| Population (2011)[1] |
101,946 |
|---|
| Electors (2015) |
81,405 |
|---|
| Area (km²)[2] |
4,815 |
|---|
| Pop. density (per km²) |
21.2 |
|---|
| Census divisions |
Coaticook RCM, Le Haut-Saint-François RCM, Memphrémagog RCM, Sherbrooke, Le Val-Saint-François RCM |
|---|
| Census subdivisions |
Ascot Corner, Coaticook, Compton, Cookshire-Eaton, East Angus, Sherbrooke (part), Stanstead, Stoke, Weedon |
|---|
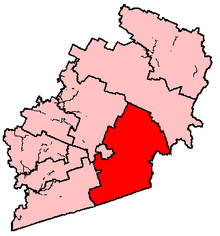
Compton—Stanstead is a federal electoral district in Quebec, Canada, that has been represented in the Canadian House of Commons since 1997.
It was created in 1996 from Mégantic—Compton—Stanstead and Richmond—Wolfe ridings.
Geography
The southern Quebec riding on the US border southeast of Sherbrooke is located in the Quebec region of Estrie. It consists of the RCMs of Coaticook and Le Haut-Saint-François, the eastern half of Memphrémagog, and parts of Le Val-Saint-François and the city of Sherbrooke.
Main towns include Coaticook, Lennoxville (now part of Sherbrooke), North Hatley, Stanstead, and Ayer's Cliff.
Neighbouring ridings are Brome—Missisquoi, Richmond—Arthabaska, Sherbrooke, and Mégantic—L'Érable.
The 2012 electoral redistribution saw this riding lose and gain territories with Sherbrooke.
Members of Parliament
This riding has elected the following Members of Parliament:
Election results
| Canadian federal election, 2015 |
| Party |
Candidate |
Votes | % | ∆% | Expenditures |
|
Liberal | Marie-Claude Bibeau | 20,582 | 36.88 | +24.89 | – |
|
New Democratic | Jean Rousseau | 15,300 | 27.41 | -19.86 | – |
|
Bloc Québécois | France Bonsant | 11,551 | 20.70 | -5.73 | – |
|
Conservative | Gustavo Labrador | 6,978 | 12.50 | +0.65 | – |
|
Green | Korie Marshall | 1,085 | 1.94 | -0.49 | – |
|
Rhinoceros | Kévin Côté | 315 | 0.56 | – | – |
| Total valid votes/Expense limit |
55,811 | 100.00 | | $217,710.73 |
| Total rejected ballots |
748 | 1.32 | – |
| Turnout |
56,559 | 69.09 | – |
| Eligible voters |
81,867 |
|
Liberal gain from New Democratic |
Swing |
+22.37
|
| Source: Elections Canada[3][4] |
| Canadian federal election, 2008 |
| Party |
Candidate |
Votes | % | ∆% | Expenditures |
|
Bloc Québécois | France Bonsant | 20,332 | 41.85 | -0.9 | $42,534 |
|
Liberal | William Hogg | 10,946 | 22.53 | +0.2 | $17,476 |
|
Conservative | Michel Gagné | 9,445 | 19.44 | -4.9 | $57,862 |
|
New Democratic | Jean Rousseau | 5,483 | 11.28 | +5.1 | $1,820 |
|
Green | Gary Caldwell | 2,368 | 4.87 | +0.5 | $11,114 |
| Total valid votes/Expense limit |
48,574 | 100.00 | $84,153 |
| Total rejected ballots |
572 | 1.16 |
| Turnout |
49,146 | 62.97 |
| Canadian federal election, 2006 |
| Party |
Candidate |
Votes | % | ∆% | Expenditures |
|
Bloc Québécois | France Bonsant | 21,316 | 42.8 | -3.9 | $38,909 |
|
Conservative | Gary Caldwell | 12,131 | 24.3 | +13.9 | $44,452 |
|
Liberal | David Price | 11,126 | 22.3 | -13.7 | $56,653 |
|
New Democratic | Stéphane Bürgi | 3,099 | 6.2 | +2.9 | $1,674 |
|
Green | Gaétan Perreault | 2,171 | 4.4 | +0.8 | $310 |
| Total valid votes/Expense limit |
49,843 | 100.0 | $77,428 |
| Canadian federal election, 2004 |
| Party |
Candidate |
Votes | % | ∆% | Expenditures |
|
Bloc Québécois | France Bonsant | 20,450 | 46.7 | +7.8 | $36,450 |
|
Liberal | David Price | 15,752 | 36.0 | -10.6 | $55,575 |
|
Conservative | Gary Caldwell | 4,589 | 10.5 | -1.3 | $13,713 |
|
Green | Laurier Busque | 1,546 | 3.5 | | $540 |
|
New Democratic | Martin Baller | 1,451 | 3.3 | +1.8 | |
| Total valid votes/Expense limit |
43,788 | 100.0 | $75,354 |
Note: Conservative vote is compared to the total of the Canadian Alliance vote and Progressive Conservative vote in the 2000 election.
See also
References
Notes
|
|---|
|
| Until 2015 | |
|---|
|
| Until 2006 | |
|---|
|
| Until 2004 | |
|---|
|
| Until 2000 | |
|---|
|
| Until 1997 | |
|---|
|
| Until 1993 | |
|---|
|
| Until 1988 | |
|---|
|
| Until 1984 | |
|---|
|
| Until 1980 | |
|---|
|
| Until 1979 | |
|---|
|
| Until 1974 | |
|---|
|
| Until 1972 | |
|---|
|
| Until 1968 | |
|---|
|
| Until 1962 | |
|---|
|
| Until 1953 | |
|---|
|
| Until 1949 | |
|---|
|
| Until 1935 | |
|---|
|
| Until 1925 | |
|---|
|
| Until 1917 | |
|---|
|
| Before 1900 | |
|---|