Hochelaga (electoral district)
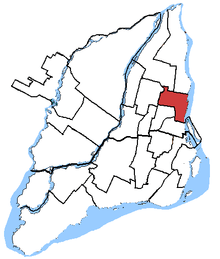 Hochelaga in relation to other electoral districts in Montreal (2003 boundaries) | |||
| Federal electoral district | |||
| Legislature | House of Commons | ||
| MP |
| ||
| District created | 2003 | ||
| First contested | 2004 | ||
| Last contested | 2015 | ||
| District webpage | profile, map | ||
| Demographics | |||
| Population (2011)[1] | 103,436 | ||
| Electors (2015) | 82,245 | ||
| Area (km²)[2] | 20 | ||
| Pop. density (per km²) | 5,171.8 | ||
| Census divisions | Montreal | ||
| Census subdivisions | Montreal | ||
Hochelaga (formerly known as Sainte-Marie and Montreal—Sainte-Marie) is a federal electoral district in Quebec, Canada, that has been represented in the House of Commons of Canada from 1867 to 1988 and since 2004.
Geography
The district includes the neighbourhood of Hochelaga-Maisonneuve and the western part of the neighbourhood of Longue-Pointe in the Borough of Mercier—Hochelaga-Maisonneuve, the eastern part of the neighbourhood of Rosemont in the Borough of Rosemont–La Petite-Patrie and the eastern part of the neighbourhood of Centre-Sud in the Borough of Ville-Marie.
Political geography
Until 2011, this working class riding strongly favoured the Bloc, which in 2008, won most polls. Their strongest support was east of Sherbrooke Street. The Liberals won a handful of polls in the northwest corner of the riding near Saint Leonard.
The New Democrats placed second in the 2009 by-election; as in much of Quebec, Bloc support collapsed in the 2011 election and the New Democrats swept the riding.
Demographics
- According to the Canada 2006 Census
- Ethnic groups: 83.5% White, 4.5% Black, 2.8% Latin American, 2.5% Arab, 2.2% Chinese, 1.9% Southeast Asian, 1.0% South Asian
- Languages: 76.9% French, 3.4% English, 19.0% Others
- Religions: (2001) 80.9% Catholic, 3.1% Protestant, 2.2% Muslim, 1.4% Buddhist, 1.4% Christian Orthodox, 9.4% No religion
- Average income: $20,781
History
The electoral district of Hochelaga was created in 1867 covering the entire eastern part of the Island of Montreal. In 1976, it was renamed "Sainte-Marie". In 1981, it was renamed "Montreal—Sainte-Marie".
The riding was abolished in 1987 when it was redistributed into Laurier—Sainte-Marie and Rosemont ridings.
"Hochelaga" riding was recreated in 2003 from parts of Hochelaga—Maisonneuve and Laurier—Sainte-Marie ridings.
This riding lost territory to Laurier—Sainte-Marie and Saint-Léonard—Saint-Michel, and gained territory from La Pointe-de-l'Île and Honoré-Mercier during the 2012 electoral redistribution.
Members of Parliament
This riding has elected the following Members of Parliament:
Election results
Hochelaga, 2004 - present
| Canadian federal election, 2015 | ||||||||
|---|---|---|---|---|---|---|---|---|
| Party | Candidate | Votes | % | ∆% | Expenditures | |||
| New Democratic | Marjolaine Boutin-Sweet | 16,034 | 30.89 | -16.59 | – | |||
| Liberal | Marwah Rizqy | 15,534 | 29.93 | +18.20 | – | |||
| Bloc Québécois | Simon Marchand | 14,389 | 27.72 | -3.04 | $47,613.01 | |||
| Conservative | Alexandre Dang | 3,555 | 6.85 | -0.35 | – | |||
| Green | Anne-Marie Saint-Cerny | 1,654 | 3.19 | +1.52 | – | |||
| Rhinoceros | Nicolas Lemay | 411 | 0.79 | +0.26 | – | |||
| Communist | Marianne Breton Fontaine | 179 | 0.34 | -0.05 | – | |||
| Marxist–Leninist | Christine Dandenault | 148 | 0.29 | -0.02 | – | |||
| Total valid votes/Expense limit | 51,904 | 100.0 | $219,055.87 | |||||
| Total rejected ballots | 877 | – | – | |||||
| Turnout | 52,781 | – | – | |||||
| Eligible voters | 82,783 | |||||||
| These results were subject to a judicial recount,[3] and modified from the validated results in accordance with the Judge's rulings. The margin of Marjolaine Boutin-Sweet over Marwah Rizqy decreased from 541 votes to 500 votes as a result of the recount.[4] | ||||||||
| Source: Elections Canada[5][6] | ||||||||
| 2011 federal election redistributed results[7] | |||
|---|---|---|---|
| Party | Vote | % | |
| New Democratic | 22,425 | 47.48 | |
| Bloc Québécois | 14,528 | 30.76 | |
| Liberal | 5,542 | 11.73 | |
| Conservative | 3,402 | 7.20 | |
| Green | 788 | 1.67 | |
| Others | 546 | 1.16 | |
| Canadian federal election, 2011 | ||||||||
|---|---|---|---|---|---|---|---|---|
| Party | Candidate | Votes | % | ∆% | Expenditures | |||
| New Democratic | Marjolaine Boutin-Sweet | 22,314 | 48.17 | +33.72 | $18,453 | |||
| Bloc Québécois | Daniel Paillé | 14,451 | 31.20 | −18.53 | $46,974 | |||
| Liberal | Gilbert Thibodeau | 5,064 | 10.93 | −9.74 | $17,622 | |||
| Conservative | Audrey Castonguay | 3,126 | 6.75 | −2.45 | $5,647 | |||
| Green | Yaneisy Delgado Dihigo | 798 | 1.72 | −2.54 | none listed | |||
| Rhinoceros | Hugo Samson Veillette | 246 | 0.53 | +0.03 | none listed | |||
| Communist | Marianne Breton Fontaine | 180 | 0.39 | −0.01 | $1,772 | |||
| Marxist–Leninist | Christine Dandenault | 143 | 0.31 | −0.08 | none listed | |||
| Total valid votes | 46,322 | 100.00 | ||||||
| Total rejected ballots | 725 | |||||||
| Turnout | 47,047 | 58.43 | +0.19 | |||||
| Electors on the lists | 80,515 | |||||||
| Sources: Official Results, Elections Canada and Financial Returns, Elections Canada. Percentage change figures refer to voting shifts as compared with the 2008 general election, not the 2009 by-election. | ||||||||
| Canadian federal by-election, November 9, 2009 | ||||||||
|---|---|---|---|---|---|---|---|---|
| Party | Candidate | Votes | % | ∆% | Expenditures | |||
| Bloc Québécois | Daniel Paillé | 8,989 | 51.16 | +1.43 | $54,233 | |||
| New Democratic | Jean-Claude Rocheleau | 3,444 | 19.60 | +5.15 | $69,082 | |||
| Liberal | Robert David | 2,519 | 14.34 | −6.33 | $23,211 | |||
| Conservative | Stéphanie Cloutier | 1,768 | 10.06 | +0.86 | $37,337 | |||
| Green | Christine Lebel | 572 | 3.26 | −1.00 | not listed | |||
| neorhino.ca | Gabrielle Anctil | 129 | 0.73 | +0.23 | $130 | |||
| Marxist–Leninist | Christine Dandenault | 79 | 0.45 | +0.06 | $349 | |||
| Independent | John Turmel | 69 | 0.39 | none listed | ||||
| Total valid votes | 17,569 | 100.00 | ||||||
| Total rejected ballots | 264 | |||||||
| Turnout | 17,833 | 22.63 | −35.61 | |||||
| Electors on the lists | 78,801 | |||||||
| Sources: Official Results, Elections Canada and Financial Returns, Elections Canada. | ||||||||
| Canadian federal election, 2008 | ||||||||
|---|---|---|---|---|---|---|---|---|
| Party | Candidate | Votes | % | ∆% | Expenditures | |||
| Bloc Québécois | Réal Ménard | 22,720 | 49.73 | −5.85 | $28,893 | |||
| Liberal | Diane Dicaire | 9,442 | 20.67 | +3.43 | not listed | |||
| New Democratic | Jean-Claude Rocheleau | 6,600 | 14.45 | +5.54 | $21,479 | |||
| Conservative | Luc Labbé | 4,201 | 9.20 | −3.01 | $8,586 | |||
| Green | Philippe Larochelle | 1,946 | 4.26 | −0.60 | not listed | |||
| neorhino.ca | Simon Landry | 230 | 0.50 | – | not listed | |||
| Communist | Marianne Breton Fontaine | 184 | 0.40 | $898 | ||||
| Marijuana | Blair T. Longley | 183 | 0.40 | −0.32 | not listed | |||
| Marxist–Leninist | Christine Dandenault | 177 | 0.39 | −0.09 | not listed | |||
| Total valid votes | 45,683 | 100.00 | ||||||
| Total rejected ballots | 644 | |||||||
| Turnout | 46,327 | 58.24 | −0.07 | |||||
| Electors on the lists | 79,542 | |||||||
| Sources: Official Results, Elections Canada and Financial Returns, Elections Canada. | ||||||||
| Canadian federal election, 2006 | ||||||||
|---|---|---|---|---|---|---|---|---|
| Party | Candidate | Votes | % | ∆% | Expenditures | |||
| Bloc Québécois | Réal Ménard | 25,570 | 55.58 | −4.54 | $25,836 | |||
| Liberal | Vicky Harvey | 7,932 | 17.24 | −8.39 | $10,318 | |||
| Conservative | Audrey Castonguay | 5,617 | 12.21 | +8.15 | $30,705 | |||
| New Democratic | David-Roger Gagnon | 4,101 | 8.91 | +3.42 | $2,780 | |||
| Green | Rolf Bramann | 2,235 | 4.86 | +1.88 | none listed | |||
| Marijuana | Blair T. Longley | 332 | 0.72 | −0.33 | none listed | |||
| Marxist–Leninist | Christine Dandenault | 220 | 0.48 | +0.23 | none listed | |||
| Total valid votes | 46,007 | 100.00 | ||||||
| Total rejected ballots | 723 | |||||||
| Turnout | 46,730 | 58.31 | +0.52 | |||||
| Electors on the lists | 80,142 | |||||||
| Sources: Official Results, Elections Canada and Financial Returns, Elections Canada. | ||||||||
| Canadian federal election, 2004 | ||||||||
|---|---|---|---|---|---|---|---|---|
| Party | Candidate | Votes | % | ∆% | Expenditures | |||
| Bloc Québécois | Réal Ménard | 27,476 | 60.12 | +9.60 | $35,055 | |||
| Liberal | Benoit Bouvier | 11,712 | 25.63 | −10.06 | $22,566 | |||
| New Democratic | David Gagnon | 2,510 | 5.49 | +3.55 | $695 | |||
| Conservative | Mario Bernier | 1,856 | 4.06 | −3.33 | $2,131 | |||
| Green | Rolf Bramann | 1,361 | 2.98 | $963 | ||||
| Marijuana | Antoine Théorêt-Poupart | 482 | 1.05 | – | none listed | |||
| Communist | Pierre Bibeau | 190 | 0.42 | $647 | ||||
| Marxist–Leninist | Christine Dandenault | 112 | 0.25 | none listed | ||||
| Total valid votes | 45,699 | 100.00 | ||||||
| Total rejected ballots | 936 | |||||||
| Turnout | 46,635 | 57.79 | ||||||
| Electors on the lists | 80,702 | |||||||
| Percentage change figures are factored for redistribution. Conservative Party percentages are contrasted with the combined Canadian Alliance and Progressive Conservative figures from 2000. Sources: Official Results, Elections Canada and Financial Returns, Elections Canada. | ||||||||
Montreal—Sainte-Marie, 1984 - 1988
| Canadian federal election, 1984 | ||||||||
|---|---|---|---|---|---|---|---|---|
| Party | Candidate | Votes | % | ∆% | ||||
| Liberal | Jean-Claude Malépart | 13,668 | 43.38 | -25.12 | ||||
| Progressive Conservative | François Richard | 10,919 | 34.65 | +21.87 | ||||
| New Democratic | Lauraine Vaillancourt | 3,525 | 11.19 | +2.45 | ||||
| Rhinoceros | Dominique Whipette Langevin | 2,338 | 7.42 | +1.49 | ||||
| Parti nationaliste | André Vaillancourt | 990 | 3.14 | |||||
| Commonwealth of Canada | Ghislain Coté | 69 | 0.22 | |||||
| Total valid votes | 31,509 | 100.00 | ||||||
Sainte-Marie, 1979 - 1984
| Canadian federal election, 1980 | ||||||||
|---|---|---|---|---|---|---|---|---|
| Party | Candidate | Votes | % | ∆% | ||||
| Liberal | Jean-Claude Malépart | 19,160 | 68.49 | +9.08 | ||||
| Progressive Conservative | André Payette | 3,576 | 12.78 | -7.81 | ||||
| New Democratic | Jean-Pierre Juneau | 2,443 | 8.73 | +3.96 | ||||
| Rhinoceros | François Straight Favreau | 1,659 | 5.93 | 1.30 | ||||
| Social Credit | Gaston Pleau | 605 | 2.16 | -6.73 | ||||
| Independent | Lorraine Rondeau | 301 | 1.08 | |||||
| Marxist–Leninist | André Gagnon | 115 | 0.41 | -0.09 | ||||
| Union populaire | Claude Cousineau | 114 | 0.41 | -0.52 | ||||
| Total valid votes | 27,973 | 100.00 | ||||||
| Canadian federal election, 1979 | ||||||||
|---|---|---|---|---|---|---|---|---|
| Party | Candidate | Votes | % | ∆% | ||||
| Liberal | Jean-Claude Malépart | 19,612 | 59.41 | +26.09 | ||||
| Progressive Conservative | André Payette | 6,797 | 20.59 | -27.98 | ||||
| Social Credit | Gaston Pleau | 2,936 | 8.89 | -1.30 | ||||
| New Democratic | Jean-Pierre Juneau | 1,575 | 4.77 | +0.79 | ||||
| Rhinoceros | François Straight Favreau | 1,527 | 4.63 | |||||
| Union populaire | Marcel Chaput | 306 | 0.93 | |||||
| Marxist–Leninist | André Gagnon | 166 | 0.50 | |||||
| Communist | Lydia Morand | 91 | 0.28 | |||||
| Total valid votes | 33,010 | 100.00 | ||||||
Hochelaga, 1867 - 1979
| Canadian federal by-election, 14 October 1975 | ||||||||
|---|---|---|---|---|---|---|---|---|
| Party | Candidate | Votes | % | ∆% | ||||
| Pelletier resigned, 29 August 1975 | ||||||||
| Progressive Conservative | Jacques Lavoie | 8,236 | 48.58 | +18.19 | ||||
| Liberal | Pierre Juneau | 5,649 | 33.32 | -16.54 | ||||
| Social Credit | Gilles Caouette | 1,729 | 10.20 | -0.46 | ||||
| New Democratic | Onias Synnott | 675 | 3.98 | -2.92 | ||||
| Independent | Gérard Contant | 396 | 2.34 | |||||
| Independent | Louise Ouimet | 169 | 1.00 | |||||
| Independent | Daniel Charlebois | 101 | 0.60 | |||||
| Total valid votes | 16,955 | 100.00 | ||||||
| Canadian federal election, 1974 | ||||||||
|---|---|---|---|---|---|---|---|---|
| Party | Candidate | Votes | % | ∆% | ||||
| Liberal | Gérard Pelletier | 10,561 | 49.86 | +5.52 | ||||
| Progressive Conservative | Jacques Lavoie | 6,435 | 30.38 | +5.91 | ||||
| Social Credit | Lucien Mallette | 2,258 | 10.66 | |||||
| New Democratic | Roger Hébert | 1,461 | 6.90 | -10.92 | ||||
| Independent | Jean Poitras | 190 | 0.90 | |||||
| Marxist–Leninist | Robert Lévesque | 181 | 0.85 | |||||
| Communist | Guy Désautels | 95 | 0.45 | |||||
| Total valid votes | 21,181 | 100.00 | ||||||
| Canadian federal election, 1972 | ||||||||
|---|---|---|---|---|---|---|---|---|
| Party | Candidate | Votes | % | ∆% | ||||
| Liberal | Gérard Pelletier | 11,235 | 44.34 | -10.80 | ||||
| Progressive Conservative | Jacques Lavoie | 6,199 | 24.47 | -1.64 | ||||
| New Democratic | Raymond-Gérard Laliberté | 4,515 | 17.82 | +5.07 | ||||
| Independent | Gérard Contant | 2,171 | 8.57 | |||||
| Independent | Jacques Ferron | 879 | 3.47 | |||||
| Independent | Françoise Lévesque | 338 | 1.33 | |||||
| Total valid votes | 25,337 | 100.00 | ||||||
| Canadian federal election, 1968 | ||||||||
|---|---|---|---|---|---|---|---|---|
| Party | Candidate | Votes | % | ∆% | ||||
| Liberal | Gérard Pelletier | 12,080 | 55.14 | +7.39 | ||||
| Progressive Conservative | Michel Gagnon | 5,720 | 26.11 | +6.49 | ||||
| New Democratic | René Nantel | 2,793 | 12.75 | -6.88 | ||||
| Ralliement créditiste | Dollard Desormeaux | 1,122 | 5.12 | -8.83 | ||||
| Communist | Jeannette Walsh | 192 | 0.88 | |||||
| Total valid votes | 21,907 | 100.00 | ||||||
| Canadian federal election, 1965 | ||||||||
|---|---|---|---|---|---|---|---|---|
| Party | Candidate | Votes | % | ∆% | ||||
| Liberal | Gérard Pelletier | 11,929 | 47.76 | +1.39 | ||||
| New Democratic | Claude Richer | 4,902 | 19.62 | +7.61 | ||||
| Progressive Conservative | Marius Heppell | 4,662 | 18.66 | +4.88 | ||||
| Ralliement créditiste | Fernand Bourret | 3,486 | 13.96 | -12.73 | ||||
| Total valid votes | 24,979 | 100.00 | ||||||
Note: Ralliement créditiste vote is compared to Social Credit vote in the 1963 election.
| Canadian federal election, 1963 | ||||||||
|---|---|---|---|---|---|---|---|---|
| Party | Candidate | Votes | % | ∆% | ||||
| Liberal | Raymond Eudes | 13,093 | 46.36 | -4.09 | ||||
| Social Credit | Fernand Bourret | 7,535 | 26.68 | +17.60 | ||||
| Progressive Conservative | J.-Marius Heppell | 3,892 | 13.78 | -15.92 | ||||
| New Democratic | Arthur Lamoureux | 3,394 | 12.02 | +2.57 | ||||
| Communist | Jeannette Pratte | 327 | 1.16 | -0.17 | ||||
| Total valid votes | 28,241 | 100.00 | ||||||
| Canadian federal election, 1962 | ||||||||
|---|---|---|---|---|---|---|---|---|
| Party | Candidate | Votes | % | ∆% | ||||
| Liberal | Raymond Eudes | 13,220 | 50.45 | -2.21 | ||||
| Progressive Conservative | Yvon Groulx | 7,784 | 29.70 | -10.78 | ||||
| New Democratic | Noël Langlois | 2,475 | 9.44 | +5.37 | ||||
| Social Credit | Robert Leblanc | 2,379 | 9.08 | |||||
| Communist | Samuel Walsh | 347 | 1.32 | -1.46 | ||||
| Total valid votes | 26,205 | 100.00 | ||||||
| Canadian federal election, 1958 | ||||||||
|---|---|---|---|---|---|---|---|---|
| Party | Candidate | Votes | % | ∆% | ||||
| Liberal | Raymond Eudes | 16,706 | 52.65 | -23.28 | ||||
| Progressive Conservative | Benoît Gonthier | 12,845 | 40.48 | +25.52 | ||||
| Co-operative Commonwealth | Armand Sauvé | 1,294 | 4.08 | +1.15 | ||||
| Labor–Progressive | Camille Dionne | 883 | 2.78 | -3.39 | ||||
| Total valid votes | 31,728 | 100.00 | ||||||
| Canadian federal election, 1957 | ||||||||
|---|---|---|---|---|---|---|---|---|
| Party | Candidate | Votes | % | ∆% | ||||
| Liberal | Raymond Eudes | 20,611 | 75.93 | -0.36 | ||||
| Progressive Conservative | Benoît Gonthier | 4,063 | 14.97 | -0.40 | ||||
| Labor–Progressive | Gérard Fortin | 1,675 | 6.17 | +2.70 | ||||
| Co-operative Commonwealth | Lucien Pépin | 796 | 2.93 | -1.95 | ||||
| Total valid votes | 27,145 | 100.00 | ||||||
| Canadian federal election, 1953 | ||||||||
|---|---|---|---|---|---|---|---|---|
| Party | Candidate | Votes | % | ∆% | ||||
| Liberal | Raymond Eudes | 19,467 | 76.29 | +8.93 | ||||
| Progressive Conservative | Jean Jodoin | 3,921 | 15.37 | -11.11 | ||||
| Co-operative Commonwealth | Roger Beaudin | 1,245 | 4.88 | |||||
| Labor–Progressive | Camille Dionne | 885 | 3.47 | |||||
| Total valid votes | 25,518 | 100.00 | ||||||
| Canadian federal election, 1949 | ||||||||
|---|---|---|---|---|---|---|---|---|
| Party | Candidate | Votes | % | ∆% | ||||
| Liberal | Raymond Eudes | 17,633 | 67.36 | +5.11 | ||||
| Progressive Conservative | Joseph-Omer Ravary | 6,930 | 26.47 | +20.35 | ||||
| Union des électeurs | Roméo Dagenais | 1,615 | 6.17 | +4.69 | ||||
| Total valid votes | 26,178 | 100.00 | ||||||
| Canadian federal election, 1945 | ||||||||
|---|---|---|---|---|---|---|---|---|
| Party | Candidate | Votes | % | ∆% | ||||
| Liberal | Raymond Eudes | 22,444 | 62.25 | +8.42 | ||||
| Bloc populaire | Raymond Godin | 7,915 | 21.95 | |||||
| Independent | Jean-Paul Chauvin | 2,264 | 6.28 | -23.02 | ||||
| Progressive Conservative | Achille Dubeau | 2,208 | 6.12 | -6.81 | ||||
| Co-operative Commonwealth | Noël-Émile Bourassa | 692 | 1.92 | |||||
| Social Credit | Léopold Gendron | 533 | 1.48 | |||||
| Total valid votes | 36,056 | 100.00 | ||||||
Note: Progressive Conservative vote is compared to "National Government" vote in 1940 election.
| Canadian federal election, 1940 | ||||||||
|---|---|---|---|---|---|---|---|---|
| Party | Candidate | Votes | % | ∆% | ||||
| Liberal | Raymond Eudes | 16,849 | 53.83 | -10.77 | ||||
| Independent Liberal | Jean-Paul Chauvin | 9,172 | 29.30 | |||||
| National Government | Achille Dubeau | 4,049 | 12.94 | +1.26 | ||||
| Independent Liberal | Richard Thibault | 1,230 | 3.93 | |||||
| Total valid votes | 31,300 | 100.00 | ||||||
Note: "National Government" vote is compared to Conservative vote in 1935 election.
| Canadian federal election, 1935 | ||||||||
|---|---|---|---|---|---|---|---|---|
| Party | Candidate | Votes | % | ∆% | ||||
| Liberal | Édouard-Charles St-Père | 19,506 | 64.60 | -3.81 | ||||
| Reconstruction | Hervé Langevin | 7,164 | 23.73 | |||||
| Conservative | Armand Chevrette | 3,524 | 11.67 | -19.92 | ||||
| Total valid votes | 30,194 | 100.00 | ||||||
| Canadian federal election, 1930 | ||||||||
|---|---|---|---|---|---|---|---|---|
| Party | Candidate | Votes | % | ∆% | ||||
| Liberal | Édouard-Charles St-Père | 19,382 | 68.41 | -15.94 | ||||
| Conservative | Joseph-Thomas-Ulric Simard | 8,949 | 31.59 | +18.53 | ||||
| Total valid votes | 28,331 | 100.00 | ||||||
| Canadian federal election, 1926 | ||||||||
|---|---|---|---|---|---|---|---|---|
| Party | Candidate | Votes | % | ∆% | ||||
| Liberal | Édouard-Charles St-Père | 16,339 | 84.35 | +8.65 | ||||
| Conservative | Joseph-Thomas-Ulric Simard | 2,530 | 13.06 | -11.24 | ||||
| Independent Liberal | Jean-Marie-Mastaï-Georges Cardinal | 502 | 2.59 | |||||
| Total valid votes | 19,371 | 100.00 | ||||||
| Canadian federal election, 1925 | ||||||||
|---|---|---|---|---|---|---|---|---|
| Party | Candidate | Votes | % | ∆% | ||||
| Liberal | Édouard-Charles St-Père | 14,741 | 75.70 | -13.92 | ||||
| Conservative | Jean-Baptiste Bumbray alias Jean Edouard Charles | 4,732 | 24.30 | +13.92 | ||||
| Total valid votes | 19,473 | 100.00 | ||||||
| Canadian federal election, 1921 | ||||||||
|---|---|---|---|---|---|---|---|---|
| Party | Candidate | Votes | % | ∆% | ||||
| Liberal | Édouard-Charles St-Père | 20,164 | 89.62 | -4.59 | ||||
| Conservative | Joseph Rosario Léo Ayotte | 2,335 | 10.38 | |||||
| Total valid votes | 22,499 | 100.00 | ||||||
Note: Liberal vote is compared to Opposition vote in 1917 election.
| Canadian federal election, 1917 | ||||||||
|---|---|---|---|---|---|---|---|---|
| Party | Candidate | Votes | % | ∆% | ||||
| Opposition (Laurier Liberals) | Joseph-Edmond Lesage | 9,697 | 94.21 | |||||
| Labour | Gédéon Martel | 309 | 3.00 | |||||
| Unknown | Cléophas Dignard | 287 | 2.79 | |||||
| Total valid votes | 10,293 | 100.00 | ||||||
| By-election on 15 October 1915
Coderre appointed Puisne Judge, Superior Court of Quebec, 6 October 1915 | |||||
| Party | Candidate | Votes | |||
|---|---|---|---|---|---|
| Conservative | Esioff Léon Patenaude | acclaimed | |||
| Canadian federal by-election, 19 November 1912 | ||||||||
|---|---|---|---|---|---|---|---|---|
| Party | Candidate | Votes | % | ∆% | ||||
| Coderre appointed Secretary of State for Canada, 29 October 1912 | ||||||||
| Conservative | Louis Coderre | 4,276 | 68.10 | +12.81 | ||||
| Nationalist | Léopold Doyon | 2,003 | 31.90 | |||||
| Total valid votes | 6,279 | 100.00 | ||||||
| Canadian federal election, 1911 | ||||||||
|---|---|---|---|---|---|---|---|---|
| Party | Candidate | Votes | % | ∆% | ||||
| Conservative | Louis Coderre | 7,178 | 55.29 | +6.30 | ||||
| Unknown | Louis-Alfred-Adhémar Rivet | 5,805 | 44.71 | -6.30 | ||||
| Total valid votes | 12,983 | 100.00 | ||||||
| Canadian federal election, 1908 | ||||||||
|---|---|---|---|---|---|---|---|---|
| Party | Candidate | Votes | % | ∆% | ||||
| Liberal | Louis-Alfred-Adhémar Rivet | 4,656 | 51.01 | -2.16 | ||||
| Conservative | Louis Coderre | 4,471 | 48.99 | +2.16 | ||||
| Total valid votes | 9,127 | 100.00 | ||||||
| Canadian federal election, 1904 | ||||||||
|---|---|---|---|---|---|---|---|---|
| Party | Candidate | Votes | % | ∆% | ||||
| Liberal | Louis-Alfred-Adhémar Rivet | 4,974 | 53.17 | +1.29 | ||||
| Conservative | A.A. Bernard | 4,381 | 46.83 | -1.29 | ||||
| Total valid votes | 9,355 | 100.00 | ||||||
| Canadian federal by-election, 16 February 1904 | ||||||||
|---|---|---|---|---|---|---|---|---|
| Party | Candidate | Votes | % | ∆% | ||||
| Madore appointed Puisne Judge of the Supreme Court of Quebec, December 1903 | ||||||||
| Liberal | Louis-Alfred-Adhémar Rivet | 4,114 | 51.88 | -2.50 | ||||
| Conservative | A.A. Bernard | 3,816 | 48.12 | +2.50 | ||||
| Total valid votes | 7,930 | 100.00 | ||||||
| Canadian federal election, 1900 | ||||||||
|---|---|---|---|---|---|---|---|---|
| Party | Candidate | Votes | % | ∆% | ||||
| Liberal | Joseph Alexandre Camille Madore | 4,127 | 54.38 | +0.64 | ||||
| Conservative | Sévérin Lachapelle | 3,462 | 45.62 | -0.64 | ||||
| Total valid votes | 7,589 | 100.00 | ||||||
| Canadian federal election, 1896 | ||||||||
|---|---|---|---|---|---|---|---|---|
| Party | Candidate | Votes | % | ∆% | ||||
| Liberal | Joseph Alexandre Camille Madore | 3,635 | 53.74 | +11.79 | ||||
| Conservative | Sévérin Lachapelle | 3,129 | 46.26 | -11.79 | ||||
| Total valid votes | 6,764 | 100.00 | ||||||
Note: change in popular vote indicates change from 1891 general election.
| By-election on 21 October 1892
Desjardins called to the Senate, 1 October 1892 | |||||
| Party | Candidate | Votes | |||
|---|---|---|---|---|---|
| Conservative | Séverin Lachapelle | acclaimed | |||
| Canadian federal election, 1891 | ||||||||
|---|---|---|---|---|---|---|---|---|
| Party | Candidate | Votes | % | ∆% | ||||
| Conservative | Alphonse Desjardins | 5,266 | 58.05 | +6.20 | ||||
| Liberal | Joseph Lanctot | 3,805 | 41.95 | -6.20 | ||||
| Total valid votes | 9,071 | 100.00 | ||||||
| Canadian federal election, 1887 | ||||||||
|---|---|---|---|---|---|---|---|---|
| Party | Candidate | Votes | % | |||||
| Independent Conservative | Alphonse Desjardins | 3,050 | 51.85 | |||||
| Liberal | Joseph Lanctot | 2,832 | 48.15 | |||||
| Total valid votes | 5,882 | 100.00 | ||||||
| Canadian federal election, 1882 | ||||||||
|---|---|---|---|---|---|---|---|---|
| Party | Candidate | Votes | ||||||
| Conservative | Alphonse Desjardins | acclaimed | ||||||
| Canadian federal election, 1878 | ||||||||
|---|---|---|---|---|---|---|---|---|
| Party | Candidate | Votes | % | |||||
| Conservative | Alphonse Desjardins | 3,039 | 56.48 | |||||
| Unknown | Laurent-Olivier David | 2,342 | 43.52 | |||||
| Total valid votes | 5,381 | 100.00 | ||||||
| Canadian federal election, 1874 | ||||||||
|---|---|---|---|---|---|---|---|---|
| Party | Candidate | Votes | ||||||
| Conservative | Alphonse Desjardins | acclaimed | ||||||
| Canadian federal election, 1872 | ||||||||
|---|---|---|---|---|---|---|---|---|
| Party | Candidate | Votes | % | ∆% | ||||
| Conservative | Louis Beaubien | 1,800 | 58.40 | |||||
| Unknown | V. Hudon | 1,282 | 41.60 | |||||
| Total valid votes | 3,082 | 100.00 | ||||||
| Canadian federal election, 1867 | ||||||||
|---|---|---|---|---|---|---|---|---|
| Party | Candidate | Votes | % | |||||
| Liberal | Antoine Aimé Dorion | 1,312 | 50.44 | |||||
| Unknown | Mr. Lanouette | 1,289 | 49.56 | |||||
| Total valid votes | 2,601 | 100.00 | ||||||
See also
References
- "(Code 24021) Census Profile". 2011 census. Statistics Canada. 2012. Retrieved 2011-03-07.
- Campaign expense data from Elections Canada
Riding history from the Library of Parliament:
Notes
- ↑ Statistics Canada: 2011
- ↑ Statistics Canada: 2011
- ↑ "Judicial Recount to Be Held in the Electoral District of Hochelaga". Elections Canada. October 29, 2015. line feed character in
|title=at position 57 (help) - ↑ "Judicial recount confirms NDP's Marjolaine Boutin-Sweet won in Hochelaga". CBC News. 5 November 2015. Retrieved 5 November 2015.
- ↑ Elections Canada – Confirmed candidates for Hochelaga, 30 September 2015
- ↑ Elections Canada – Preliminary Election Expenses Limits for Candidates
- ↑ Pundits' Guide to Canadian Elections
.png)