Fredericton (electoral district)
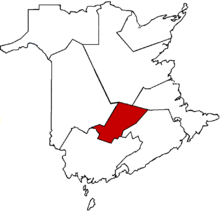 Fredericton in relation to other New Brunswick federal electoral districts | |||
| Federal electoral district | |||
| Legislature | House of Commons | ||
| MP |
| ||
| District created | 1914 | ||
| First contested | 1917 | ||
| Last contested | 2015 | ||
| District webpage | profile, map | ||
| Demographics | |||
| Population (2011)[1] | 81,759 | ||
| Electors (2015) | 59,284 | ||
| Area (km²)[1] | 1,678 | ||
| Pop. density (per km²) | 48.7 | ||
| Census divisions | Sunbury, Queens, York | ||
| Census subdivisions | Fredericton, Oromocto, Lincoln, Burton, New Maryland, St. Mary's 24, Minto | ||
Fredericton (formerly Fredericton—York—Sunbury) is a federal electoral district in New Brunswick, Canada, that has been represented in the House of Commons of Canada since 1988. Its population in 2001 was 82,782. Its predecessor riding, York—Sunbury, was represented in the House of Commons from 1917 to 1988.
The district includes the city of Fredericton, and the towns of Oromocto, Chipman, and Minto and vicinity.
The neighbouring ridings are Miramichi, Beauséjour, Fundy Royal, New Brunswick Southwest, and Tobique—Mactaquac.
Political geography
In the 2008 election, the Conservatives gained this seat from the Liberals. The Conservatives were strongest in the rural parts of this riding, outside of Fredericton proper. Within the city, the Liberals still held their own with the NDP capturing a handful of polls, one which includes the University of New Brunswick, and a couple along Parkside Drive.
| Historical population | ||
|---|---|---|
| Year | Pop. | ±% |
| 2001 | 82,782 | — |
| 2006 | 85,886 | +3.7% |
| 2011 | 93,181 | +8.5% |
History
"York—Sunbury" riding was created in 1914 from parts of Sunbury—Queen's and York ridings. Previously, York County was its own riding and Sunbury County was joined with Queens County.
The riding was named after York and Sunbury counties of which it was composed.
In 1987, York—Sunbury was abolished. Some rural areas in the southern parts of the riding were transferred to Carleton—Charlotte riding, and a largely uninhabited area, moved to Miramichi. The remainder was incorporated into "Fredericton" riding. It was renamed "Fredericton—York—Sunbury" shortly after the 1988 election.
This riding was abolished in 1996 when more rural areas were moved into other districts (particularly Tobique—Mactaquac and New Brunswick Southwest, and a new riding named "Fredericton" was created. The Minto and Chipman areas were added to the riding in 2003. As per the 2012 federal electoral redistribution, this riding will lose territory to Miramichi—Grand Lake, New Brunswick Southwest and Tobique—Mactaquac, and gain a small territory from New Brunswick Southwest.
Members of Parliament
This riding has elected the following Members of Parliament:
| Parliament | Years | Member | Party | |
|---|---|---|---|---|
| York—Sunbury Riding created from Sunbury—Queen's and York |
||||
| 13th | 1917–1921 | Harry Fulton McLeod | Government (Unionist) | |
| 1921–1921 | Richard Hanson | Conservative | ||
| 14th | 1921–1925 | |||
| 15th | 1925–1926 | |||
| 16th | 1926–1930 | |||
| 17th | 1930–1935 | |||
| 18th | 1935–1940 | William George Clark | Liberal | |
| 19th | 1940–1945 | Richard Hanson | National Government | |
| 20th | 1945–1947 | Hedley Francis Gregory Bridges | Liberal | |
| 1947–1949 | Milton Fowler Gregg | |||
| 21st | 1949–1953 | |||
| 22nd | 1953–1957 | |||
| 23rd | 1957–1958 | John Chester MacRae | Progressive Conservative | |
| 24th | 1958–1962 | |||
| 25th | 1962–1963 | |||
| 26th | 1963–1965 | |||
| 27th | 1965–1968 | |||
| 28th | 1968–1972 | |||
| 29th | 1972–1974 | Robert Howie | ||
| 30th | 1974–1979 | |||
| 31st | 1979–1980 | |||
| 32nd | 1980–1984 | |||
| 33rd | 1984–1988 | |||
| Fredericton | ||||
| 34th | 1988–1993 | Bud Bird | Progressive Conservative | |
| Fredericton—York—Sunbury | ||||
| 35th | 1993–1997 | Andy Scott | Liberal | |
| Fredericton | ||||
| 36th | 1997–2000 | Andy Scott | Liberal | |
| 37th | 2000–2004 | |||
| 38th | 2004–2006 | |||
| 39th | 2006–2008 | |||
| 40th | 2008–2011 | Keith Ashfield | Conservative | |
| 41st | 2011–2015 | |||
| 42nd | 2015–Present | Matt DeCourcey | Liberal | |
Election results
Fredericton, 2013 Representation Order
The riding lost territory to Miramichi—Grand Lake, New Brunswick Southwest and Tobique—Mactaquac, and gained a small territory from New Brunswick Southwest as of the 42nd Canadian federal election.
| Canadian federal election, 2015 | ||||||||
|---|---|---|---|---|---|---|---|---|
| Party | Candidate | Votes | % | ∆% | Expenditures | |||
| Liberal | Matt DeCourcey | 23,016 | 49.26 | +25.24 | – | |||
| Conservative | Keith Ashfield | 13,280 | 28.42 | -18.55 | – | |||
| Green | Mary Lou Babineau | 5,804 | 12.42 | +8.27 | – | |||
| New Democratic | Sharon Scott-Levesque | 4,622 | 9.89 | -14.41 | – | |||
| Total valid votes/Expense limit | 46,722 | 100.00 | $194,784.13 | |||||
| Total rejected ballots | 188 | 0.40 | – | |||||
| Turnout | 46,910 | 77.43 | – | |||||
| Eligible voters | 60,587 | |||||||
| Liberal gain from Conservative | Swing | +21.90 | ||||||
| Source: Elections Canada[2][3][4] | ||||||||
| 2011 federal election redistributed results[5] | |||
|---|---|---|---|
| Party | Vote | % | |
| Conservative | 18,213 | 46.97 | |
| New Democratic | 9,423 | 24.30 | |
| Liberal | 9,314 | 24.02 | |
| Green | 1,609 | 4.15 | |
| Others | 213 | 0.55 | |
Fredericton, 2003 Representation Order
| Canadian federal election, 2011 | ||||||||
|---|---|---|---|---|---|---|---|---|
| Party | Candidate | Votes | % | ∆% | Expenditures | |||
| Conservative | Keith Ashfield | 21,573 | 48.38 | +5.85 | $80,569.94 | |||
| New Democratic | Jesse Travis | 10,626 | 23.83 | +8.47 | $8,535.27 | |||
| Liberal | Randy McKeen | 10,336 | 23.18 | -8.35 | $53,834.28 | |||
| Green | Louise Comeau | 1,790 | 4.01 | -6.15 | $8,177.72 | |||
| Independent | Adam Scott Ness | 266 | 0.60 | – | $101.69 | |||
| Total valid votes/Expense limit | 44,591 | 100.0 | $83,547.51 | |||||
| Total rejected, unmarked and declined ballots | 207 | 0.46 | -0.11 | |||||
| Turnout | 44,798 | 64.24 | +2.11 | |||||
| Eligible voters | 69,732 | |||||||
| Conservative hold | Swing | -1.31 | ||||||
| Sources:[6][7] | ||||||||
| Canadian federal election, 2008 | ||||||||
|---|---|---|---|---|---|---|---|---|
| Party | Candidate | Votes | % | ∆% | Expenditures | |||
| Conservative | Keith Ashfield | 17,962 | 42.53 | +7.87 | $73,954.11 | |||
| Liberal | David Innes | 13,319 | 31.53 | -10.27 | $64,776.23 | |||
| New Democratic | Jesse Travis | 6,490 | 15.36 | -5.89 | $6,944.89 | |||
| Green | Mary Lou Babineau | 4,293 | 10.16 | +8.28 | $8,526.99 | |||
| Canadian Action | Ben Kelly | 168 | 0.39 | – | none listed | |||
| Total valid votes/Expense limit | 42,232 | 100.0 | $80,195 | |||||
| Total rejected, unmarked and declined ballots | 242 | 0.57 | +0.13 | |||||
| Turnout | 42,474 | 62.13 | -5.86 | |||||
| Eligible voters | 68,368 | |||||||
| Conservative gain from Liberal | Swing | +9.07 | ||||||
| Canadian federal election, 2006 | ||||||||
|---|---|---|---|---|---|---|---|---|
| Party | Candidate | Votes | % | ∆% | Expenditures | |||
| Liberal | Andy Scott | 19,649 | 41.80 | -4.95 | $63,544.32 | |||
| Conservative | Pat Lynch | 16,292 | 34.66 | +1.18 | $57,563.68 | |||
| New Democratic | John Carty | 9,988 | 21.25 | +3.89 | $33,143.96 | |||
| Green | Philip Duchastel | 884 | 1.88 | -0.47 | none listed | |||
| Independent | David Raymond Amos | 198 | 0.42 | – | none listed | |||
| Total valid votes/Expense limit | 47,011 | 100.0 | $75,043 | |||||
| Total rejected, unmarked and declined ballots | 207 | 0.44 | ||||||
| Turnout | 47,218 | 67.99 | ||||||
| Eligible voters | 69,453 | |||||||
| Liberal hold | Swing | -3.06 | ||||||
| Canadian federal election, 2004 | ||||||||
|---|---|---|---|---|---|---|---|---|
| Party | Candidate | Votes | % | ∆% | Expenditures | |||
| Liberal | Andy Scott | 19,819 | 46.75 | +8.97 | $60,726.40 | |||
| Conservative | Kent Fox | 14,193 | 33.48 | -21.22 | $61,658.27 | |||
| New Democratic | John Carty | 7,360 | 17.36 | +10.41 | $21,188.88 | |||
| Green | Daron Letts | 997 | 2.35 | – | $1,194.22 | |||
| Total valid votes/Expense limit | 42,396 | 100.0 | $73,437 | |||||
| Total rejected, unmarked and declined ballots | 264 | 0.62 | ||||||
| Turnout | 42,633 | 61.82 | ||||||
| Eligible voters | 68,968 | |||||||
| Liberal notional hold | Swing | +15.10 | ||||||
| Changes from 2000 are based on redistributed results. Conservative Party change is based on the combination of Canadian Alliance and Progressive Conservative Party totals. | ||||||||
| 2000 federal election redistributed results | |||
|---|---|---|---|
| Party | Vote | % | |
| Liberal | 15,151 | 37.78 | |
| Progressive Conservative | 12,185 | 30.38 | |
| Alliance | 9,753 | 24.32 | |
| New Democratic | 2,787 | 6.95 | |
| Others | 228 | 0.57 | |
Fredericton, 1996 Representation Order
| Canadian federal election, 2000 | ||||||||
|---|---|---|---|---|---|---|---|---|
| Party | Candidate | Votes | % | ∆% | ||||
| Liberal | Andy Scott | 14,175 | 38.60 | +4.48 | ||||
| Progressive Conservative | Raj Venugopal | 10,919 | 29.73 | -0.44 | ||||
| Alliance | Allan Neill | 8,814 | 24.00 | +2.24 | ||||
| New Democratic | Michael Dunn | 2,584 | 7.04 | -6.02 | ||||
| Natural Law | William Parker | 233 | 0.63 | -0.26 | ||||
| Total valid votes | 36,725 | 100.00 | ||||||
| Rejected ballots | 213 | 0.58 | ||||||
| Turnout | 36,938 | 62.8 | ||||||
Change for the Canadian Alliance is based on the 1997 results of its predecessors, the Reform Party.
| Canadian federal election, 1997 | ||||||||
|---|---|---|---|---|---|---|---|---|
| Party | Candidate | Votes | % | ∆% | ||||
| Liberal | Andy Scott | 12,252 | 34.12 | -12.54 | ||||
| Progressive Conservative | Cleveland Allaby | 10,835 | 30.17 | +0.95 | ||||
| Reform | Mark McCready | 7,815 | 21.76 | +4.74 | ||||
| New Democratic | Patricia Hughes | 4,689 | 13.06 | +8.06 | ||||
| Natural Law | Jeanne Geldart | 321 | 0.89 | +0.07 | ||||
| Total valid votes | 35,912 | 100.00 | ||||||
Change from 1993 is not based on redistributed results.
Fredericton—York—Sunbury, 1989–1996
| Canadian federal election, 1993 | ||||||||
|---|---|---|---|---|---|---|---|---|
| Party | Candidate | Votes | % | ∆% | ||||
| Liberal | Andy Scott | 21,868 | 46.66 | +6.94 | ||||
| Progressive Conservative | Bud Bird | 13,696 | 29.22 | -13.76 | ||||
| Reform | Jack Lamey | 7,977 | 17.02 | Ø | ||||
| New Democratic | Pauline MacKenzie | 2,343 | 5.00 | -5.32 | ||||
| Natural Law | Neil Dickie | 382 | 0.82 | Ø | ||||
| Canada Party | Steven Gillrie | 373 | 0.80 | Ø | ||||
| Independent | Doreen Fraser | 226 | 0.48 | -5.30 | ||||
| Total valid votes | 46 865 | 100.00 | ||||||
Doreen Fraser was nominated as a Confederation of Regions candidate, but was listed as an Independent because that party did not run enough candidates to be officially recognized.
Fredericton, 1987–1989
| Canadian federal election, 1988 | ||||||||
|---|---|---|---|---|---|---|---|---|
| Party | Candidate | Votes | % | ∆% | ||||
| Progressive Conservative | Bud Bird | 20,494 | 42.98 | -15.87 | ||||
| Liberal | Brad Woodside | 18,939 | 39.72 | +16.66 | ||||
| New Democratic | Allan Sharp | 4,922 | 10.32 | -6.89 | ||||
| Confederation of Regions | Greg Hargrove | 2,755 | 5.78 | Ø | ||||
| Rhinoceros | Chris Fullerton | 316 | 0.66 | Ø | ||||
| Independent | Harry Marshall | 253 | 0.53 | -0.35 | ||||
| Total valid votes | 47,679 | 100.00 | ||||||
York—Sunbury, 1917–1987
| Canadian federal election, 1984 | ||||||||
|---|---|---|---|---|---|---|---|---|
| Party | Candidate | Votes | % | ∆% | ||||
| Progressive Conservative | Robert Howie | 25,190 | 58.85 | +11.15 | ||||
| Liberal | Loretta Washburn | 9,873 | 23.06 | -13.90 | ||||
| New Democratic | Allan Sharp | 7,366 | 17.21 | +2.66 | ||||
| Independent | Harry Marshall | 377 | 0.88 | +0.34 | ||||
| Total valid votes | 42,806 | 100.00 | ||||||
| Canadian federal election, 1980 | ||||||||
|---|---|---|---|---|---|---|---|---|
| Party | Candidate | Votes | % | ∆% | ||||
| Progressive Conservative | Robert Howie | 18,246 | 47.70 | -7.35 | ||||
| Liberal | Dan Hurley | 14,138 | 36.96 | +7.02 | ||||
| New Democratic | Phillip Booker | 5,567 | 14.55 | +0.19 | ||||
| Independent | Harry Marshall | 205 | 0.54 | -0.11 | ||||
| Libertarian | Jay Nauss | 95 | 0.25 | Ø | ||||
| Total valid votes | 38,251 | 100.00 | ||||||
| Canadian federal election, 1979 | ||||||||
|---|---|---|---|---|---|---|---|---|
| Party | Candidate | Votes | % | ∆% | ||||
| Progressive Conservative | Robert Howie | 21,722 | 55.05 | +4.78 | ||||
| Liberal | Pete Mockler | 11,815 | 29.94 | -10.32 | ||||
| New Democratic | Phillip Booker | 5,665 | 14.36 | +4.90 | ||||
| Independent | Harry Marshall | 258 | 0.65 | Ø | ||||
| Total valid votes | 39,460 | 100.00 | ||||||
| Canadian federal election, 1974 | ||||||||
|---|---|---|---|---|---|---|---|---|
| Party | Candidate | Votes | % | ∆% | ||||
| Progressive Conservative | Robert Howie | 17,673 | 50.27 | -2.70 | ||||
| Liberal | John McNair | 14,153 | 40.26 | +2.97 | ||||
| New Democratic | Kevin White | 3,327 | 9.46 | -0.27 | ||||
| Total valid votes | 35,153 | 100.00 | ||||||
| Canadian federal election, 1972 | ||||||||
|---|---|---|---|---|---|---|---|---|
| Party | Candidate | Votes | % | ∆% | ||||
| Progressive Conservative | Robert Howie | 20,362 | 52.97 | -2.42 | ||||
| Liberal | Ray Dixon | 14,335 | 37.29 | -4.05 | ||||
| New Democratic | Beverley Wallace | 3,741 | 9.73 | +6.46 | ||||
| Total valid votes | 38,438 | 100.00 | ||||||
| Canadian federal election, 1968 | ||||||||
|---|---|---|---|---|---|---|---|---|
| Party | Candidate | Votes | % | ∆% | ||||
| Progressive Conservative | John Chester MacRae | 17,394 | 55.39 | +6.87 | ||||
| Liberal | Paul Burden | 12,983 | 41.34 | -4.40 | ||||
| New Democratic | Patrick Callaghan | 1,028 | 3.27 | -2.47 | ||||
| Total valid votes | 31,405 | 100.00 | ||||||
| Canadian federal election, 1965 | ||||||||
|---|---|---|---|---|---|---|---|---|
| Party | Candidate | Votes | % | ∆% | ||||
| Progressive Conservative | John Chester MacRae | 15,813 | 48.52 | +0.04 | ||||
| Liberal | Paul Burden | 14,909 | 45.74 | +0.78 | ||||
| New Democratic | Patrick Callaghan | 1,872 | 5.74 | +2.67 | ||||
| Total valid votes | 32,594 | 100.00 | ||||||
| Canadian federal election, 1963 | ||||||||
|---|---|---|---|---|---|---|---|---|
| Party | Candidate | Votes | % | ∆% | ||||
| Progressive Conservative | John Chester MacRae | 15,827 | 48.48 | -0.11 | ||||
| Liberal | David Dickson | 14,678 | 44.96 | +2.09 | ||||
| Social Credit | George Nickerson | 1,142 | 3.50 | -1.32 | ||||
| New Democratic | Lovell Clark | 1,001 | 3.07 | -0.65 | ||||
| Total valid votes | 32,648 | 100.00 | ||||||
| Canadian federal election, 1962 | ||||||||
|---|---|---|---|---|---|---|---|---|
| Party | Candidate | Votes | % | ∆% | ||||
| Progressive Conservative | John Chester MacRae | 15,255 | 48.59 | -4.83 | ||||
| Liberal | David Dickson | 13,461 | 42.87 | -1.45 | ||||
| Social Credit | George Nickerson | 1,513 | 4.82 | Ø | ||||
| New Democratic | John Simonds | 1,167 | 3.72 | +1.46 | ||||
| Total valid votes | 31,396 | 100.00 | ||||||
Changes for the New Democratic Party are based on the 1958 results of its predecessor, the Cooperative Commonwealth Federation.
| Canadian federal election, 1958 | ||||||||
|---|---|---|---|---|---|---|---|---|
| Party | Candidate | Votes | % | ∆% | ||||
| Progressive Conservative | John Chester MacRae | 15,813 | 53.42 | +3.96 | ||||
| Liberal | David Dickson | 13,118 | 44.32 | -3.89 | ||||
| Co-operative Commonwealth | Lawrence Bright | 669 | 2.26 | -0.07 | ||||
| Total valid votes | 29,600 | 100.00 | ||||||
| Canadian federal election, 1957 | ||||||||
|---|---|---|---|---|---|---|---|---|
| Party | Candidate | Votes | % | ∆% | ||||
| Progressive Conservative | John Chester MacRae | 13,356 | 49.46 | +6.71 | ||||
| Liberal | Milton Fowler Gregg | 13,018 | 48.21 | -4.49 | ||||
| Co-operative Commonwealth | Lawrence Bright | 628 | 2.33 | -2.21 | ||||
| Total valid votes | 27,002 | 100.00 | ||||||
| Canadian federal election, 1953 | ||||||||
|---|---|---|---|---|---|---|---|---|
| Party | Candidate | Votes | % | ∆% | ||||
| Liberal | Milton Fowler Gregg | 12,888 | 52.70 | +3.90 | ||||
| Progressive Conservative | Ewart Clair Atkinson | 10,455 | 42.75 | -1.91 | ||||
| Co-operative Commonwealth | Charles Watson | 1,111 | 4.54 | -1.99 | ||||
| Total valid votes | 24,454 | 100.00 | ||||||
| Canadian federal election, 1949 | ||||||||
|---|---|---|---|---|---|---|---|---|
| Party | Candidate | Votes | % | ∆% | ||||
| Liberal | Milton Fowler Gregg | 12,158 | 48.80 | -2.47 | ||||
| Progressive Conservative | Ewart Clair Atkinson | 11,127 | 44.66 | +10.65 | ||||
| Co-operative Commonwealth | Murray Young | 1,628 | 6.53 | -8.19 | ||||
| Total valid votes | 24,913 | 100.00 | ||||||
| By-election on 1947
On the death of Francis Bridges | ||||||
| Party | Candidate | Votes | % | ±% | ||
|---|---|---|---|---|---|---|
| Liberal | Milton Fowler Gregg | 12,237 | 51.27 | +3.05 | ||
| Progressive Conservative | Ernest William Sansom | 8,119 | 34.01 | -10.31 | ||
| Co-operative Commonwealth | Murray Young | 3,514 | 14.72 | +7.27 | ||
| Total valid votes | 23,870 | 100.00 | ||||
| Canadian federal election, 1945 | ||||||||
|---|---|---|---|---|---|---|---|---|
| Party | Candidate | Votes | % | ∆% | ||||
| Liberal | Hedley Francis Gregory Bridges | 10,828 | 48.22 | -0.68 | ||||
| Progressive Conservative | Ernest William Sansom | 9,953 | 44.32 | -6.78 | ||||
| Co-operative Commonwealth | Murray Young | 1,674 | 7.45 | Ø | ||||
| Total valid votes | 22,455 | 100.00 | ||||||
| Canadian federal election, 1940 | ||||||||
|---|---|---|---|---|---|---|---|---|
| Party | Candidate | Votes | % | ∆% | ||||
| National Government | Richard Hanson | 10,352 | 51.10 | +5.53 | ||||
| Liberal | Peter J. Hughes | 9,908 | 48.90 | +2.05 | ||||
| Total valid votes | 20,260 | 100.00 | ||||||
| Canadian federal election, 1935 | ||||||||
|---|---|---|---|---|---|---|---|---|
| Party | Candidate | Votes | % | ∆% | ||||
| Liberal | William George Clark | 9,296 | 46.85 | +15.92 | ||||
| Conservative | Richard Hanson | 9,042 | 45.57 | -23.50 | ||||
| Reconstruction | Errol MacDonald | 1,506 | 7.59 | Ø | ||||
| Total valid votes | 19,844 | 100.00 | ||||||
| Canadian federal election, 1930 | ||||||||
|---|---|---|---|---|---|---|---|---|
| Party | Candidate | Votes | % | ∆% | ||||
| Conservative | Richard Hanson | 10,166 | 69.07 | +3.61 | ||||
| Liberal | Fraser Winslow | 4,552 | 30.93 | -3.61 | ||||
| Total valid votes | 14,718 | 100.00 | ||||||
| Canadian federal election, 1926 | ||||||||
|---|---|---|---|---|---|---|---|---|
| Party | Candidate | Votes | % | ∆% | ||||
| Conservative | Richard Hanson | 8,451 | 65.46 | -7.46 | ||||
| Liberal | Peter J. Hughes | 4,459 | 34.54 | +7.46 | ||||
| Total valid votes | 12,910 | 100.00 | ||||||
| Canadian federal election, 1925 | ||||||||
|---|---|---|---|---|---|---|---|---|
| Party | Candidate | Votes | % | ∆% | ||||
| Conservative | Richard Hanson | 8,636 | 72.92 | +19.97 | ||||
| Liberal | Charles Robert Hawkins | 3,207 | 27.08 | -19.97 | ||||
| Total valid votes | 11,843 | 100.00 | ||||||
| Canadian federal election, 1921 | ||||||||
|---|---|---|---|---|---|---|---|---|
| Party | Candidate | Votes | % | ∆% | ||||
| Conservative | Richard Hanson | 7,777 | 52.95 | -0.62 | ||||
| Liberal | William James Osborne | 6,911 | 47.05 | +0.62 | ||||
| Total valid votes | 14,688 | 100.00 | ||||||
| By-election on 1921 | ||||||
| Party | Candidate | Votes | % | ±% | ||
|---|---|---|---|---|---|---|
| Conservative | Richard Hanson | 7,107 | 53.57 | -15.65 | ||
| Liberal | Ernest W. Stairs | 6,160 | 46.43 | +15.65 | ||
| Total valid votes | 13,267 | 100.00 | ||||
| Canadian federal election, 1917 | ||||||||
|---|---|---|---|---|---|---|---|---|
| Party | Candidate | Votes | % | |||||
| Government (Unionist) | Harry Fulton McLeod | 6,957 | 69.22 | |||||
| Liberal | Nelson Brown | 3,093 | 30.78 | |||||
| Total valid votes | 10,050 | 100.00 | ||||||
Student Vote results
2011 election
In 2011, a Student Vote was conducted at participating Canadian schools to parallel the 2011 Canadian federal election results. The vote was designed to educate students and simulate the electoral process for persons who have not yet reached the legal majority. Schools with a large student body that reside in another electoral district had the option to vote for candidates outside of the electoral district then where they were physically located.[8]
| Canadian federal election, 2011 | ||||||||
|---|---|---|---|---|---|---|---|---|
| Party | Candidate | Votes | % | |||||
| New Democratic | Jesse Travis | 1,067 | 30.02 | |||||
| Conservative | Keith Ashfield | 1,035 | 29.12 | |||||
| Green | Louise Comeau | 648 | 18.23 | |||||
| Liberal | Randy McKeen | 631 | 17.75 | |||||
| Independent | Adam Scott Ness | 173 | 4.87 | |||||
| Total valid votes | 3,554 | 100.00 | ||||||
See also
References
- "(Code 13003) Census Profile". 2011 census. Statistics Canada. 2012. Retrieved 2011-03-03.
- Campaign expense data from Elections Canada
- Riding history from the Library of Parliament
- York-Sunbury 1917-1987
- Fredericton 1987-1989
- Fredericton—York—Sunbury 1989-1996
- Fredericton 1996-present
Notes
- 1 2 Statistics Canada: 2012
- ↑ Elections Canada – Confirmed candidates for Fredericton, 30 September 2015
- ↑ Elections Canada – Preliminary Election Expenses Limits for Candidates
- ↑
- ↑ Pundits' Guide to Canadian Elections
- ↑ Elections Canada – Official voting results, Forty-first general election, 2011
- ↑ Elections Canada – Candidate's electoral campaign return, 41st general election
- ↑ "School by School results". Student Vote Canada. Retrieved 2013-06-12.