Canadian federal election, 1921
| | |||||||||||||||||||||||||||||||||||||||||||||||||||||||||||
| |||||||||||||||||||||||||||||||||||||||||||||||||||||||||||
| |||||||||||||||||||||||||||||||||||||||||||||||||||||||||||
|
| |||||||||||||||||||||||||||||||||||||||||||||||||||||||||||
| |||||||||||||||||||||||||||||||||||||||||||||||||||||||||||


The Canadian federal election of 1921 was held on December 6, 1921, to elect members of the Canadian House of Commons of the 14th Parliament of Canada. The Union government that had governed Canada through the First World War was defeated, and replaced by a Liberal government under the young leader William Lyon Mackenzie King. A new third party, the Progressive Party, won the second most seats in the election.
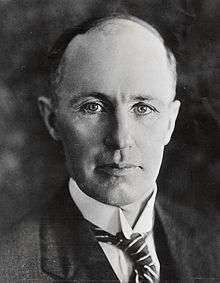
Since the 1911 election, the country had been governed by the Conservatives, first under the leadership of Prime Minister Robert Borden and then under Prime Minister Arthur Meighen. During the war, the Conservatives had united with the pro-conscription Liberal-Unionists and formed a Union government. A number of Members of Parliament (MPs), mostly Quebecers, stayed loyal to Sir Wilfrid Laurier, however, and they maintained their independence. When Laurier died, he was replaced as leader by the Ontarian Mackenzie King. After the 1919 federal budget, a number of western unionist MPs, who were former Liberals, left the Union government in protest against high tariffs on farm products imposed by the budget. Led by Thomas Alexander Crerar, the group became known as the Progressive Party. Also running were a number of Labour advocates, foremost amongst them J. S. Woodsworth of Winnipeg, who had organized their political movement after the Winnipeg general strike of 1919. Meighen had played a key role in violently suppressing the strikers and this earned him the animosity of organized labour.
Meighen attempted to make the "Unionist" party a permanent alliance of Tories and Liberals by renaming it the National Liberal and Conservative Party, but the name change failed, and most Unionist Liberals either returned to the Liberal fold or joined the new Progressive Party. Besides the labour strife and farm tariffs in the Prairie provinces, the Conscription Crisis of 1917 had a lasting effect on Tory fortunes by making the party virtually unelectable in Quebec.
The election was the first in which the majority of Canadian women were allowed to vote, thanks to reforms passed by the Conservatives. Five women also ran for office. Agnes Macphail of the Progressive Party was elected as the first woman MP in Canada.
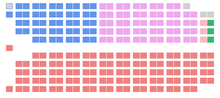
Parliament was split three ways by this election. King's Liberals won a majority government of just one seat but won all of Quebec, much of the Maritime Provinces, and a good portion of Ontario.
The Progressive Party, including the United Farmers of Alberta (UFA), won the second largest number of seats, dominating the West, and winning almost a third of the seats in Ontario. Liberal and Conservative candidates were shut out in Alberta, with 10 UFA and two Labour candidates taking the province's 12 federal seats. The party won only one seat east of Ontario, however. Despite winning the second most seats, it declined to form the official opposition. It would be the only Canadian federal election before 1993 in which a party other than the Liberals or the (Progressive) Conservatives won the second most number of seats.
The Conservatives lost the most seats up to that time of any governing party at the federal level. They won fewer seats than the Progressives (despite having more popular votes) but wound up forming the official opposition. The Conservatives won much of Ontario and had some support in the Maritimes and British Columbia but won no seats in the Prairies or in Quebec.
Three Independent Labour MPs were elected: J. S. Woodsworth won his seat largely from his role in the 1919 Winnipeg general strike, and William Irvine and Joseph Tweed Shaw were elected in Calgary. The voter turnout was 67.7%.
Majority or minority?
The government that King formed in the parliament resulting from this election was Canada's first minority government. Although King's party won a slim majority of seats at the election, resignations changed the parliament from a small majority to minority.
The Liberal Party lost two by-elections to Conservative candidates, but had gained two seats from Progressives who crossed the floor, so its majority was not affected by these losses. From November 25, 1924, to the dissolution of parliament, it held a two-seat majority because of its victory in a by-election in a seat that had been held by the Conservatives.
The Progressive caucus was less united than the Liberals or Conservatives, due to the formation of the Ginger Group and the semi-autonomous United Farmers of Alberta group. The Farmer MPs had promised among other things that they would reject the traditional Parliamentary traditions such as that of bending to the will of the party leader and whip. Many Progressives argued that an MP should be able to vote against the party line so long as the vote was in accordance to his constituents' wishes. As a result, King always found enough Progressive MPs who were willing to back him on crucial votes and generally had a working majority, until after four years his government was brought down by an adverse vote due to a moment of confusion.
National results
| ↓ | ||||
| 118 | 58 | 49 | 10 | |
| Liberal | Progressive | Conservative | O | |
| Party | Party leader | # of candidates |
Seats | Popular vote | |||||
|---|---|---|---|---|---|---|---|---|---|
| 1917 | Elected | % Change | # | % | pp Change | ||||
| Liberal | W. L. Mackenzie King | 204 | 82 | 118 | +43.9% | 1,285,998 | 41.15% | +2.34 | |
| Progressive | T. A. Crerar | 137 | * | 58 | * | 658,976 | 21.09% | * | |
| Conservative | Arthur Meighen | 204 | 153 | 49 | -68.0% | 935,651 | 29.95% | -26.98 | |
| Labour | J. S. Woodsworth | 28 | - | 3 | 85,388 | 2.73% | +0.90 | ||
| Independent | 45 | - | 2 | 94,901 | 3.04% | +2.40 | |||
| United Farmers of Alberta | 2 | * | 2 | * | 22,251 | 0.71% | * | ||
| Independent Conservative | 2 | * | 1 | * | 12,359 | 0.40% | * | ||
| United Farmers of Ontario | 1 | * | 1 | * | 3,919 | 0.13% | * | ||
| Independent Progressive | 1 | * | 1 | * | 3,309 | 0.115% | * | ||
| Unknown | 9 | - | - | - | 15,293 | 0.49% | +0.29 | ||
| Socialist | 1 | * | - | * | 3,094 | 0.10% | * | ||
| Independent Liberal | 1 | - | - | - | 2,764 | 0.09% | -0.32 | ||
| Total | 635 | 235 | 235 | - | 3,123,903 | 100% | |||
| Sources: http://www.elections.ca -- History of Federal Ridings since 1867 | |||||||||
Note:
* not applicable - the party was not recognized in the previous election
Vote and seat summaries
Results by province
| Party name | BC | AB | SK | MB | ON | QC | NB | NS | PE | YK | Total | ||
|---|---|---|---|---|---|---|---|---|---|---|---|---|---|
| Liberal | Seats: | 3 | - | 1 | 3 | 21 | 65 | 5 | 16 | 4 | - | 118 | |
| Popular vote (%): | 29.8 | 15.8 | 18.7 | 18.9 | 30.1 | 70.2 | 50.2 | 52.4 | 45.7 | 47.6 | 41.2 | ||
| Progressive | Seats: | 3 | 8 | 15 | 11 | 20 | - | 1 | - | - | 58 | ||
| Vote (%): | 11.7 | 39.6 | 61.7 | 41.9 | 25.6 | 3.1 | 8.7 | 10.2 | 12.3 | 21.1 | |||
| Conservative | Seats: | 7 | - | - | - | 36 | - | 5 | - | - | 1 | 49 | |
| Vote (%): | 47.9 | 20.3 | 16.3 | 24.4 | 38.8 | 18.5 | 39.4 | 32.3 | 37.2 | 51.1 | 30.0 | ||
| Labour | Seats: | - | 2 | - | 1 | - | - | - | - | 3 | |||
| Vote (%): | 6.8 | 11.1 | 0.8 | 5.7 | 2.3 | 0.7 | 3.5 | 4.8 | 2.7 | ||||
| Independent | Seats: | - | - | 2 | - | - | - | 2 | |||||
| Vote (%): | 3.5 | 7.4 | 1.9 | 6.6 | 1.7 | 1.3 | 3.0 | ||||||
| United Farmers of Alberta | Seats: | 2 | 2 | ||||||||||
| Vote (%): | 12.9 | 0.7 | |||||||||||
| Independent Conservative | Seats: | 1 | - | 1 | |||||||||
| Vote (%): | 0.9 | 0.3 | 0.4 | ||||||||||
| United Farmers of Ontario | Seats: | 1 | 1 | ||||||||||
| Vote (%): | 0.3 | 0.1 | |||||||||||
| Independent Progressive | Seats: | 1 | 1 | ||||||||||
| Vote (%): | 0.3 | 0.1 | |||||||||||
| Total seats | 13 | 12 | 16 | 15 | 82 | 65 | 11 | 16 | 4 | 1 | 235 | ||
| Parties that won no seats: | |||||||||||||
| Other | Vote (%): | 0.4 | 0.2 | 2.4 | 0.6 | 1.6 | 5.2 | 1.0 | |||||
| Socialist | Vote (%): | 1.8 | 0.1 | ||||||||||
| Independent Liberal | Vote (%): | 0.2 | 0.1 | ||||||||||
See also
- List of Canadian federal general elections
- List of political parties in Canada
- 11th Canadian Parliament
- 14th Canadian Parliament