Galician parliamentary election, 1997
Galician parliamentary election, 1997
|
|
|
|
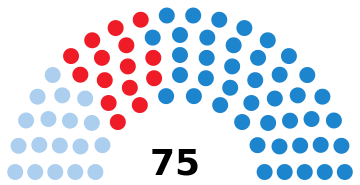
All 75 seats in the Parliament of Galicia
38 seats needed for a majority |
| Opinion polls |
| Registered |
2,565,131  11.9% 11.9% |
| Turnout |
1,603,731 (62.5%)
 1.7 pp 1.7 pp |
| |
First party |
Second party |
Third party |
| |
.jpg) |
.jpg) |
.jpg) |
| Leader |
Manuel Fraga |
Xosé Manuel Beiras |
Abel Caballero |
| Party |
PPdeG |
BNG |
PSdeG–EG–OV |
| Leader since |
1989 |
1982 |
26 October 1996 |
| Leader's seat |
Lugo |
A Coruña |
Pontevedra |
| Last election |
43 seats, 52.1% |
13 seats, 18.4% |
19 seats, 27.1%[lower-alpha 1] |
| Seats won |
42 |
18 |
15 |
| Seat change |
1 |
5 |
4 |
| Popular vote |
832,751 |
395,435 |
310,508 |
| Percentage |
52.2% |
24.8% |
19.5% |
| Swing |
0.1 pp |
6.4 pp |
7.6 pp |
|
|
|
The 1997 Galician parliamentary election was held on Sunday, 19 October 1997, to elect the 5th Parliament of Galicia, the regional legislature of the Spanish autonomous community of Galicia. All 75 seats in the Parliament were up for election.
Electoral system
The 75 members of the Parliament of Galicia were elected in 4 multi-member districts, corresponding to Galicia's four provinces, using the D'Hondt method and a closed-list proportional representation. Each district was entitled to an initial minimum of 10 seats, with the remaining 35 seats being allocated among the four provinces in proportion to their populations. For the 1997 election, seats were distributed as follows: Corunna (24), Lugo (15), Ourense (14) and Pontevedra (22).
Voting was on the basis of universal suffrage in a secret ballot. Only lists polling above 5% of the total vote in each district (which includes blank ballots—for none of the above) were entitled to enter the seat distribution.[1]
Opinion polls
Vote
Poll results are listed in the table below in reverse chronological order, showing the most recent first. The highest percentage figure in each polling survey is displayed in bold, and the background shaded in the leading party's colour. In the instance that there is a tie, then no figure is shaded. The lead column on the right shows the percentage-point difference between the two parties with the highest figures. Poll results use the date the survey's fieldwork was done, as opposed to the date of publication. However, if such date is unknown, the date of publication will be given instead.
| Date |
Polling Firm/Source |
PP |
PSdeG |
BNG |
IU |
Oth. |
Lead |
|
|
|
|
| 19 Oct 1997 |
Regional Election |
52.2 |
19.5 |
24.8 |
0.9 |
2.6 |
27.4 |
| Exit polls |
| 12 Oct |
Demoscopia |
51.5 |
23.1 |
22.8 |
1.1 |
1.5 |
28.4 |
| 7 Oct |
PP |
52.3 |
24.5 |
20.5 |
|
2.7 |
27.8 |
| 3–4 Oct |
Opina |
50.7 |
25.1 |
21.5 |
1.2 |
1.5 |
25.6 |
| 19–26 Sep |
CIS |
51.5 |
25.2 |
20.5 |
1.4 |
1.4 |
26.3 |
| 26 Jul |
Sondaxe |
50.0 |
24.0 |
19.0 |
|
7.0 |
26.0 |
| 1–4 Apr |
Obradoiro |
48.0 |
20.0 |
20.0 |
|
12.0 |
28.0 |
| 1997 |
| 1996 |
| 1995 |
| 1994 |
| 17 Oct 1993 |
Regional Election |
52.1 |
23.7 |
18.4 |
3.1 |
2.7 |
28.4 |
Seat projections
Opinion polls showing seat projections are displayed in the table below. The highest seat figures in each polling survey have their background shaded in the leading party's colour. In the instance that there is a tie, then no figure is shaded. 38 seats were required for an absolute majority in the Parliament of Galicia.
38 seats needed for majority
| Date |
Polling Firm/Source |
PP |
PSdeG |
BNG |
IU |
Others |
|
|
|
|
| 19 Oct 1997 |
Regional Election |
42 |
15 |
18 |
0 |
0 |
| Exit polls |
| 12 Oct |
Demoscopia |
41−42 |
16−18 |
16−18 |
0 |
0 |
| 7 Oct |
PP |
41−42 |
17−19 |
15−16 |
0 |
0 |
| 23–28 Sep |
PSOE |
37−38 |
23−25 |
13−14 |
0 |
0 |
| 3–4 Oct |
Opina |
39−40 |
21−22 |
14−15 |
0 |
0 |
| 29 Sep |
PP |
40−41 |
18−19 |
16−17 |
0 |
0 |
| 29 Sep |
Sondaxe |
39 |
19 |
17 |
0 |
0 |
| 19–26 Sep |
CIS |
41−42 |
19−20 |
14 |
0 |
0 |
| 26 Jul |
Sondaxe |
40 |
20 |
15 |
0 |
0 |
| 20 Jun–8 Jul |
Infortécnica |
37−41 |
19−23 |
15−16 |
0 |
0 |
| 10–20 Apr |
PSOE |
37 |
26 |
12 |
0 |
0 |
| 1–4 Apr |
Obradoiro |
40 |
18 |
17 |
0 |
0 |
| 1997 |
| 1996 |
| 1995 |
| 1994 |
| 17 Oct 1993 |
Regional Election |
43 |
19 |
13 |
0 |
0 |
Results
Overall
| Parties with less than 1.0% of the vote |
36,036 |
2.26 |
— |
0 |
±0 |
|
United Left (IU) |
13,964 | 0.88 | New |
0 | ±0 |
|
Galician Democracy (DG) |
11,538 | 0.72 | New |
0 | ±0 |
|
Galician People's Front (FPG) |
3,395 | 0.21 | New |
0 | ±0 |
|
Humanist Party (PH) |
2,543 | 0.16 | –0.01 |
0 | ±0 |
|
Party of Self-employed and Professionals (AUTONOMO) |
2,136 | 0.13 | New |
0 | ±0 |
|
Social Democratic Party of Law (SDD) |
1,129 | 0.07 | New |
0 | ±0 |
|
The Move (Movida) |
939 | 0.06 | New |
0 | ±0 |
|
Spanish Falange of the JONS (FE–JONS) |
392 | 0.02 | New |
0 | ±0 |
|
Blank ballots |
20,937 | 1.31 | +0.40 |
|
|
| Total |
1,595,667 | 100.00 | |
75 | ±0 |
|
| Valid votes |
1,595,667 | 99.50 | –0.02 |
|
| Invalid votes |
8,064 | 0.50 | +0.02 |
| Votes cast / turnout |
1,603,731 | 62.52 | –1.67 |
| Abstentions |
961,400 | 37.48 | +1.67 |
| Registered voters |
2,565,131 | |
|
| Source: Argos Information Portal |
- 1 2 PSdeG–EG–OV results are compared to the combined totals of PSdeG–PSOE, EU–UG and OVG in the 1993 election.
|
References