Results breakdown of the Spanish general election, 2008 (Congress)
| |
Main: Spanish general election, 2008 | |||
|---|---|---|---|---|
| Sunday, 9 March 2008 | ||||
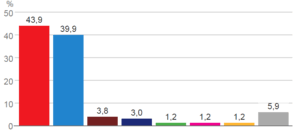 | ||||
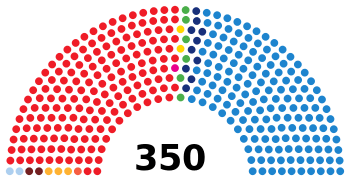
Party | Votes | % | MPs | |
| PSOE | 11,289,335 | 43.9% | 169 | |
| PP | 10,278,010 | 39.9% | 154 | |
| IU | 969,946 | 3.8% | 2 | |
| CiU | 779,425 | 3.0% | 10 | |
| EAJ/PNV | 306,128 | 1.2% | 6 | |
| UPyD | 306,079 | 1.2% | 1 | |
| esquerra | 298,139 | 1.2% | 3 | |
| Others | 1,507,801 | 5.9% | 5 | |
| Total | 25,734,863 | 100.0% | 350 | |
This is the results breakdown of the Congress of Deputies election held in Spain on 9 March 2008.

Nationwide
Overall
 | ||||||
| Party | Popular vote | Seats | ||||
|---|---|---|---|---|---|---|
| Votes | % | ±pp | Won | +/− | ||
| Spanish Socialist Workers' Party (PSOE) | 11,289,335 | 43.87 | +1.28 | 169 | +5 | |
| People's Party (PP) | 10,278,010 | 39.94 | +2.23 | 154 | +6 | |
| United Left (IU) | 969,946 | 3.77 | –1.19 | 2 | –3 | |
| Convergence and Union (CiU) | 779,425 | 3.03 | –0.20 | 10 | ±0 | |
| Basque Nationalist Party (EAJ/PNV) | 306,128 | 1.19 | –0.44 | 6 | –1 | |
| Union, Progress and Democracy (UPyD) | 306,079 | 1.19 | New | 1 | +1 | |
| Republican Left of Catalonia (esquerra) | 298,139 | 1.16 | –1.36 | 3 | –5 | |
| Galician Nationalist Bloc (BNG) | 212,543 | 0.83 | +0.02 | 2 | ±0 | |
| Canarian Coalition–Canarian Nationalist Party (CC–PNC)[lower-alpha 1] | 174,629 | 0.68 | –0.25 | 2 | –1 | |
| Andalusian Coalition (CA)[lower-alpha 2] | 68,679 | 0.27 | –0.52 | 0 | ±0 | |
| Yes to Navarre (NaBai) | 62,398 | 0.24 | ±0.00 | 1 | ±0 | |
| Basque Solidarity (EA) | 50,371 | 0.20 | –0.11 | 0 | –1 | |
| Citizens–Party of the Citizenry (C's) | 46,313 | 0.18 | New | 0 | ±0 | |
| Anti-Bullfighting Party Against Mistreatment of Animals (PACMA) | 44,795 | 0.17 | New | 0 | ±0 | |
| The Greens (LV) | 41,531 | 0.16 | New | 0 | ±0 | |
| Aragonese Party (PAR) | 40,054 | 0.16 | +0.02 | 0 | ±0 | |
| Aragonese Union (CHA) | 38,202 | 0.15 | –0.21 | 0 | –1 | |
| New Canaries–Canarian Centre (NC–CCN) | 38,024 | 0.15 | New | 0 | ±0 | |
| The Greens–Green Group (LV–GV) | 30,840 | 0.12 | +0.07 | 0 | ±0 | |
| Aralar (Aralar) | 29,989 | 0.12 | –0.03 | 0 | ±0 | |
| Bloc–Initiative–Greens (BNV–IdPV–EV–EE) | 29,760 | 0.12 | –0.04 | 0 | ±0 | |
| Unity for the Islands (UIB) | 25,454 | 0.10 | –0.06 | 0 | ±0 | |
| Parties with less than 0.1% of the vote | 288,037 | 1.12 | — | 0 | ±0 | |
|---|---|---|---|---|---|---|
| For a Fairer World (PUM+J) | 23,318 | 0.09 | New | 0 | ±0 | |
| The Greens of Europe (LVE) | 20,419 | 0.08 | ±0.00 | 0 | ±0 | |
| Social Democratic Party (PSD) | 20,126 | 0.08 | New | 0 | ±0 | |
| Communist Party of the Peoples of Spain (PCPE) | 20,030 | 0.08 | +0.03 | 0 | ±0 | |
| Citizens for Blank Votes (CenB) | 14,193 | 0.06 | –0.10 | 0 | ±0 | |
| Spanish Falange of the JONS (FE–JONS) | 14,023 | 0.05 | ±0.00 | 0 | ±0 | |
| National Democracy (DN) | 12,836 | 0.05 | –0.01 | 0 | ±0 | |
| The Greens–The Ecologist Alternative (EV–AE) | 12,561 | 0.05 | –0.07 | 0 | ±0 | |
| Family and Life Party (PFyV) | 9,882 | 0.04 | –0.02 | 0 | ±0 | |
| Humanist Party (PH) | 9,056 | 0.04 | –0.04 | 0 | ±0 | |
| Party of Almeria (PdeAL) | 8,451 | 0.03 | New | 0 | ±0 | |
| The Greens (EV–LV) | 7,824 | 0.03 | –0.11 | 0 | ±0 | |
| Navarrese Cannabis Representation (RCN/NOK) | 7,769 | 0.03 | –0.04 | 0 | ±0 | |
| Internationalist Socialist Workers' Party (POSI) | 7,386 | 0.03 | ±0.00 | 0 | ±0 | |
| Spanish Alternative (AES) | 7,300 | 0.03 | New | 0 | ±0 | |
| Spain 2000 (E–2000) | 6,906 | 0.03 | +0.01 | 0 | ±0 | |
| Catalan Republican Party (RC) | 6,746 | 0.03 | New | 0 | ±0 | |
| Valencian Coalition (CVa) | 5,424 | 0.02 | New | 0 | ±0 | |
| Unsubmissive Seats (Ei) | 5,035 | 0.02 | +0.01 | 0 | ±0 | |
| Commoners' Land (TC) | 4,796 | 0.02 | –0.01 | 0 | ±0 | |
| Authentic Falange (FA) | 4,607 | 0.02 | ±0.00 | 0 | ±0 | |
| Leonese People's Union (UPL) | 4,509 | 0.02 | –0.03 | 0 | ±0 | |
| Internationalist Solidarity and Self-Management (SAIn) | 3,885 | 0.02 | New | 0 | ±0 | |
| Engine and Sports Alternative (AMD) | 3,829 | 0.01 | New | 0 | ±0 | |
| Pensioners in Action Party (PDLPEA) | 3,050 | 0.01 | New | 0 | ±0 | |
| Riojan Party (PR) | 2,837 | 0.01 | New | 0 | ±0 | |
| National Alliance (AN) | 2,737 | 0.01 | +0.01 | 0 | ±0 | |
| Alternative in Blank (ABLA) | 2,460 | 0.01 | New | 0 | ±0 | |
| United Extremadura (EU) | 2,346 | 0.01 | –0.01 | 0 | ±0 | |
| The Greens–Green Alternative (EV–AV) | 2,028 | 0.01 | ±0.00 | 0 | ±0 | |
| Carlist Party (PC) | 1,956 | 0.01 | ±0.00 | 0 | ±0 | |
| Party for Catalonia (PxCat) | 1,919 | 0.01 | New | 0 | ±0 | |
| Non-Smokers' Party (PNF) | 1,616 | 0.01 | New | 0 | ±0 | |
| Union for Leganés (ULEG) | 1,566 | 0.01 | New | 0 | ±0 | |
| Spanish Front (Frente) | 1,539 | 0.01 | +0.01 | 0 | ±0 | |
| Liberal Democratic Centre (CDL) | 1,503 | 0.01 | New | 0 | ±0 | |
| Valencian Nationalist Option (ONV) | 1,490 | 0.01 | New | 0 | ±0 | |
| Democratic and Social Centre (CDS) | 1,362 | 0.01 | –0.12 | 0 | ±0 | |
| Andecha Astur (AA) | 1,299 | 0.01 | ±0.00 | 0 | ±0 | |
| Regionalist Party of the Leonese Country (PREPAL) | 1,278 | 0.00 | –0.01 | 0 | ±0 | |
| Spanish Democratic Centre (CDEs) | 1,047 | 0.00 | New | 0 | ±0 | |
| Canarian Nationalist Alternative (ANC) | 1,017 | 0.00 | New | 0 | ±0 | |
| Civil Liberties Party (PLCI) | 888 | 0.00 | New | 0 | ±0 | |
| Unity (Unidá) | 848 | 0.00 | New | 0 | ±0 | |
| Liberal Party of State Employment and Housing (PLEVE) | 786 | 0.00 | New | 0 | ±0 | |
| Internationalist Struggle (LI (LIT–CI)) | 722 | 0.00 | ±0.00 | 0 | ±0 | |
| Unity of the People (UP) | 699 | 0.00 | New | 0 | ±0 | |
| For the Valencian Republic (plRV) | 645 | 0.00 | New | 0 | ±0 | |
| Centrist Party (PCTR) | 509 | 0.00 | New | 0 | ±0 | |
| Movement for the Unity of the Canarian People (MUPC) | 497 | 0.00 | New | 0 | ±0 | |
| Aragon United Citizens Party (pCUA) | 475 | 0.00 | New | 0 | ±0 | |
| Independent Progressives of Canaries Citizen Union (UCPIC) | 464 | 0.00 | New | 0 | ±0 | |
| Kingdom of Valencia Identity (IRV) | 449 | 0.00 | –0.01 | 0 | ±0 | |
| Regionalist Unity of Castile and León (URCL) | 423 | 0.00 | New | 0 | ±0 | |
| State of Spain Unionist Party (PUEDE) | 414 | 0.00 | New | 0 | ±0 | |
| El Bierzo People (PB–UB) | 385 | 0.00 | New | 0 | ±0 | |
| Islander Party of the Balearic Islands (PIIB) | 360 | 0.00 | New | 0 | ±0 | |
| Christian Positivist Party (PPCr) | 300 | 0.00 | ±0.00 | 0 | ±0 | |
| Carlist Traditionalist Communion (CTC) | 218 | 0.00 | New | 0 | ±0 | |
| Asturian Democratic Convergence (CDAS) | 216 | 0.00 | New | 0 | ±0 | |
| Merindades of Castile Initiative (IMC) | 202 | 0.00 | New | 0 | ±0 | |
| Castilian Unity (UdCa) | 198 | 0.00 | ±0.00 | 0 | ±0 | |
| European Ibero-American Alliance Party (PAIE) | 174 | 0.00 | New | 0 | ±0 | |
| Workers for Democracy Coalition (TD) | 159 | 0.00 | ±0.00 | 0 | ±0 | |
| Regionalist Party of Guadalajara (PRGU) | 152 | 0.00 | ±0.00 | 0 | ±0 | |
| Balearic Alliance (ABA) | 145 | 0.00 | New | 0 | ±0 | |
| Electronic Voting Assembly (AVE) | 144 | 0.00 | New | 0 | ±0 | |
| Liberal Centrist Union (UCL) | 124 | 0.00 | ±0.00 | 0 | ±0 | |
| Alliance for Burgos (AxB) | 123 | 0.00 | New | 0 | ±0 | |
| Burgalese Citizen Initiative (ICBur) | 109 | 0.00 | New | 0 | ±0 | |
| We Are (N Som) | 105 | 0.00 | New | 0 | ±0 | |
| Independents for Cuenca (ixC) | 100 | 0.00 | New | 0 | ±0 | |
| Citizen Group (AGRUCI) | 79 | 0.00 | New | 0 | ±0 | |
| Falangist Movement of Spain (MFE) | 68 | 0.00 | New | 0 | ±0 | |
| Aitch Party (PHache) | 0 | 0.00 | New | 0 | ±0 | |
| Blank ballots | 286,182 | 1.11 | –0.47 | |||
| Total | 25,734,863 | 100.00 | 350 | ±0 | ||
| Valid votes | 25,734,863 | 99.36 | +0.37 | |||
| Invalid votes | 165,576 | 0.64 | –0.37 | |||
| Votes cast / turnout | 25,900,439 | 73.85 | –1.81 | |||
| Abstentions | 9,172,740 | 26.15 | +1.81 | |||
| Registered voters | 35,073,179 | |||||
| Source: Ministry of the Interior | ||||||
Distribution by constituency
| Constituency | PSOE | PP | IU | CiU | PNV | UPyD | esquerra | BNG | CC | NaBai | ||||||||||
|---|---|---|---|---|---|---|---|---|---|---|---|---|---|---|---|---|---|---|---|---|
| % | S | % | S | % | S | % | S | % | S | % | S | % | S | % | S | % | S | % | S | |
| A Coruña | 41.0 | 3 | 42.7 | 4 | 1.6 | − | 0.6 | − | 12.0 | 1 | ||||||||||
| Álava | 40.7 | 2 | 26.5 | 1 | 4.2 | − | 18.7 | 1 | 1.2 | − | ||||||||||
| Almería | 42.0 | 3 | 49.9 | 3 | 2.7 | − | 0.5 | − | ||||||||||||
| Albacete | 45.7 | 2 | 47.4 | 2 | 3.4 | − | 1.3 | − | ||||||||||||
| Alicante | 41.1 | 5 | 52.4 | 7 | 2.3 | − | 0.7 | − | 0.2 | − | ||||||||||
| Asturias | 46.9 | 4 | 41.6 | 4 | 7.2 | − | 1.4 | − | ||||||||||||
| Ávila | 35.0 | 1 | 58.6 | 2 | 2.6 | − | 1.4 | − | ||||||||||||
| Badajoz | 52.3 | 3 | 41.8 | 3 | 3.1 | − | 0.8 | − | ||||||||||||
| Balearic | 44.2 | 4 | 44.0 | 4 | 2.8 | − | 0.7 | − | ||||||||||||
| Barcelona | 46.8 | 16 | 16.8 | 6 | 5.6 | 1 | 19.6 | 6 | 0.2 | − | 6.6 | 2 | ||||||||
| Biscay | 37.0 | 4 | 18.4 | 1 | 4.4 | − | 31.1 | 3 | 1.0 | − | ||||||||||
| Burgos | 40.5 | 2 | 50.5 | 2 | 2.9 | − | 2.1 | − | ||||||||||||
| Cáceres | 52.2 | 2 | 41.9 | 2 | 2.7 | − | 0.8 | − | ||||||||||||
| Cádiz | 51.1 | 5 | 38.2 | 4 | 4.8 | − | 0.9 | − | ||||||||||||
| Cantabria | 43.6 | 2 | 50.0 | 3 | 2.3 | − | 1.4 | − | ||||||||||||
| Castellón | 44.2 | 2 | 49.0 | 3 | 2.1 | − | 0.6 | − | 0.3 | − | ||||||||||
| Ceuta | 40.5 | − | 55.1 | 1 | 0.7 | − | 1.3 | − | ||||||||||||
| Ciudad Real | 46.8 | 2 | 47.8 | 3 | 2.6 | − | 0.8 | − | ||||||||||||
| Córdoba | 50.8 | 4 | 37.6 | 2 | 7.0 | − | 0.6 | − | ||||||||||||
| Cuenca | 45.2 | 1 | 49.8 | 2 | 2.4 | − | 0.8 | − | ||||||||||||
| Gipuzkoa | 39.0 | 3 | 14.6 | 1 | 4.8 | − | 23.8 | 2 | 0.9 | − | ||||||||||
| Girona | 39.5 | 3 | 12.2 | − | 3.2 | − | 27.2 | 2 | 0.1 | − | 13.2 | 1 | ||||||||
| Granada | 50.0 | 4 | 41.1 | 3 | 5.0 | − | 1.0 | − | ||||||||||||
| Guadalajara | 41.0 | 1 | 50.7 | 2 | 3.3 | − | 2.1 | − | ||||||||||||
| Huelva | 55.7 | 3 | 35.0 | 2 | 4.9 | − | 0.9 | − | ||||||||||||
| Huesca | 47.6 | 2 | 37.6 | 1 | 2.9 | − | 1.3 | − | ||||||||||||
| Jaén | 55.5 | 4 | 36.5 | 2 | 4.8 | − | 0.5 | − | ||||||||||||
| La Rioja | 43.6 | 2 | 49.5 | 2 | 1.9 | − | 1.3 | − | ||||||||||||
| Las Palmas | 42.6 | 4 | 39.7 | 4 | 1.1 | − | 0.4 | − | 6.1 | − | ||||||||||
| León | 50.1 | 3 | 43.3 | 2 | 2.1 | − | 0.8 | − | ||||||||||||
| Lleida | 37.2 | 2 | 15.0 | 1 | 2.6 | − | 28.6 | 1 | 0.1 | − | 12.9 | − | ||||||||
| Lugo | 41.4 | 2 | 44.5 | 2 | 1.0 | − | 0.5 | − | 10.8 | − | ||||||||||
| Madrid | 39.7 | 15 | 49.2 | 18 | 4.7 | 1 | 3.7 | 1 | ||||||||||||
| Málaga | 47.0 | 5 | 43.0 | 5 | 5.1 | − | 1.0 | − | ||||||||||||
| Melilla | 48.1 | − | 49.0 | 1 | 1.1 | − | ||||||||||||||
| Murcia | 32.9 | 3 | 61.2 | 7 | 2.9 | − | 0.9 | − | ||||||||||||
| Navarre | 34.8 | 2 | 39.2 | 2 | 3.3 | − | 0.8 | − | 18.4 | 1 | ||||||||||
| Ourense | 39.0 | 2 | 47.3 | 2 | 0.7 | − | 0.5 | − | 10.8 | − | ||||||||||
| Palencia | 43.6 | 1 | 49.7 | 2 | 2.6 | − | 1.3 | − | ||||||||||||
| Pontevedra | 40.5 | 3 | 43.7 | 3 | 1.6 | − | 0.5 | − | 11.5 | 1 | ||||||||||
| Salamanca | 40.0 | 2 | 53.8 | 2 | 1.7 | − | 1.7 | − | ||||||||||||
| Santa Cruz | 36.5 | 3 | 30.2 | 2 | 1.4 | − | 0.4 | − | 29.2 | 2 | ||||||||||
| Segovia | 39.0 | 1 | 53.4 | 2 | 2.7 | − | 1.6 | − | ||||||||||||
| Seville | 58.1 | 8 | 31.5 | 4 | 5.4 | − | 1.2 | − | ||||||||||||
| Soria | 42.6 | 1 | 49.8 | 1 | 2.2 | − | 2.0 | − | ||||||||||||
| Tarragona | 44.9 | 4 | 17.8 | 1 | 3.0 | − | 21.1 | 1 | 0.1 | − | 9.4 | − | ||||||||
| Teruel | 44.5 | 2 | 39.6 | 1 | 2.6 | − | 0.4 | − | ||||||||||||
| Toledo | 43.0 | 3 | 51.2 | 3 | 3.0 | − | 1.0 | − | ||||||||||||
| Valencia | 40.2 | 7 | 51.6 | 9 | 3.1 | − | 0.7 | − | 0.2 | − | ||||||||||
| Valladolid | 42.6 | 2 | 49.3 | 3 | 3.2 | − | 2.0 | − | ||||||||||||
| Zamora | 42.8 | 1 | 51.4 | 2 | 2.3 | − | 0.9 | − | ||||||||||||
| Zaragoza | 46.4 | 4 | 36.5 | 3 | 2.9 | − | 1.2 | − | ||||||||||||
| Total | 43.9 | 169 | 39.9 | 154 | 3.8 | 2 | 3.0 | 10 | 1.2 | 6 | 1.2 | 1 | 1.2 | 3 | 0.8 | 2 | 0.7 | 2 | 0.2 | 1 |
Autonomous communities
Andalusia
.png)
| Party | Popular vote | Seats | ||||
|---|---|---|---|---|---|---|
| Votes | % | ±pp | Won | +/− | ||
| Spanish Socialist Workers' Party (PSOE) | 2,342,277 | 51.93 | –0.93 | 36 | –2 | |
| People's Party (PP) | 1,721,824 | 38.18 | +4.49 | 25 | +2 | |
| United Left/The Greens–Assembly for Andalusia–Alternative (IULV–CA) | 230,335 | 5.11 | –1.28 | 0 | ±0 | |
| Andalusian Coalition (CA)[lower-alpha 1] | 68,679 | 1.52 | –3.06 | 0 | ±0 | |
| Parties with less than 1.0% of the vote | 101,948 | 2.26 | — | 0 | ±0 | |
|---|---|---|---|---|---|---|
| Union, Progress and Democracy (UPyD) | 40,568 | 0.90 | New | 0 | ±0 | |
| The Greens (LV) | 14,294 | 0.32 | New | 0 | ±0 | |
| Party of Almeria (PdeAL) | 8,451 | 0.19 | New | 0 | ±0 | |
| Anti-Bullfighting Party Against Mistreatment of Animals (PACMA) | 6,910 | 0.15 | New | 0 | ±0 | |
| Social Democratic Party (PSD) | 4,308 | 0.10 | New | 0 | ±0 | |
| For a Fairer World (PUM+J) | 4,081 | 0.09 | New | 0 | ±0 | |
| Citizens–Party of the Citizenry (C's) | 3,849 | 0.09 | New | 0 | ±0 | |
| Communist Party of the Peoples of Spain (PCPE) | 3,551 | 0.08 | +0.07 | 0 | ±0 | |
| Spanish Falange of the JONS (FE–JONS) | 1,949 | 0.04 | –0.01 | 0 | ±0 | |
| Family and Life Party (PFyV) | 1,836 | 0.04 | –0.02 | 0 | ±0 | |
| Humanist Party (PH) | 1,799 | 0.04 | –0.05 | 0 | ±0 | |
| National Democracy (DN) | 1,784 | 0.04 | ±0.00 | 0 | ±0 | |
| Spanish Alternative (AES) | 1,515 | 0.03 | New | 0 | ±0 | |
| Internationalist Solidarity and Self-Management (SAIn) | 1,386 | 0.03 | New | 0 | ±0 | |
| Navarrese Cannabis Representation (RCN/NOK) | 1,155 | 0.03 | New | 0 | ±0 | |
| Internationalist Socialist Workers' Party (POSI) | 1,058 | 0.02 | New | 0 | ±0 | |
| Authentic Falange (FA) | 777 | 0.02 | +0.01 | 0 | ±0 | |
| Spain 2000 (E–2000) | 680 | 0.02 | +0.01 | 0 | ±0 | |
| Citizens for Blank Votes (CenB) | 520 | 0.01 | –0.14 | 0 | ±0 | |
| National Alliance (AN) | 466 | 0.01 | New | 0 | ±0 | |
| Engine and Sports Alternative (AMD) | 356 | 0.01 | New | 0 | ±0 | |
| Christian Positivist Party (PPCr) | 300 | 0.01 | –0.01 | 0 | ±0 | |
| Spanish Front (Frente) | 241 | 0.01 | New | 0 | ±0 | |
| Democratic and Social Centre (CDS) | 114 | 0.00 | –0.07 | 0 | ±0 | |
| Blank ballots | 45,124 | 1.00 | –0.65 | |||
| Total | 4,510,187 | 100.00 | 61 | ±0 | ||
| Valid votes | 4,510,187 | 99.42 | +0.03 | |||
| Invalid votes | 26,212 | 0.58 | –0.03 | |||
| Votes cast / turnout | 4,536,399 | 72.77 | –2.00 | |||
| Abstentions | 1,697,889 | 27.23 | +2.00 | |||
| Registered voters | 6,234,288 | |||||
| Source: Ministry of the Interior | ||||||
| ||||||
Aragon
.png)
| Party | Popular vote | Seats | ||||
|---|---|---|---|---|---|---|
| Votes | % | ±pp | Won | +/− | ||
| Spanish Socialist Workers' Party (PSOE) | 356,050 | 46.39 | +5.11 | 8 | +1 | |
| People's Party (PP) | 284,068 | 37.01 | +0.53 | 5 | ±0 | |
| Aragonese Party (PAR) | 40,054 | 5.22 | +0.54 | 0 | ±0 | |
| Aragonese Union (CHA) | 38,202 | 4.98 | –7.09 | 0 | –1 | |
| United Left (IU) | 21,816 | 2.84 | +0.04 | 0 | ±0 | |
| Union, Progress and Democracy (UPyD) | 8,728 | 1.14 | New | 0 | ±0 | |
| Parties with less than 1.0% of the vote | 8,942 | 1.17 | — | 0 | ±0 | |
|---|---|---|---|---|---|---|
| The Greens–Green Group (LV–GV) | 2,489 | 0.32 | New | 0 | ±0 | |
| Anti-Bullfighting Party Against Mistreatment of Animals (PACMA) | 1,230 | 0.16 | New | 0 | ±0 | |
| Citizens–Party of the Citizenry (C's) | 997 | 0.13 | New | 0 | ±0 | |
| Citizens for Blank Votes (CenB) | 545 | 0.07 | –0.06 | 0 | ±0 | |
| For a Fairer World (PUM+J) | 497 | 0.06 | New | 0 | ±0 | |
| Aragon United Citizens Party (pCUA) | 475 | 0.06 | New | 0 | ±0 | |
| National Democracy (DN) | 433 | 0.06 | –0.01 | 0 | ±0 | |
| Social Democratic Party (PSD) | 395 | 0.05 | New | 0 | ±0 | |
| Spanish Falange of the JONS (FE–JONS) | 352 | 0.05 | +0.01 | 0 | ±0 | |
| Family and Life Party (PFyV) | 330 | 0.04 | –0.05 | 0 | ±0 | |
| Communist Party of the Peoples of Spain (PCPE) | 314 | 0.04 | +0.02 | 0 | ±0 | |
| National Alliance (AN) | 244 | 0.03 | New | 0 | ±0 | |
| Authentic Falange (FA) | 190 | 0.02 | ±0.00 | 0 | ±0 | |
| Humanist Party (PH) | 121 | 0.02 | –0.03 | 0 | ±0 | |
| Spanish Alternative (AES) | 118 | 0.02 | New | 0 | ±0 | |
| Spanish Front (Frente) | 113 | 0.01 | New | 0 | ±0 | |
| Spain 2000 (E–2000) | 89 | 0.01 | New | 0 | ±0 | |
| Centrist Party (PCTR) | 10 | 0.00 | New | 0 | ±0 | |
| Blank ballots | 9,620 | 1.25 | –0.76 | |||
| Total | 767,480 | 100.00 | 13 | ±0 | ||
| Valid votes | 767,480 | 99.46 | +0.06 | |||
| Invalid votes | 4,153 | 0.54 | –0.06 | |||
| Votes cast / turnout | 771,633 | 75.92 | –1.12 | |||
| Abstentions | 244,787 | 24.08 | +1.12 | |||
| Registered voters | 1,016,420 | |||||
| Source: Ministry of the Interior | ||||||
Asturias
.png)
| Party | Popular vote | Seats | ||||
|---|---|---|---|---|---|---|
| Votes | % | ±pp | Won | +/− | ||
| Spanish Socialist Workers' Party (PSOE) | 326,477 | 46.93 | +3.55 | 4 | ±0 | |
| People's Party (PP) | 289,305 | 41.58 | –2.19 | 4 | ±0 | |
| United Left–Bloc for Asturias–The Greens (IU–BA–LV) | 49,936 | 7.18 | –1.24 | 0 | ±0 | |
| Union, Progress and Democracy (UPyD) | 9,485 | 1.36 | New | 0 | ±0 | |
| Parties with less than 1.0% of the vote | 11,902 | 1.71 | — | 0 | ±0 | |
|---|---|---|---|---|---|---|
| The Greens–Green Group (LV–GV) | 1,906 | 0.27 | New | 0 | ±0 | |
| Andecha Astur (AA) | 1,299 | 0.19 | –0.09 | 0 | ±0 | |
| Anti-Bullfighting Party Against Mistreatment of Animals (PACMA) | 1,193 | 0.17 | New | 0 | ±0 | |
| Communist Party of the Peoples of Spain (PCPE) | 946 | 0.14 | +0.03 | 0 | ±0 | |
| Unity (Unidá) | 848 | 0.12 | New | 0 | ±0 | |
| Social Democratic Party (PSD) | 778 | 0.11 | New | 0 | ±0 | |
| Citizens for Blank Votes (CenB) | 617 | 0.09 | –0.10 | 0 | ±0 | |
| Citizens–Party of the Citizenry (C's) | 575 | 0.08 | New | 0 | ±0 | |
| National Democracy (DN) | 549 | 0.08 | +0.04 | 0 | ±0 | |
| Republican Left (IR) | 529 | 0.08 | +0.03 | 0 | ±0 | |
| For a Fairer World (PUM+J) | 446 | 0.06 | New | 0 | ±0 | |
| Engine and Sports Alternative (AMD) | 369 | 0.05 | New | 0 | ±0 | |
| Internationalist Socialist Workers' Party (POSI) | 262 | 0.04 | New | 0 | ±0 | |
| Internationalist Solidarity and Self-Management (SAIn) | 250 | 0.04 | New | 0 | ±0 | |
| Spanish Falange of the JONS (FE–JONS) | 237 | 0.03 | –0.01 | 0 | ±0 | |
| Asturian Democratic Convergence (CDAS) | 216 | 0.03 | –0.05 | 0 | ±0 | |
| Family and Life Party (PFyV) | 159 | 0.02 | New | 0 | ±0 | |
| Humanist Party (PH) | 151 | 0.02 | –0.04 | 0 | ±0 | |
| State of Spain Unionist Party (PUEDE) | 117 | 0.02 | New | 0 | ±0 | |
| Spanish Alternative (AES) | 98 | 0.01 | New | 0 | ±0 | |
| Authentic Falange (FA) | 90 | 0.01 | –0.02 | 0 | ±0 | |
| Spanish Front (Frente) | 75 | 0.01 | New | 0 | ±0 | |
| Falangist Movement of Spain (MFE) | 68 | 0.01 | New | 0 | ±0 | |
| National Alliance (AN) | 67 | 0.01 | New | 0 | ±0 | |
| Carlist Party (PC) | 57 | 0.01 | New | 0 | ±0 | |
| Blank ballots | 8,630 | 1.24 | –0.81 | |||
| Total | 695,735 | 100.00 | 8 | ±0 | ||
| Valid votes | 695,735 | 99.35 | –0.10 | |||
| Invalid votes | 4,533 | 0.65 | +0.10 | |||
| Votes cast / turnout | 700,268 | 71.29 | –0.44 | |||
| Abstentions | 281,962 | 28.71 | +0.44 | |||
| Registered voters | 982,230 | |||||
| Source: Ministry of the Interior | ||||||
Balearic Islands
.png)
| Party | Popular vote | Seats | ||||
|---|---|---|---|---|---|---|
| Votes | % | ±pp | Won | +/− | ||
| Spanish Socialist Workers' Party (PSOE) | 209,451 | 44.23 | +4.75 | 4 | ±0 | |
| People's Party (PP) | 208,246 | 43.97 | –1.92 | 4 | ±0 | |
| Unity for the Islands (UIB) | 25,454 | 5.37 | –3.20 | 0 | ±0 | |
| United Left–The Greens (EU–EV) | 13,447 | 2.84 | New | 0 | ±0 | |
| Parties with less than 1.0% of the vote | 10,959 | 2.31 | — | 0 | − | |
|---|---|---|---|---|---|---|
| Union, Progress and Democracy (UPyD) | 3,107 | 0.66 | New | 0 | ±0 | |
| The Greens–Green Group (LV–GV) | 2,098 | 0.44 | New | 0 | ±0 | |
| Anti-Bullfighting Party Against Mistreatment of Animals (PACMA) | 1,173 | 0.25 | New | 0 | ±0 | |
| Citizens for Blank Votes (CenB) | 1,010 | 0.21 | –0.13 | 0 | ±0 | |
| Citizens–Party of the Citizenry (C's) | 723 | 0.15 | New | 0 | ±0 | |
| For a Fairer World (PUM+J) | 425 | 0.09 | New | 0 | ±0 | |
| Communist Party of the Peoples of Spain (PCPE) | 415 | 0.09 | New | 0 | ±0 | |
| Islander Party of the Balearic Islands (PIIB) | 360 | 0.08 | New | 0 | ±0 | |
| Spanish Falange of the JONS (FE–JONS) | 334 | 0.07 | ±0.00 | 0 | ±0 | |
| Family and Life Party (PFyV) | 284 | 0.06 | New | 0 | ±0 | |
| National Democracy (DN) | 250 | 0.05 | ±0.00 | 0 | ±0 | |
| Humanist Party (PH) | 206 | 0.04 | New | 0 | ±0 | |
| Workers for Democracy Coalition (TD) | 159 | 0.03 | –0.06 | 0 | ±0 | |
| Authentic Falange (FA) | 158 | 0.03 | New | 0 | ±0 | |
| Balearic Alliance (ABA) | 145 | 0.03 | New | 0 | ±0 | |
| Spanish Alternative (AES) | 112 | 0.02 | New | 0 | ±0 | |
| Blank ballots | 6,026 | 1.27 | –0.66 | |||
| Total | 473,583 | 100.00 | 8 | ±0 | ||
| Valid votes | 473,583 | 99.15 | –0.14 | |||
| Invalid votes | 4,079 | 0.85 | +0.14 | |||
| Votes cast / turnout | 477,662 | 67.57 | –1.27 | |||
| Abstentions | 229,276 | 32.43 | +1.27 | |||
| Registered voters | 706,938 | |||||
| Source: Ministry of the Interior | ||||||
Basque Country
.png)
| Party | Popular vote | Seats | ||||
|---|---|---|---|---|---|---|
| Votes | % | ±pp | Won | +/− | ||
| Socialist Party of the Basque Country–Basque Country Left (PSE–EE (PSOE)) | 430,690 | 38.14 | +10.92 | 9 | +2 | |
| Basque Nationalist Party (EAJ/PNV) | 306,128 | 27.11 | –6.61 | 6 | –1 | |
| People's Party (PP) | 209,244 | 18.53 | –0.36 | 3 | –1 | |
| United Left–Greens–Alternative (EB–B) | 50,403 | 4.46 | –3.74 | 0 | ±0 | |
| Basque Solidarity (EA) | 50,371 | 4.46 | –2.02 | 0 | –1 | |
| Aralar (Aralar) | 29,989 | 2.66 | –0.43 | 0 | ±0 | |
| Parties with less than 1.0% of the vote | 31,814 | 2.82 | — | 0 | ±0 | |
|---|---|---|---|---|---|---|
| Union, Progress and Democracy (UPyD) | 10,636 | 0.94 | New | 0 | ±0 | |
| The Greens (B–LV) | 6,434 | 0.57 | New | 0 | ±0 | |
| Anti-Bullfighting Party Against Mistreatment of Animals (PACMA) | 4,237 | 0.38 | New | 0 | ±0 | |
| For a Fairer World (PUM+J) | 2,770 | 0.25 | New | 0 | ±0 | |
| Internationalist Socialist Workers' Party (POSI) | 1,325 | 0.12 | –0.01 | 0 | ±0 | |
| Engine and Sports Alternative (AMD) | 1,207 | 0.11 | New | 0 | ±0 | |
| Communist Party of the Peoples of Spain–Basque Communists (PCPE–EK) | 1,053 | 0.09 | New | 0 | ±0 | |
| Family and Life Party (PFyV) | 1,011 | 0.09 | New | 0 | ±0 | |
| Humanist Party (PH) | 797 | 0.07 | –0.25 | 0 | ±0 | |
| Citizens–Party of the Citizenry (C's) | 772 | 0.07 | New | 0 | ±0 | |
| Carlist Party of the Basque Country–Carlist Party (EKA–PC) | 464 | 0.04 | ±0.00 | 0 | ±0 | |
| National Democracy (DN) | 385 | 0.03 | –0.03 | 0 | ±0 | |
| Spanish Falange of the JONS (FE–JONS) | 361 | 0.03 | ±0.00 | 0 | ±0 | |
| Spanish Alternative (AES) | 205 | 0.02 | New | 0 | ±0 | |
| National Alliance (AN) | 113 | 0.01 | New | 0 | ±0 | |
| Liberal Centrist Union (UCL) | 44 | 0.00 | New | 0 | ±0 | |
| Blank ballots | 20,682 | 1.83 | +0.48 | |||
| Total | 1,129,321 | 100.00 | 18 | –1 | ||
| Valid votes | 1,129,321 | 99.02 | +6.71 | |||
| Invalid votes | 11,190 | 0.98 | –6.71 | |||
| Votes cast / turnout | 1,140,511 | 64.03 | –10.94 | |||
| Abstentions | 640,629 | 35.97 | +10.94 | |||
| Registered voters | 1,781,140 | |||||
| Source: Ministry of the Interior | ||||||
Canary Islands
.png)
| Party | Popular vote | Seats | ||||
|---|---|---|---|---|---|---|
| Votes | % | ±pp | Won | +/− | ||
| Spanish Socialist Workers' Party (PSOE) | 395,182 | 39.57 | +5.12 | 7 | +1 | |
| People's Party (PP) | 349,568 | 35.00 | –0.44 | 6 | ±0 | |
| Canarian Coalition–Canarian Nationalist Party (CC–PNC)[lower-alpha 1] | 174,629 | 17.49 | –7.26 | 2 | –1 | |
| New Canaries–Canarian Centre (NC–CCN) | 38,024 | 3.81 | New | 0 | ±0 | |
| Canarian United Left–Alternative (IUC) | 12,472 | 1.25 | –0.68 | 0 | ±0 | |
| Parties with less than 1.0% of the vote | 21,476 | 2.15 | — | 0 | ±0 | |
|---|---|---|---|---|---|---|
| The Greens (LV) | 4,957 | 0.50 | New | 0 | ±0 | |
| Union, Progress and Democracy (UPyD) | 3,577 | 0.36 | New | 0 | ±0 | |
| The Greens–Green Group (LV–GV) | 2,718 | 0.27 | –0.87 | 0 | ±0 | |
| Communist Party of the Canarian People (PCPC) | 1,358 | 0.14 | –0.02 | 0 | ±0 | |
| Canarian Nationalist Alternative (ANC) | 1,017 | 0.10 | New | 0 | ±0 | |
| Social Democratic Party (PSD) | 857 | 0.09 | New | 0 | ±0 | |
| For a Fairer World (PUM+J) | 853 | 0.09 | New | 0 | ±0 | |
| Unity of the People (UP) | 699 | 0.07 | New | 0 | ±0 | |
| Citizens for Blank Votes (CenB) | 675 | 0.07 | New | 0 | ±0 | |
| Humanist Party (PH) | 634 | 0.06 | –0.03 | 0 | ±0 | |
| Anti-Bullfighting Party Against Mistreatment of Animals (PACMA) | 631 | 0.06 | New | 0 | ±0 | |
| Movement for the Unity of the Canarian People (MUPC) | 497 | 0.05 | New | 0 | ±0 | |
| Independent Progressives of Canaries Citizen Union (UCPIC) | 464 | 0.05 | New | 0 | ±0 | |
| National Democracy (DN) | 418 | 0.04 | –0.01 | 0 | ±0 | |
| Citizens–Party of the Citizenry (C's) | 353 | 0.04 | New | 0 | ±0 | |
| Family and Life Party (PFyV) | 350 | 0.04 | New | 0 | ±0 | |
| Spanish Alternative (AES) | 348 | 0.03 | New | 0 | ±0 | |
| Spanish Falange of the JONS (FE–JONS) | 299 | 0.03 | –0.02 | 0 | ±0 | |
| Authentic Falange (FA) | 243 | 0.02 | –0.03 | 0 | ±0 | |
| Internationalist Solidarity and Self-Management (SAIn) | 235 | 0.02 | New | 0 | ±0 | |
| Liberal Democratic Centre (CDL) | 208 | 0.02 | New | 0 | ±0 | |
| Spanish Front (Frente) | 85 | 0.01 | New | 0 | ±0 | |
| Blank ballots | 7,336 | 0.73 | –0.34 | |||
| Total | 998,687 | 100.00 | 15 | ±0 | ||
| Valid votes | 998,687 | 99.34 | –0.08 | |||
| Invalid votes | 6,608 | 0.66 | +0.08 | |||
| Votes cast / turnout | 1,005,295 | 65.87 | –0.83 | |||
| Abstentions | 520,883 | 34.13 | +0.83 | |||
| Registered voters | 1,526,178 | |||||
| Source: Ministry of the Interior | ||||||
| ||||||
Cantabria
.png)
| Party | Popular vote | Seats | ||||
|---|---|---|---|---|---|---|
| Votes | % | ±pp | Won | +/− | ||
| People's Party (PP) | 184,853 | 49.99 | –1.91 | 3 | ±0 | |
| Spanish Socialist Workers' Party (PSOE) | 161,279 | 43.61 | +2.74 | 2 | ±0 | |
| United Left (IU) | 8,395 | 2.27 | –1.04 | 0 | ±0 | |
| Union, Progress and Democracy (UPyD) | 5,094 | 1.38 | New | 0 | ±0 | |
| Parties with less than 1.0% of the vote | 5,634 | 1.52 | — | 0 | ±0 | |
|---|---|---|---|---|---|---|
| The Greens of Europe (LVE) | 1,060 | 0.29 | New | 0 | ±0 | |
| Anti-Bullfighting Party Against Mistreatment of Animals (PACMA) | 713 | 0.19 | New | 0 | ±0 | |
| Communist Party of the Peoples of Spain (PCPE) | 497 | 0.13 | +0.01 | 0 | ±0 | |
| Social Democratic Party (PSD) | 444 | 0.12 | New | 0 | ±0 | |
| Engine and Sports Alternative (AMD) | 394 | 0.11 | New | 0 | ±0 | |
| For a Fairer World (PUM+J) | 353 | 0.10 | New | 0 | ±0 | |
| Alternative in Blank (ABLA) | 305 | 0.08 | New | 0 | ±0 | |
| Spanish Falange of the JONS (FE–JONS) | 302 | 0.08 | +0.02 | 0 | ±0 | |
| Citizens for Blank Votes (CenB) | 297 | 0.08 | –0.28 | 0 | ±0 | |
| Citizens–Party of the Citizenry (C's) | 286 | 0.08 | New | 0 | ±0 | |
| Internationalist Solidarity and Self-Management (SAIn) | 219 | 0.06 | New | 0 | ±0 | |
| Humanist Party (PH) | 175 | 0.05 | –0.14 | 0 | ±0 | |
| Family and Life Party (PFyV) | 166 | 0.04 | New | 0 | ±0 | |
| Spanish Alternative (AES) | 157 | 0.04 | New | 0 | ±0 | |
| National Democracy (DN) | 154 | 0.04 | –0.02 | 0 | ±0 | |
| Authentic Falange (FA) | 112 | 0.03 | –0.01 | 0 | ±0 | |
| Blank ballots | 4,551 | 1.23 | –1.02 | |||
| Total | 369,806 | 100.00 | 5 | ±0 | ||
| Valid votes | 369,806 | 99.21 | +0.09 | |||
| Invalid votes | 2,926 | 0.79 | –0.09 | |||
| Votes cast / turnout | 372,732 | 76.38 | –0.85 | |||
| Abstentions | 115,277 | 23.62 | +0.85 | |||
| Registered voters | 488,009 | |||||
| Source: Ministry of the Interior | ||||||
Castile-La Mancha
| Party | Popular vote | Seats | ||||
|---|---|---|---|---|---|---|
| Votes | % | ±pp | Won | +/− | ||
| People's Party (PP) | 597,088 | 49.36 | +1.96 | 12 | +1 | |
| Spanish Socialist Workers' Party (PSOE) | 538,402 | 44.51 | –1.99 | 9 | ±0 | |
| United Left (IU) | 35,425 | 2.93 | –0.44 | 0 | ±0 | |
| Union, Progress and Democracy (UPyD) | 13,230 | 1.09 | New | 0 | ±0 | |
| Parties with less than 1.0% of the vote | 13,733 | 1.14 | — | 0 | ±0 | |
|---|---|---|---|---|---|---|
| The Greens of Europe (LVE) | 2,423 | 0.20 | New | 0 | ±0 | |
| Social Democratic Party (PSD) | 1,303 | 0.11 | New | 0 | ±0 | |
| Anti-Bullfighting Party Against Mistreatment of Animals (PACMA) | 1,104 | 0.09 | New | 0 | ±0 | |
| Citizens for Blank Votes (CenB) | 1,064 | 0.09 | –0.11 | 0 | ±0 | |
| For a Fairer World (PUM+J) | 1,028 | 0.08 | New | 0 | ±0 | |
| The Greens–Green Group (LV–GV) | 1,004 | 0.08 | New | 0 | ±0 | |
| Spanish Falange of the JONS (FE–JONS) | 698 | 0.06 | +0.02 | 0 | ±0 | |
| Communist Party of the Peoples of Spain (PCPE) | 679 | 0.06 | –0.01 | 0 | ±0 | |
| Citizens–Party of the Citizenry (C's) | 671 | 0.06 | New | 0 | ±0 | |
| Commoners' Land (TC) | 648 | 0.05 | –0.04 | 0 | ±0 | |
| National Democracy (DN) | 534 | 0.04 | –0.02 | 0 | ±0 | |
| Humanist Party (PH) | 521 | 0.04 | –0.03 | 0 | ±0 | |
| Family and Life Party (PFyV) | 414 | 0.03 | New | 0 | ±0 | |
| Spanish Alternative (AES) | 356 | 0.03 | New | 0 | ±0 | |
| Spain 2000 (E–2000) | 262 | 0.02 | New | 0 | ±0 | |
| Authentic Falange (FA) | 220 | 0.02 | –0.01 | 0 | ±0 | |
| Castilian Unity (UdCa) | 198 | 0.02 | –0.03 | 0 | ±0 | |
| Spanish Democratic Centre (CDEs) | 167 | 0.01 | New | 0 | ±0 | |
| Regionalist Party of Guadalajara (PRGU) | 152 | 0.01 | –0.02 | 0 | ±0 | |
| Independents for Cuenca (ixC) | 100 | 0.01 | New | 0 | ±0 | |
| National Alliance (AN) | 79 | 0.01 | New | 0 | ±0 | |
| Centrist Party (PCTR) | 41 | 0.00 | New | 0 | ±0 | |
| Spanish Front (Frente) | 39 | 0.00 | New | 0 | ±0 | |
| Carlist Traditionalist Communion (CTC) | 28 | 0.00 | New | 0 | ±0 | |
| Blank ballots | 11,673 | 0.97 | –0.65 | |||
| Total | 1,209,551 | 100.00 | 21 | +1 | ||
| Valid votes | 1,209,551 | 99.26 | +0.12 | |||
| Invalid votes | 9,003 | 0.74 | –0.12 | |||
| Votes cast / turnout | 1,218,554 | 80.02 | +0.12 | |||
| Abstentions | 304,278 | 19.98 | –0.12 | |||
| Registered voters | 1,522,832 | |||||
| Source: Ministry of the Interior | ||||||
Castile and León
| Party | Popular vote | Seats | ||||
|---|---|---|---|---|---|---|
| Votes | % | ±pp | Won | +/− | ||
| People's Party (PP) | 836,228 | 50.01 | –0.30 | 18 | –1 | |
| Spanish Socialist Workers' Party (PSOE) | 715,263 | 42.78 | +0.88 | 14 | ±0 | |
| United Left (IU) | 41,964 | 2.51 | –0.31 | 0 | ±0 | |
| Union, Progress and Democracy (UPyD) | 25,504 | 1.53 | New | 0 | ±0 | |
| Parties with less than 1.0% of the vote | 33,107 | 1.98 | — | 0 | ±0 | |
|---|---|---|---|---|---|---|
| Leonese People's Union (UPL) | 4,509 | 0.27 | –0.57 | 0 | ±0 | |
| Commoners' Land (TC) | 3,537 | 0.21 | –0.20 | 0 | ±0 | |
| The Greens of Europe (LVE) | 3,209 | 0.19 | New | 0 | ±0 | |
| Anti-Bullfighting Party Against Mistreatment of Animals (PACMA) | 2,440 | 0.15 | New | 0 | ±0 | |
| The Greens (LV) | 2,022 | 0.12 | New | 0 | ±0 | |
| Citizens–Party of the Citizenry (C's) | 2,010 | 0.12 | New | 0 | ±0 | |
| Social Democratic Party (PSD) | 1,770 | 0.11 | New | 0 | ±0 | |
| For a Fairer World (PUM+J) | 1,548 | 0.09 | New | 0 | ±0 | |
| The Greens–Green Group (LV–GV) | 1,368 | 0.08 | –0.01 | 0 | ±0 | |
| National Democracy (DN) | 1,314 | 0.08 | +0.04 | 0 | ±0 | |
| Communist Party of the Peoples of Spain (PCPE) | 1,293 | 0.08 | +0.03 | 0 | ±0 | |
| Spanish Falange of the JONS (FE–JONS) | 1,151 | 0.07 | +0.02 | 0 | ±0 | |
| Citizens for Blank Votes (CenB) | 1,104 | 0.07 | –0.15 | 0 | ±0 | |
| Regionalist Party of the Leonese Country (PREPAL) | 1,028 | 0.06 | –0.02 | 0 | ±0 | |
| Humanist Party (PH) | 589 | 0.04 | –0.04 | 0 | ±0 | |
| Regionalist Unity of Castile and León (URCL) | 423 | 0.03 | New | 0 | ±0 | |
| Internationalist Solidarity and Self-Management (SAIn) | 421 | 0.03 | New | 0 | ±0 | |
| Spanish Alternative (AES) | 421 | 0.03 | New | 0 | ±0 | |
| El Bierzo People (PB–UB) | 385 | 0.02 | New | 0 | ±0 | |
| Authentic Falange (FA) | 373 | 0.02 | –0.01 | 0 | ±0 | |
| Carlist Party (PC) | 313 | 0.02 | +0.01 | 0 | ±0 | |
| Engine and Sports Alternative (AMD) | 238 | 0.01 | New | 0 | ±0 | |
| Merindades of Castile Initiative (IMC) | 202 | 0.01 | New | 0 | ±0 | |
| Family and Life Party (PFyV) | 200 | 0.01 | New | 0 | ±0 | |
| Spain 2000 (E–2000) | 176 | 0.01 | ±0.00 | 0 | ±0 | |
| National Alliance (AN) | 157 | 0.01 | New | 0 | ±0 | |
| Centrist Party (PCTR) | 134 | 0.01 | New | 0 | ±0 | |
| Spanish Front (Frente) | 131 | 0.01 | New | 0 | ±0 | |
| Alliance for Burgos (AxB) | 123 | 0.01 | New | 0 | ±0 | |
| Burgalese Citizen Initiative (ICBur) | 109 | 0.01 | New | 0 | ±0 | |
| Alternative in Blank (ABLA) | 97 | 0.01 | New | 0 | ±0 | |
| State of Spain Unionist Party (PUEDE) | 83 | 0.00 | New | 0 | ±0 | |
| Liberal Centrist Union (UCL) | 80 | 0.00 | –0.01 | 0 | ±0 | |
| Citizen Group (AGRUCI) | 79 | 0.00 | New | 0 | ±0 | |
| Spanish Democratic Centre (CDEs) | 52 | 0.00 | New | 0 | ±0 | |
| Carlist Traditionalist Communion (CTC) | 18 | 0.00 | New | 0 | ±0 | |
| Blank ballots | 20,023 | 1.20 | –0.80 | |||
| Total | 1,672,089 | 100.00 | 32 | –1 | ||
| Valid votes | 1,672,089 | 99.27 | +0.04 | |||
| Invalid votes | 12,218 | 0.73 | –0.04 | |||
| Votes cast / turnout | 1,684,307 | 77.66 | –0.15 | |||
| Abstentions | 484,648 | 22.34 | +0.15 | |||
| Registered voters | 2,168,955 | |||||
| Source: Ministry of the Interior | ||||||
Catalonia
| Party | Popular vote | Seats | ||||
|---|---|---|---|---|---|---|
| Votes | % | ±pp | Won | +/− | ||
| Socialists' Party of Catalonia (PSC–PSOE) | 1,689,911 | 45.39 | +5.92 | 25 | +4 | |
| Convergence and Union (CiU) | 779,425 | 20.93 | +0.15 | 10 | ±0 | |
| People's Party (PP) | 610,473 | 16.40 | +0.82 | 8 | +2 | |
| Republican Left of Catalonia (esquerra) | 291,532 | 7.83 | –8.06 | 3 | –5 | |
| Initiative for Catalonia Greens–United and Alternative Left (ICV–EUiA) | 183,338 | 4.92 | –0.92 | 1 | –1 | |
| Parties with less than 1.0% of the vote | 111,468 | 2.99 | — | 0 | ±0 | |
|---|---|---|---|---|---|---|
| Citizens–Party of the Citizenry (C's) | 27,512 | 0.74 | New | 0 | ±0 | |
| The Greens–The Ecologist Alternative (EV–AE) | 12,561 | 0.34 | –0.42 | 0 | ±0 | |
| Anti-Bullfighting Party Against Mistreatment of Animals (PACMA) | 10,686 | 0.29 | New | 0 | ±0 | |
| The Greens (EV–LV) | 7,324 | 0.20 | New | 0 | ±0 | |
| Catalan Republican Party (RC) | 6,746 | 0.18 | New | 0 | ±0 | |
| Union, Progress and Democracy (UPyD) | 6,252 | 0.17 | New | 0 | ±0 | |
| Unsubmissive Seats (Ei) | 5,035 | 0.14 | +0.08 | 0 | ±0 | |
| Communist Party of the Catalan People (PCPC) | 4,225 | 0.11 | +0.05 | 0 | ±0 | |
| Citizens for Blank Votes (CenB) | 3,512 | 0.09 | ±0.00 | 0 | ±0 | |
| Pensioners in Action Party (PDLPEA) | 3,050 | 0.08 | New | 0 | ±0 | |
| Internationalist Socialist Workers' Party (POSI) | 2,830 | 0.08 | New | 0 | ±0 | |
| Republican Left–Left Republican Party (IR–PRE) | 2,370 | 0.06 | –0.02 | 0 | ±0 | |
| For a Fairer World (PUM+J) | 2,339 | 0.06 | New | 0 | ±0 | |
| The Greens–Green Alternative (EV–AV) | 2,028 | 0.05 | ±0.00 | 0 | ±0 | |
| Party for Catalonia (PxCat) | 1,919 | 0.05 | New | 0 | ±0 | |
| National Democracy (DN) | 1,788 | 0.05 | +0.02 | 0 | ±0 | |
| Family and Life Party (PFiV) | 1,658 | 0.04 | ±0.00 | 0 | ±0 | |
| Spanish Falange of the JONS (FE–JONS) | 1,593 | 0.04 | ±0.00 | 0 | ±0 | |
| Engine and Sports Alternative (AMD) | 1,265 | 0.03 | New | 0 | ±0 | |
| Social Democratic Party (PSD) | 1,103 | 0.03 | New | 0 | ±0 | |
| Humanist Party (PH) | 944 | 0.03 | –0.01 | 0 | ±0 | |
| Spain 2000 (E–2000) | 728 | 0.02 | +0.02 | 0 | ±0 | |
| Civil Liberties Party (PLCI) | 676 | 0.02 | New | 0 | ±0 | |
| Spanish Alternative (AES) | 657 | 0.02 | New | 0 | ±0 | |
| Authentic Falange (FA) | 647 | 0.02 | New | 0 | ±0 | |
| Internationalist Struggle (LI (LIT–CI)) | 539 | 0.01 | ±0.00 | 0 | ±0 | |
| National Alliance (AN) | 530 | 0.01 | New | 0 | ±0 | |
| Carlist Party of Catalonia (PCdeC) | 496 | 0.01 | +0.01 | 0 | ±0 | |
| Internationalist Solidarity and Self-Management (SAIn) | 293 | 0.01 | New | 0 | ±0 | |
| We Are (N Som) | 105 | 0.00 | New | 0 | ±0 | |
| Spanish Front (Frente) | 57 | 0.00 | –0.01 | 0 | ±0 | |
| Blank ballots | 57,274 | 1.54 | +0.65 | |||
| Total | 3,723,421 | 100.00 | 47 | ±0 | ||
| Valid votes | 3,723,421 | 99.47 | –0.21 | |||
| Invalid votes | 19,939 | 0.53 | +0.21 | |||
| Votes cast / turnout | 3,743,360 | 70.30 | –5.66 | |||
| Abstentions | 1,581,549 | 29.70 | +5.66 | |||
| Registered voters | 5,324,909 | |||||
| Source: Ministry of the Interior | ||||||
Extremadura
.png)
| Party | Popular vote | Seats | ||||
|---|---|---|---|---|---|---|
| Votes | % | ±pp | Won | +/− | ||
| Spanish Socialist Workers' Party (PSOE) | 365,752 | 52.29 | +1.07 | 5 | ±0 | |
| People's Party (PP) | 292,453 | 41.81 | –0.58 | 5 | ±0 | |
| United Left (IU) | 20,606 | 2.95 | –0.52 | 0 | ±0 | |
| Parties with less than 1.0% of the vote | 14,829 | 2.12 | — | 0 | ±0 | |
|---|---|---|---|---|---|---|
| Union, Progress and Democracy (UPyD) | 5,366 | 0.77 | New | 0 | ±0 | |
| United Extremadura (EU) | 2,346 | 0.34 | –0.22 | 0 | ±0 | |
| The Greens (LV) | 2,151 | 0.31 | New | 0 | ±0 | |
| For a Fairer World (PUM+J) | 947 | 0.14 | New | 0 | ±0 | |
| Anti-Bullfighting Party Against Mistreatment of Animals (PACMA) | 844 | 0.12 | New | 0 | ±0 | |
| Communist Party of the Peoples of Spain (PCPE) | 608 | 0.09 | –0.04 | 0 | ±0 | |
| Citizens–Party of the Citizenry (C's) | 459 | 0.07 | New | 0 | ±0 | |
| Social Democratic Party (PSD) | 427 | 0.06 | New | 0 | ±0 | |
| Citizens for Blank Votes (CenB) | 422 | 0.06 | –0.05 | 0 | ±0 | |
| National Democracy (DN) | 281 | 0.04 | ±0.00 | 0 | ±0 | |
| Spanish Falange of the JONS (FE–JONS) | 257 | 0.04 | ±0.00 | 0 | ±0 | |
| Humanist Party (PH) | 182 | 0.03 | –0.01 | 0 | ±0 | |
| Authentic Falange (FA) | 173 | 0.02 | –0.01 | 0 | ±0 | |
| Spanish Alternative (AES) | 119 | 0.02 | New | 0 | ±0 | |
| Spain 2000 (E–2000) | 88 | 0.01 | New | 0 | ±0 | |
| Family and Life Party (PFyV) | 82 | 0.01 | –0.04 | 0 | ±0 | |
| National Alliance (AN) | 51 | 0.01 | New | 0 | ±0 | |
| Carlist Traditionalist Communion (CTC) | 26 | 0.00 | New | 0 | ±0 | |
| Blank ballots | 5,840 | 0.83 | –0.45 | |||
| Total | 699,480 | 100.00 | 10 | ±0 | ||
| Valid votes | 699,480 | 99.31 | +0.05 | |||
| Invalid votes | 4,843 | 0.69 | –0.05 | |||
| Votes cast / turnout | 704,323 | 78.55 | –0.71 | |||
| Abstentions | 192,360 | 21.45 | +0.71 | |||
| Registered voters | 896,683 | |||||
| Source: Ministry of the Interior | ||||||
Galicia
.png)
| Party | Popular vote | Seats | ||||
|---|---|---|---|---|---|---|
| Votes | % | ±pp | Won | +/− | ||
| People's Party (PP) | 809,879 | 43.86 | –3.29 | 11 | –1 | |
| Socialists' Party of Galicia (PSdeG–PSOE) | 750,492 | 40.64 | +3.45 | 10 | ±0 | |
| Galician Nationalist Bloc (BNG) | 212,543 | 11.51 | +0.14 | 2 | ±0 | |
| United Left–Alternative (EU–IU) | 25,308 | 1.37 | –0.37 | 0 | ±0 | |
| Parties with less than 1.0% of the vote | 28,977 | 1.57 | — | 0 | ±0 | |
|---|---|---|---|---|---|---|
| Union, Progress and Democracy (UPyD) | 10,110 | 0.55 | New | 0 | ±0 | |
| The Greens of Europe (LVE) | 3,802 | 0.21 | New | 0 | ±0 | |
| Anti-Bullfighting Party Against Mistreatment of Animals (PACMA) | 2,854 | 0.15 | New | 0 | ±0 | |
| Social Democratic Party (PSD) | 2,596 | 0.14 | New | 0 | ±0 | |
| For a Fairer World (PUM+J) | 2,172 | 0.12 | New | 0 | ±0 | |
| Citizens–Party of the Citizenry (C's) | 1,131 | 0.06 | New | 0 | ±0 | |
| The Greens–Green Group (OV–GV) | 1,030 | 0.06 | +0.07 | 0 | ±0 | |
| Humanist Party (PH) | 1,027 | 0.06 | –0.09 | 0 | ±0 | |
| Spanish Falange of the JONS (FE–JONS) | 1,001 | 0.05 | +0.01 | 0 | ±0 | |
| Family and Life Party (PFyV) | 891 | 0.05 | New | 0 | ±0 | |
| National Democracy (DN) | 583 | 0.03 | –0.03 | 0 | ±0 | |
| Communist Party of the Galician People (PCPG) | 507 | 0.03 | New | 0 | ±0 | |
| Spanish Alternative (AES) | 307 | 0.02 | New | 0 | ±0 | |
| Internationalist Solidarity and Self-Management (SAIn) | 287 | 0.02 | New | 0 | ±0 | |
| Alternative in Blank (ABLA) | 182 | 0.01 | New | 0 | ±0 | |
| Liberal Democratic Centre (CDL) | 181 | 0.01 | New | 0 | ±0 | |
| Electronic Voting Assembly (AVE) | 144 | 0.01 | New | 0 | ±0 | |
| Spanish Front (Frente) | 114 | 0.01 | New | 0 | ±0 | |
| National Alliance (AN) | 58 | 0.00 | New | 0 | ±0 | |
| Blank ballots | 19,289 | 1.04 | –0.53 | |||
| Total | 1,846,488 | 100.00 | 23 | –1 | ||
| Valid votes | 1,846,488 | 99.29 | ±0.00 | |||
| Invalid votes | 13,266 | 0.71 | ±0.00 | |||
| Votes cast / turnout | 1,859,754 | 70.48 | –0.49 | |||
| Abstentions | 779,062 | 29.52 | +0.49 | |||
| Registered voters | 2,638,816 | |||||
| Source: Ministry of the Interior | ||||||
La Rioja
.png)
| Party | Popular vote | Seats | ||||
|---|---|---|---|---|---|---|
| Votes | % | ±pp | Won | +/− | ||
| People's Party (PP) | 93,104 | 49.51 | –0.43 | 2 | ±0 | |
| Spanish Socialist Workers' Party (PSOE) | 82,032 | 43.63 | –0.34 | 2 | ±0 | |
| United Left (IU) | 3,647 | 1.94 | –0.82 | 0 | ±0 | |
| Riojan Party (PR) | 2,837 | 1.51 | New | 0 | ±0 | |
| Union, Progress and Democracy (UPyD) | 2,405 | 1.28 | New | 0 | ±0 | |
| Parties with less than 1.0% of the vote | 1,940 | 1.03 | — | 0 | ±0 | |
|---|---|---|---|---|---|---|
| The Greens (LV) | 853 | 0.45 | New | 0 | ±0 | |
| For a Fairer World (PUM+J) | 221 | 0.12 | New | 0 | ±0 | |
| Social Democratic Party (PSD) | 214 | 0.11 | New | 0 | ±0 | |
| Communist Party of the Peoples of Spain (PCPE) | 150 | 0.08 | New | 0 | ±0 | |
| Citizens–Party of the Citizenry (C's) | 102 | 0.05 | New | 0 | ±0 | |
| Family and Life Party (PFyV) | 72 | 0.04 | –0.19 | 0 | ±0 | |
| National Democracy (DN) | 72 | 0.04 | –0.03 | 0 | ±0 | |
| Spanish Alternative (AES) | 61 | 0.03 | New | 0 | ±0 | |
| Spanish Falange of the JONS (FE–JONS) | 60 | 0.03 | New | 0 | ±0 | |
| Humanist Party (PH) | 48 | 0.03 | New | 0 | ±0 | |
| Authentic Falange (FA) | 39 | 0.02 | New | 0 | ±0 | |
| Spain 2000 (E–2000) | 37 | 0.02 | New | 0 | ±0 | |
| Carlist Party (PC) | 11 | 0.01 | –0.02 | 0 | ±0 | |
| Blank ballots | 2,068 | 1.10 | –0.97 | |||
| Total | 188,033 | 100.00 | 4 | ±0 | ||
| Valid votes | 188,033 | 99.30 | +0.08 | |||
| Invalid votes | 1,328 | 0.70 | –0.08 | |||
| Votes cast / turnout | 189,361 | 79.29 | –0.17 | |||
| Abstentions | 49,447 | 20.71 | +0.17 | |||
| Registered voters | 238,808 | |||||
| Source: Ministry of the Interior | ||||||
Madrid
.png)
| Party | Popular vote | Seats | ||||
|---|---|---|---|---|---|---|
| Votes | % | ±pp | Won | +/− | ||
| People's Party (PP) | 1,737,688 | 49.19 | +4.17 | 18 | +1 | |
| Spanish Socialist Workers' Party (PSOE) | 1,401,785 | 39.68 | –4.43 | 15 | –1 | |
| United Left of the Madrid Community–Alternative (IUCM) | 164,595 | 4.66 | –1.77 | 1 | –1 | |
| Union, Progress and Democracy (UPyD) | 132,095 | 3.74 | New | 1 | +1 | |
| Parties with less than 1.0% of the vote | 62,679 | 1.77 | — | 0 | ±0 | |
|---|---|---|---|---|---|---|
| The Greens–Green Group (LV–GV) | 10,875 | 0.31 | New | 0 | ±0 | |
| The Greens of the Madrid Community–The Greens of Europe (LVCM–LVE) | 9,925 | 0.28 | –0.28 | 0 | ±0 | |
| Anti-Bullfighting Party Against Mistreatment of Animals (PACMA) | 4,755 | 0.13 | New | 0 | ±0 | |
| Citizens–Party of the Citizenry (C's) | 3,996 | 0.11 | New | 0 | ±0 | |
| Spanish Falange of the JONS (FE–JONS) | 3,250 | 0.09 | +0.01 | 0 | ±0 | |
| National Democracy (DN) | 3,087 | 0.09 | –0.03 | 0 | ±0 | |
| Citizens for Blank Votes (CenB) | 2,687 | 0.08 | –0.21 | 0 | ±0 | |
| For a Fairer World (PUM+J) | 2,516 | 0.07 | New | 0 | ±0 | |
| Communist Party of the Peoples of Spain (PCPE) | 2,130 | 0.06 | +0.01 | 0 | ±0 | |
| Spanish Alternative (AES) | 2,082 | 0.06 | New | 0 | ±0 | |
| Alternative in Blank (ABLA) | 1,876 | 0.05 | New | 0 | ±0 | |
| Non-Smokers' Party (PNF) | 1,616 | 0.05 | New | 0 | ±0 | |
| Union for Leganés (ULEG) | 1,566 | 0.04 | New | 0 | ±0 | |
| Social Democratic Party (PSD) | 1,350 | 0.04 | New | 0 | ±0 | |
| Internationalist Socialist Workers' Party (POSI) | 1,340 | 0.04 | +0.01 | 0 | ±0 | |
| Democratic and Social Centre (CDS) | 1,248 | 0.04 | –0.17 | 0 | ±0 | |
| Family and Life Party (PFyV) | 998 | 0.03 | –0.05 | 0 | ±0 | |
| Humanist Party (PH) | 901 | 0.03 | –0.02 | 0 | ±0 | |
| Spanish Democratic Centre (CDEs) | 828 | 0.02 | New | 0 | ±0 | |
| Liberal Party of State Employment and Housing (PLEVE) | 786 | 0.02 | New | 0 | ±0 | |
| Authentic Falange (FA) | 776 | 0.02 | –0.01 | 0 | ±0 | |
| Spain 2000 (E–2000) | 764 | 0.02 | ±0.00 | 0 | ±0 | |
| Commoners' Land (TC) | 611 | 0.02 | –0.01 | 0 | ±0 | |
| Spanish Front (Frente) | 552 | 0.02 | New | 0 | ±0 | |
| Internationalist Solidarity and Self-Management (SAIn) | 434 | 0.01 | New | 0 | ±0 | |
| National Alliance (AN) | 406 | 0.01 | –0.02 | 0 | ±0 | |
| Carlist Party (PC) | 291 | 0.01 | ±0.00 | 0 | ±0 | |
| Regionalist Party of the Leonese Country (PREPAL) | 250 | 0.01 | New | 0 | ±0 | |
| State of Spain Unionist Party (PUEDE) | 214 | 0.01 | New | 0 | ±0 | |
| Civil Liberties Party (PLCI) | 212 | 0.01 | New | 0 | ±0 | |
| Internationalist Struggle (LI (LIT–CI)) | 183 | 0.01 | ±0.00 | 0 | ±0 | |
| European Ibero-American Alliance Party (PAIE) | 174 | 0.00 | New | 0 | ±0 | |
| Aitch Party (PHache) | 0 | 0.00 | New | 0 | ±0 | |
| Blank ballots | 33,539 | 0.95 | –1.11 | |||
| Total | 3,532,381 | 100.00 | 35 | ±0 | ||
| Valid votes | 3,532,381 | 99.48 | –0.02 | |||
| Invalid votes | 18,477 | 0.52 | +0.02 | |||
| Votes cast / turnout | 3,550,858 | 79.08 | +0.15 | |||
| Abstentions | 939,182 | 20.92 | –0.15 | |||
| Registered voters | 4,490,040 | |||||
| Source: Ministry of the Interior | ||||||
Murcia
.png)
| Party | Popular vote | Seats | ||||
|---|---|---|---|---|---|---|
| Votes | % | ±pp | Won | +/− | ||
| People's Party (PP) | 469,380 | 61.24 | +3.82 | 7 | +1 | |
| Spanish Socialist Workers' Party (PSOE) | 251,822 | 32.85 | –2.15 | 3 | ±0 | |
| United Left of the Region of Murcia–Alternative (IURM) | 22,512 | 2.94 | –1.33 | 0 | ±0 | |
| Parties with less than 1.0% of the vote | 17,150 | 2.24 | — | 0 | ±0 | |
|---|---|---|---|---|---|---|
| Union, Progress and Democracy (UPyD) | 7,172 | 0.94 | New | 0 | ±0 | |
| The Greens (LV) | 3,496 | 0.46 | –0.52 | 0 | ±0 | |
| Anti-Bullfighting Party Against Mistreatment of Animals (PACMA) | 1,178 | 0.15 | New | 0 | ±0 | |
| Liberal Democratic Centre (CDL) | 767 | 0.10 | New | 0 | ±0 | |
| Social Democratic Party (PSD) | 717 | 0.09 | New | 0 | ±0 | |
| For a Fairer World (PUM+J) | 666 | 0.09 | New | 0 | ±0 | |
| Citizens–Party of the Citizenry (C's) | 432 | 0.06 | New | 0 | ±0 | |
| Communist Party of the Peoples of Spain (PCPE) | 431 | 0.06 | ±0.00 | 0 | ±0 | |
| Citizens for Blank Votes (CenB) | 417 | 0.05 | –0.08 | 0 | ±0 | |
| National Democracy (DN) | 333 | 0.04 | ±0.00 | 0 | ±0 | |
| Spanish Falange of the JONS (FE–JONS) | 318 | 0.04 | –0.01 | 0 | ±0 | |
| Family and Life Party (PFyV) | 292 | 0.04 | –0.05 | 0 | ±0 | |
| Authentic Falange (FA) | 176 | 0.02 | –0.03 | 0 | ±0 | |
| Spanish Alternative (AES) | 175 | 0.02 | New | 0 | ±0 | |
| National Alliance (AN) | 132 | 0.02 | New | 0 | ±0 | |
| Spanish Front (Frente) | 132 | 0.02 | New | 0 | ±0 | |
| Centrist Party (PCTR) | 124 | 0.02 | New | 0 | ±0 | |
| Spain 2000 (E–2000) | 116 | 0.02 | ±0.00 | 0 | ±0 | |
| Carlist Traditionalist Communion (CTC) | 76 | 0.01 | New | 0 | ±0 | |
| Blank ballots | 5,649 | 0.74 | –0.69 | |||
| Total | 766,510 | 100.00 | 10 | +1 | ||
| Valid votes | 766,510 | 99.30 | –0.08 | |||
| Invalid votes | 5,402 | 0.70 | +0.08 | |||
| Votes cast / turnout | 771,912 | 79.58 | +2.52 | |||
| Abstentions | 198,034 | 20.42 | –2.52 | |||
| Registered voters | 969,946 | |||||
| Source: Ministry of the Interior | ||||||
Navarre
.png)
| Party | Popular vote | Seats | ||||
|---|---|---|---|---|---|---|
| Votes | % | ±pp | Won | +/− | ||
| Navarrese People's Union–People's Party (UPN–PP) | 133,059 | 39.22 | +1.62 | 2 | ±0 | |
| Spanish Socialist Workers' Party (PSOE) | 117,920 | 34.76 | +1.21 | 2 | ±0 | |
| Yes to Navarre (NaBai) | 62,398 | 18.39 | +0.41 | 1 | ±0 | |
| United Left of Navarre–Alternative (IUN–NEB) | 11,098 | 3.27 | –2.59 | 0 | ±0 | |
| Parties with less than 1.0% of the vote | 9,754 | 2.88 | — | 0 | ±0 | |
|---|---|---|---|---|---|---|
| Union, Progress and Democracy (UPyD) | 2,608 | 0.77 | New | 0 | ±0 | |
| Navarrese Cannabis Representation (RCN/NOK) | 2,288 | 0.67 | New | 0 | ±0 | |
| The Greens–Green Group (LV–GV) | 1,252 | 0.37 | New | 0 | ±0 | |
| For a Fairer World (PUM+J) | 560 | 0.17 | New | 0 | ±0 | |
| Anti-Bullfighting Party Against Mistreatment of Animals (PACMA) | 530 | 0.16 | New | 0 | ±0 | |
| Social Democratic Party (PSD) | 478 | 0.14 | New | 0 | ±0 | |
| Internationalist Solidarity and Self-Management (SAIn) | 360 | 0.11 | New | 0 | ±0 | |
| Carlist Party (PC) | 324 | 0.10 | –0.08 | 0 | ±0 | |
| Family and Life Party (PFyV) | 239 | 0.07 | –0.16 | 0 | ±0 | |
| Citizens–Party of the Citizenry (C's) | 218 | 0.06 | New | 0 | ±0 | |
| Communist Party of the Peoples of Spain–Basque Communists (PCPE–EK) | 213 | 0.06 | New | 0 | ±0 | |
| Humanist Party (PH) | 188 | 0.06 | –0.22 | 0 | ±0 | |
| National Democracy (DN) | 137 | 0.04 | –0.06 | 0 | ±0 | |
| Spanish Falange of the JONS (FE–JONS) | 128 | 0.04 | New | 0 | ±0 | |
| Spain 2000 (E–2000) | 91 | 0.03 | –0.04 | 0 | ±0 | |
| Spanish Alternative (AES) | 90 | 0.03 | New | 0 | ±0 | |
| Authentic Falange (FA) | 50 | 0.01 | New | 0 | ±0 | |
| Blank ballots | 5,001 | 1.47 | –0.51 | |||
| Total | 339,230 | 100.00 | 5 | ±0 | ||
| Valid votes | 339,230 | 99.31 | +3.77 | |||
| Invalid votes | 2,360 | 0.69 | –3.77 | |||
| Votes cast / turnout | 341,590 | 72.06 | –4.16 | |||
| Abstentions | 132,468 | 27.94 | +4.16 | |||
| Registered voters | 474,058 | |||||
| Source: Ministry of the Interior | ||||||
Valencian Community
| Party | Popular vote | Seats | ||||
|---|---|---|---|---|---|---|
| Votes | % | ±pp | Won | +/− | ||
| People's Party (PP) | 1,415,793 | 51.59 | +4.81 | 19 | +2 | |
| Spanish Socialist Workers' Party (PSOE) | 1,124,414 | 40.97 | –1.48 | 14 | ±0 | |
| United and Republican Left (EUPV–IR) | 74,405 | 2.71 | –1.94 | 0 | –1 | |
| Bloc–Initiative–Greens (BNV–IdPV–EV–EE) | 29,760 | 1.08 | –0.45 | 0 | ±0 | |
| Parties with less than 1.0% of the vote | 76,860 | 2.80 | — | 0 | ±0 | |
|---|---|---|---|---|---|---|
| Union, Progress and Democracy (UPyD) | 19,294 | 0.70 | New | 0 | ±0 | |
| The Greens (EV–LV) | 7,824 | 0.29 | –0.52 | 0 | ±0 | |
| Republican Left of the Valencian Country (Esquerra–PV) | 6,607 | 0.24 | –0.26 | 0 | ±0 | |
| The Greens–Green Group (LV–GV) | 5,803 | 0.21 | New | 0 | ±0 | |
| Valencian Coalition (CVa) | 5,424 | 0.20 | New | 0 | ±0 | |
| Navarrese Cannabis Representation (RCN/NOK) | 4,326 | 0.16 | –0.41 | 0 | ±0 | |
| Anti-Bullfighting Party Against Mistreatment of Animals (PACMA) | 4,213 | 0.15 | New | 0 | ±0 | |
| Spain 2000 (E–2000) | 3,875 | 0.14 | +0.04 | 0 | ±0 | |
| Social Democratic Party (PSD) | 3,246 | 0.12 | New | 0 | ±0 | |
| Citizens–Party of the Citizenry (C's) | 2,156 | 0.08 | New | 0 | ±0 | |
| For a Fairer World (PUM+J) | 1,821 | 0.07 | New | 0 | ±0 | |
| Communist Party of the Peoples of Spain (PCPE) | 1,660 | 0.06 | –0.03 | 0 | ±0 | |
| Spanish Falange of the JONS (FE–JONS) | 1,631 | 0.06 | +0.01 | 0 | ±0 | |
| Valencian Nationalist Option (ONV) | 1,490 | 0.05 | New | 0 | ±0 | |
| Citizens for Blank Votes (CenB) | 1,323 | 0.05 | –0.18 | 0 | ±0 | |
| Family and Life Party (PFyV) | 900 | 0.03 | –0.05 | 0 | ±0 | |
| Humanist Party (PH) | 773 | 0.03 | –0.04 | 0 | ±0 | |
| National Democracy (DN) | 734 | 0.03 | –0.04 | 0 | ±0 | |
| For the Valencian Republic (plRV) | 645 | 0.02 | New | 0 | ±0 | |
| Authentic Falange (FA) | 583 | 0.02 | –0.02 | 0 | ±0 | |
| Internationalist Socialist Workers' Party (POSI) | 571 | 0.02 | –0.02 | 0 | ±0 | |
| Spanish Alternative (AES) | 461 | 0.02 | New | 0 | ±0 | |
| Kingdom of Valencia Identity (IRV) | 449 | 0.02 | –0.06 | 0 | ±0 | |
| National Alliance (AN) | 434 | 0.02 | New | 0 | ±0 | |
| Liberal Democratic Centre (CDL) | 347 | 0.01 | New | 0 | ±0 | |
| Centrist Party (PCTR) | 200 | 0.01 | New | 0 | ±0 | |
| Carlist Traditionalist Communion (CTC) | 70 | 0.00 | New | 0 | ±0 | |
| Blank ballots | 23,230 | 0.85 | –0.61 | |||
| Total | 2,744,462 | 100.00 | 33 | +1 | ||
| Valid votes | 2,744,462 | 99.33 | –0.02 | |||
| Invalid votes | 18,558 | 0.67 | +0.02 | |||
| Votes cast / turnout | 2,763,020 | 78.84 | +1.13 | |||
| Abstentions | 741,393 | 21.16 | –1.13 | |||
| Registered voters | 3,504,413 | |||||
| Source: Ministry of the Interior | ||||||
Autonomous cities
Ceuta
| Party | Popular vote | Seats | ||||
|---|---|---|---|---|---|---|
| Votes | % | ±pp | Won | +/− | ||
| People's Party (PP) | 20,040 | 55.11 | –4.13 | 1 | ±0 | |
| Spanish Socialist Workers' Party (PSOE) | 14,716 | 40.47 | +4.69 | 0 | ±0 | |
| Union, Progress and Democracy (UPyD) | 481 | 1.32 | New | 0 | ±0 | |
| Parties with less than 1.0% of the vote | 785 | 2.16 | — | 0 | ±0 | |
|---|---|---|---|---|---|---|
| United Left of Ceuta (IU) | 244 | 0.67 | +0.06 | 0 | ±0 | |
| The Greens–Green Group (LV–GV) | 220 | 0.60 | New | 0 | ±0 | |
| Anti-Bullfighting Party Against Mistreatment of Animals (PACMA) | 104 | 0.29 | New | 0 | ±0 | |
| Social Democratic Party (PSD) | 67 | 0.18 | New | 0 | ±0 | |
| Spanish Falange of the JONS (FE–JONS) | 58 | 0.16 | New | 0 | ±0 | |
| For a Fairer World (PUM+J) | 42 | 0.12 | New | 0 | ±0 | |
| Citizens–Party of the Citizenry (C's) | 32 | 0.09 | New | 0 | ±0 | |
| Spanish Alternative (AES) | 18 | 0.05 | New | 0 | ±0 | |
| Blank ballots | 342 | 0.94 | –0.50 | |||
| Total | 36,364 | 100.00 | 1 | ±0 | ||
| Valid votes | 36,364 | 99.34 | +0.23 | |||
| Invalid votes | 241 | 0.66 | –0.23 | |||
| Votes cast / turnout | 36,605 | 63.32 | –0.13 | |||
| Abstentions | 21,200 | 36.68 | +0.13 | |||
| Registered voters | 57,805 | |||||
| Source: Ministry of the Interior | ||||||
Melilla
| Party | Popular vote | Seats | ||||
|---|---|---|---|---|---|---|
| Votes | % | ±pp | Won | +/− | ||
| People's Party (PP) | 15,717 | 49.03 | –5.57 | 1 | ±0 | |
| Spanish Socialist Workers' Party (PSOE) | 15,420 | 48.10 | +6.67 | 0 | ±0 | |
| Union, Progress and Democracy (UPyD) | 367 | 1.14 | New | 0 | ±0 | |
| Parties with less than 1.0% of the vote | 266 | 0.83 | — | 0 | ±0 | |
|---|---|---|---|---|---|---|
| The Greens–Green Group (LV–GV) | 77 | 0.24 | –0.26 | 0 | ±0 | |
| Social Democratic Party (PSD) | 73 | 0.23 | New | 0 | ±0 | |
| Spanish Falange of the JONS (FE–JONS) | 44 | 0.14 | New | 0 | ±0 | |
| Citizens–Party of the Citizenry (C's) | 39 | 0.12 | New | 0 | ±0 | |
| For a Fairer World (PUM+J) | 33 | 0.10 | New | 0 | ±0 | |
| Blank ballots | 285 | 0.89 | –0.71 | |||
| Total | 32,055 | 100.00 | 1 | ±0 | ||
| Valid votes | 32,055 | 99.26 | +0.08 | |||
| Invalid votes | 240 | 0.74 | –0.08 | |||
| Votes cast / turnout | 32,295 | 63.68 | +7.84 | |||
| Abstentions | 18,416 | 36.32 | –7.84 | |||
| Registered voters | 50,711 | |||||
| Source: Ministry of the Interior | ||||||
| General elections |
|
|---|---|
| European elections | |
| Local elections | |
| Regional elections | |
| Referendums | |
| |
This article is issued from Wikipedia - version of the 12/4/2016. The text is available under the Creative Commons Attribution/Share Alike but additional terms may apply for the media files.