Results breakdown of the Spanish general election, 1989 (Congress)
 |
Main: Spanish general election, 1989 |
|---|
| Sunday, 29 October 1989 |
| |
| Party | Votes | % | MPs |
| | PSOE | 8,115,568 | 39.6% | 175 |
| | PP | 5,285,972 | 25.8% | 107 |
| | IU | 1,858,588 | 9.1% | 17 |
| | CDS | 1,617,716 | 7.9% | 14 |
| | CiU | 1,032,243 | 5.0% | 18 |
| | EAJ/PNV | 254,681 | 1.2% | 5 |
| | Ruiz-Mateos | 219,883 | 1.1% | 0 |
| | HB | 217,278 | 1.1% | 4 |
| | PA | 212,687 | 1.0% | 2 |
| | Others | 1,679,066 | 8.2% | 8 |
| Total | 20,493,682 | 100.0% | 350 |
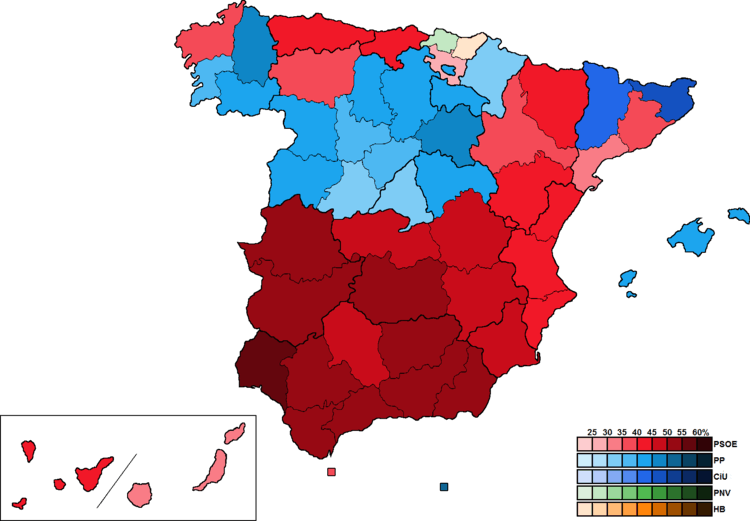
This is the results breakdown of the Congress of Deputies election held in Spain on 29 October 1989.
Nationwide
Overall
← Summary of the 29 October 1989 Congress of Deputies election results →
| |
| Party |
Popular vote |
Seats |
| Votes |
% |
±pp |
Won |
+/− |
|
Spanish Socialist Workers' Party (PSOE) |
8,115,568 | 39.60 | –4.46 |
175 | –9 |
|
People's Party (PP)[lower-alpha 1] |
5,285,972 | 25.79 | –0.18 |
107 | +2 |
|
United Left (IU) |
1,858,588 | 9.07 | +4.44 |
17 | +10 |
|
Democratic and Social Centre (CDS) |
1,617,716 | 7.89 | –1.33 |
14 | –5 |
|
Convergence and Union (CiU) |
1,032,243 | 5.04 | +0.02 |
18 | ±0 |
|
Basque Nationalist Party (EAJ/PNV) |
254,681 | 1.24 | –0.29 |
5 | –1 |
|
Ruiz-Mateos Group (Ruiz-Mateos) |
219,883 | 1.07 | New |
0 | ±0 |
|
Popular Unity (HB) |
217,278 | 1.06 | –0.09 |
4 | –1 |
|
Andalusian Party (PA) |
212,687 | 1.04 | +0.57 |
2 | +2 |
|
The Greens–Green List (LV–LV) |
157,103 | 0.77 | +0.61 |
0 | ±0 |
|
Valencian Union (UV) |
144,924 | 0.71 | +0.39 |
2 | +1 |
|
Basque Solidarity (EA) |
136,955 | 0.67 | New |
2 | +2 |
|
The Ecologist Greens (LVE) |
136,335 | 0.67 | New |
0 | ±0 |
|
Basque Country Left (EE) |
105,238 | 0.51 | –0.02 |
2 | ±0 |
|
Workers' Party of Spain–Communist Unity (PTE–UC)[lower-alpha 2] |
86,257 | 0.42 | –0.72 |
0 | ±0 |
|
Republican Left of Catalonia (ERC) |
84,756 | 0.41 | –0.01 |
0 | ±0 |
|
Workers' Socialist Party (PST) |
81,218 | 0.40 | +0.01 |
0 | ±0 |
|
Regionalist Aragonese Party (PAR) |
71,733 | 0.35 | –0.01 |
1 | ±0 |
|
Canarian Independent Groups (AIC) |
64,767 | 0.32 | –0.01 |
1 | ±0 |
|
Communist Party of the Peoples of Spain (PCPE) |
62,664 | 0.31 | New |
0 | ±0 |
|
Galician Nationalist Bloc (BNG) |
47,763 | 0.23 | +0.10 |
0 | ±0 |
|
Galician Coalition (CG) |
45,821 | 0.22 | –0.18 |
0 | –1 |
|
Valencian People's Union (UPV) |
40,767 | 0.20 | ±0.00 |
0 | ±0 |
|
Galician Socialist Party–Galician Left (PSG–EG) |
34,131 | 0.17 | –0.06 |
0 | ±0 |
|
Green Alternative–Ecologist Movement of Catalonia (AV–MEC)[lower-alpha 3] |
25,978 | 0.13 | –0.02 |
0 | ±0 |
|
Spanish Falange of the JONS (FE–JONS) |
24,025 | 0.12 | –0.10 |
0 | ±0 |
|
Canarian Nationalist Assembly (ACN) |
21,539 | 0.11 | –0.07 |
0 | ±0 |
|
Spanish Vertex Ecological Development Revindication (VERDE) |
21,235 | 0.10 | –0.04 |
0 | ±0 |
| Parties with less than 0.1% of the vote |
144,062 |
0.70 |
— |
0 |
±0 |
|
Social Democratic Coalition (CSD) |
17,095 | 0.08 | +0.06 |
0 | ±0 |
|
Humanist Party (PH) |
15,936 | 0.08 | New |
0 | ±0 |
|
Galician Nationalist Party–Galicianist Party (PNG–PG) |
14,411 | 0.07 | New |
0 | ±0 |
|
Alliance for the Republic (AR) |
12,807 | 0.06 | New |
0 | ±0 |
|
United Extremadura (EU) |
10,984 | 0.05 | –0.03 |
0 | ±0 |
|
Nationalist Left (PSM–EN) |
7,989 | 0.04 | ±0.00 |
0 | ±0 |
|
Revolutionary Workers' Party of Spain (PORE) |
7,906 | 0.04 | +0.01 |
0 | ±0 |
|
Gran Canaria Independents (IGC) |
6,371 | 0.03 | New |
0 | ±0 |
|
Asturianist Party (PAS) |
5,414 | 0.03 | New |
0 | ±0 |
|
Centrist Unity–Democratic Spanish Party (PED) |
4,942 | 0.02 | +0.01 |
0 | ±0 |
|
Galician People's Front (FPG) |
3,657 | 0.02 | New |
0 | ±0 |
|
Madrid Regional Party (PAM) |
3,396 | 0.02 | New |
0 | ±0 |
|
Madrid Radicals' Group (GRM) |
3,330 | 0.02 | New |
0 | ±0 |
|
Asturian Nationalist Unity (UNA) |
3,218 | 0.02 | New |
0 | ±0 |
|
Aragonese Union (UA–CHA) |
3,156 | 0.02 | New |
0 | ±0 |
|
Valencian Nationalist Left–Valencian Regional Union (ENV–URV) |
2,988 | 0.01 | ±0.00 |
0 | ±0 |
|
Regionalist Party of the Leonese Country (PREPAL) |
2,962 | 0.01 | ±0.00 |
0 | ±0 |
|
Balearic Union (UB) |
2,883 | 0.01 | New |
0 | ±0 |
|
United Ceuta (CEU) |
2,760 | 0.01 | New |
0 | ±0 |
|
7 Green Stars (SEV) |
1,411 | 0.01 | New |
0 | ±0 |
|
Green Movement (MV) |
1,368 | 0.01 | New |
0 | ±0 |
|
Independent Citizen Group (ACI) |
1,359 | 0.01 | New |
0 | ±0 |
|
Nationalist Party of Castile and León (PANCAL) |
1,199 | 0.01 | ±0.00 |
0 | ±0 |
|
'Alicantón' Alicantine Coalition (COA) |
1,041 | 0.01 | New |
0 | ±0 |
|
Spanish Democratic Republican Action (ARDE) |
975 | 0.00 | New |
0 | ±0 |
|
Ecological Party of the Basque Country–Green List (PEE–(LV)) |
931 | 0.00 | New |
0 | ±0 |
|
Radicals for Cantabria (RxC) |
904 | 0.00 | New |
0 | ±0 |
|
Independent Spanish Falange (FEI) |
827 | 0.00 | New |
0 | ±0 |
|
Lanzarote Assembly (Tagoror) |
472 | 0.00 | New |
0 | ±0 |
|
Regionalist Party of Guadalajara (PRGU) |
426 | 0.00 | New |
0 | ±0 |
|
Balearic Radical Party (PRB) |
398 | 0.00 | New |
0 | ±0 |
|
Spanish Nationalist Party of Melilla (PNEM) |
301 | 0.00 | New |
0 | ±0 |
|
Proverist Party (PPR) |
245 | 0.00 | ±0.00 |
0 | ±0 |
|
Revolutionary Communist League–Communist Movement (LCR–MC) |
0 | 0.00 | ±0.00 |
0 | ±0 |
|
Communist Party of Spain (Marxist–Leninist) (PCE (m–l)) |
0 | 0.00 | –0.14 |
0 | ±0 |
|
Blank ballots |
141,795 | 0.69 | +0.09 |
|
|
| Total |
20,493,682 | 100.00 | |
350 | ±0 |
|
| Valid votes |
20,493,682 | 99.26 | +0.83 |
|
| Invalid votes |
152,683 | 0.74 | –0.83 |
| Votes cast / turnout |
20,646,365 | 69.74 | –0.75 |
| Abstentions |
8,957,690 | 30.26 | +0.75 |
| Registered voters |
29,604,055 | |
|
| Source: Ministry of the Interior |
- ↑ People's Party results are compared to People's Coalition totals in the 1986 election.
- ↑ PTE–UC results are compared to Communists' Unity Board totals in the 1986 election.
- ↑ AV–MEC results are compared to the Green Alternative List totals in the 1986 election.
|
Distribution by constituency
Summary of constituency results in the 29 October 1989 Congress of Deputies election
| Constituency |
PSOE |
PP |
IU |
CDS |
CiU |
PNV |
HB |
PA |
UV |
EA |
EE |
PAR |
AIC |
| % |
S |
% |
S |
% |
S |
% |
S |
% |
S |
% |
S |
% |
S |
% |
S |
% |
S |
% |
S |
% |
S |
% |
S |
% |
S |
| A Coruña |
36.8 |
4 |
35.8 |
4 |
3.9 |
− |
9.0 |
1 |
|
|
|
|
|
|
|
|
|
| Álava |
25.9 |
2 |
14.1 |
1 |
3.1 |
− |
6.7 |
− |
16.9 |
1 |
11.6 |
− |
8.5 |
− |
8.7 |
− |
| Almería |
52.7 |
4 |
23.4 |
1 |
8.5 |
− |
8.9 |
− |
|
|
2.3 |
− |
|
|
| Albacete |
49.7 |
3 |
30.8 |
1 |
8.4 |
− |
7.4 |
− |
|
| Alicante |
43.8 |
5 |
29.4 |
3 |
9.0 |
1 |
10.0 |
1 |
0.6 |
− |
| Asturias |
40.6 |
4 |
26.5 |
3 |
15.6 |
1 |
12.5 |
1 |
|
| Ávila |
27.8 |
1 |
32.8 |
1 |
4.4 |
− |
31.5 |
1 |
| Badajoz |
54.8 |
4 |
23.5 |
2 |
8.0 |
− |
10.0 |
− |
| Balearic |
34.5 |
3 |
40.7 |
3 |
5.1 |
− |
9.2 |
− |
| Barcelona |
37.0 |
14 |
10.5 |
3 |
8.2 |
3 |
4.5 |
1 |
30.4 |
11 |
| Biscay |
20.8 |
2 |
9.7 |
1 |
3.6 |
− |
3.4 |
− |
|
27.9 |
3 |
15.0 |
2 |
7.9 |
1 |
7.9 |
1 |
| Burgos |
32.3 |
2 |
43.5 |
2 |
7.9 |
− |
10.8 |
− |
|
|
|
|
| Cáceres |
52.6 |
3 |
27.2 |
2 |
5.1 |
− |
8.8 |
− |
| Cádiz |
51.9 |
6 |
16.3 |
1 |
9.6 |
1 |
4.2 |
− |
11.3 |
1 |
| Cantabria |
40.1 |
3 |
38.4 |
2 |
6.4 |
− |
9.7 |
− |
|
| Castellón |
41.7 |
3 |
33.9 |
2 |
5.5 |
− |
8.8 |
− |
1.3 |
− |
| Ceuta |
37.7 |
1 |
34.3 |
− |
|
8.2 |
− |
|
| Ciudad Real |
52.4 |
3 |
30.0 |
2 |
6.3 |
− |
7.9 |
− |
| Córdoba |
49.4 |
5 |
18.2 |
1 |
18.3 |
1 |
5.0 |
− |
5.9 |
− |
| Cuenca |
45.9 |
2 |
39.0 |
1 |
4.3 |
− |
7.2 |
− |
|
| Gipuzkoa |
19.8 |
2 |
7.0 |
− |
2.0 |
− |
2.2 |
− |
16.2 |
1 |
22.0 |
2 |
17.9 |
1 |
10.4 |
1 |
| Girona |
28.9 |
2 |
7.9 |
− |
3.9 |
− |
3.0 |
− |
46.9 |
3 |
|
|
|
|
| Granada |
50.0 |
4 |
24.6 |
3 |
11.5 |
1 |
6.0 |
− |
|
2.6 |
− |
| Guadalajara |
36.5 |
1 |
42.8 |
2 |
8.4 |
− |
7.6 |
− |
|
| Huelva |
58.5 |
4 |
19.6 |
1 |
7.7 |
− |
4.7 |
− |
5.0 |
− |
| Huesca |
40.5 |
2 |
25.5 |
1 |
7.7 |
− |
8.5 |
− |
|
12.1 |
− |
| Jaén |
54.1 |
4 |
24.3 |
2 |
11.5 |
− |
4.8 |
− |
2.5 |
− |
|
| La Rioja |
39.7 |
2 |
41.1 |
2 |
6.4 |
− |
7.2 |
− |
|
| Las Palmas |
32.0 |
3 |
20.7 |
2 |
10.1 |
− |
24.3 |
2 |
1.8 |
− |
| León |
39.9 |
3 |
38.4 |
2 |
6.3 |
− |
10.1 |
− |
|
| Lleida |
28.6 |
2 |
12.4 |
− |
3.7 |
− |
4.0 |
− |
41.8 |
2 |
| Lugo |
31.4 |
2 |
45.8 |
3 |
2.0 |
− |
6.1 |
− |
|
| Madrid |
33.5 |
12 |
34.2 |
12 |
15.4 |
5 |
11.0 |
4 |
| Málaga |
51.6 |
7 |
19.5 |
2 |
13.6 |
1 |
5.6 |
− |
5.1 |
− |
| Melilla |
38.5 |
− |
55.7 |
1 |
|
1.8 |
− |
|
| Murcia |
46.1 |
5 |
30.0 |
3 |
9.2 |
− |
10.4 |
1 |
| Navarre |
31.2 |
2 |
33.2 |
3 |
5.7 |
− |
7.0 |
− |
0.9 |
− |
11.0 |
− |
4.8 |
− |
2.9 |
− |
| Ourense |
35.4 |
2 |
40.7 |
2 |
2.0 |
− |
5.6 |
− |
|
|
|
|
| Palencia |
36.6 |
1 |
44.5 |
2 |
5.8 |
− |
8.6 |
− |
| Pontevedra |
32.9 |
4 |
39.0 |
4 |
3.7 |
− |
8.1 |
− |
| Salamanca |
37.0 |
2 |
40.7 |
2 |
5.7 |
− |
12.5 |
− |
| Santa Cruz |
40.6 |
4 |
17.9 |
1 |
5.6 |
− |
10.1 |
1 |
18.5 |
1 |
| Segovia |
30.7 |
1 |
39.9 |
2 |
7.1 |
− |
16.5 |
− |
|
| Seville |
54.2 |
8 |
19.0 |
2 |
11.5 |
1 |
2.3 |
− |
9.0 |
1 |
| Soria |
33.0 |
1 |
47.9 |
2 |
5.1 |
− |
9.4 |
− |
|
| Tarragona |
34.2 |
2 |
13.1 |
1 |
5.3 |
− |
4.0 |
− |
34.1 |
2 |
| Teruel |
40.1 |
2 |
32.9 |
1 |
4.3 |
− |
8.7 |
− |
|
10.6 |
− |
| Toledo |
47.0 |
3 |
34.4 |
2 |
7.3 |
− |
8.0 |
− |
|
| Valencia |
40.1 |
8 |
24.2 |
4 |
9.9 |
1 |
6.5 |
1 |
11.5 |
2 |
| Valladolid |
35.9 |
2 |
38.1 |
3 |
9.5 |
− |
11.4 |
− |
|
| Zamora |
37.9 |
1 |
42.7 |
2 |
4.0 |
− |
11.5 |
− |
| Zaragoza |
38.0 |
3 |
27.5 |
2 |
11.3 |
1 |
7.2 |
− |
10.6 |
1 |
| Total |
39.6 |
175 |
25.8 |
107 |
9.1 |
17 |
7.9 |
14 |
5.0 |
18 |
1.2 |
5 |
1.1 |
4 |
1.0 |
2 |
0.7 |
2 |
0.7 |
2 |
0.5 |
2 |
0.4 |
1 |
0.3 |
1 |
Autonomous communities
Andalusia
| Parties with less than 1.0% of the vote |
83,461 |
2.44 |
— |
0 |
±0 |
|
The Greens–Green List (LV–LV) |
22,244 | 0.65 | New |
0 | ±0 |
|
Workers' Party of Spain–Communist Unity (PTE–UC)[lower-alpha 2] |
17,720 | 0.52 | –0.60 |
0 | ±0 |
|
The Ecologist Greens (LVE) |
15,724 | 0.46 | New |
0 | ±0 |
|
Workers' Socialist Party (PST) |
10,856 | 0.32 | +0.13 |
0 | ±0 |
|
Communist Party of the Andalusian People (PCPA) |
6,578 | 0.19 | New |
0 | ±0 |
|
Spanish Falange of the JONS (FE–JONS) |
3,413 | 0.10 | –0.07 |
0 | ±0 |
|
Humanist Party (PH) |
2,110 | 0.06 | New |
0 | ±0 |
|
Alliance for the Republic (AR) |
1,878 | 0.06 | New |
0 | ±0 |
|
Spanish Vertex Ecological Development Revindication (VERDE) |
1,436 | 0.04 | ±0.00 |
0 | ±0 |
|
Centrist Unity–Democratic Spanish Party (PED) |
1,257 | 0.04 | New |
0 | ±0 |
|
Proverist Party (PPR) |
245 | 0.01 | New |
0 | ±0 |
|
Communist Party of Spain (Marxist–Leninist) (PCE (m–l)) |
0 | 0.00 | –0.12 |
0 | ±0 |
|
Blank ballots |
15,374 | 0.45 | +0.01 |
|
|
| Total |
3,413,646 | 100.00 | |
61 | +1 |
|
| Valid votes |
3,413,646 | 99.30 | +0.65 |
|
| Invalid votes |
24,108 | 0.70 | –0.65 |
| Votes cast / turnout |
3,437,754 | 69.33 | –1.44 |
| Abstentions |
1,521,041 | 30.67 | +1.44 |
| Registered voters |
4,958,795 | |
|
| Source: Ministry of the Interior |
| |
Aragon
|
Blank ballots |
5,588 | 0.85 | +0.04 |
|
|
| Total |
659,453 | 100.00 | |
13 | –1 |
|
| Valid votes |
659,453 | 99.26 | +1.34 |
|
| Invalid votes |
4,913 | 0.74 | –1.34 |
| Votes cast / turnout |
664,366 | 70.21 | –0.38 |
| Abstentions |
281,955 | 29.79 | +0.38 |
| Registered voters |
946,321 | |
|
| Source: Ministry of the Interior |
| |
Asturias
|
Blank ballots |
3,728 | 0.61 | +0.04 |
|
|
| Total |
612,844 | 100.00 | |
9 | ±0 |
|
| Valid votes |
612,844 | 99.21 | +0.98 |
|
| Invalid votes |
4,853 | 0.79 | –0.98 |
| Votes cast / turnout |
617,697 | 68.90 | +1.08 |
| Abstentions |
278,788 | 31.10 | –1.08 |
| Registered voters |
896,485 | |
|
| Source: Ministry of the Interior |
| |
Balearic Islands
|
Blank ballots |
2,976 | 0.86 | +0.14 |
|
|
| Total |
344,681 | 100.00 | |
6 | ±0 |
|
| Valid votes |
344,681 | 98.83 | +1.01 |
|
| Invalid votes |
4,098 | 1.17 | –1.01 |
| Votes cast / turnout |
348,779 | 63.54 | –2.48 |
| Abstentions |
200,160 | 36.46 | +2.48 |
| Registered voters |
548,939 | |
|
| Source: Ministry of the Interior |
| |
Basque Country
|
Blank ballots |
7,464 | 0.67 | +0.16 |
|
|
| Total |
1,106,941 | 100.00 | |
21 | ±0 |
|
| Valid votes |
1,106,941 | 99.17 | +0.82 |
|
| Invalid votes |
9,247 | 0.83 | –0.82 |
| Votes cast / turnout |
1,116,188 | 66.90 | –0.68 |
| Abstentions |
552,220 | 33.10 | +0.68 |
| Registered voters |
1,668,408 | |
|
| Source: Ministry of the Interior |
| |
Canary Islands
|
Blank ballots |
3,348 | 0.50 | +0.12 |
|
|
| Total |
670,539 | 100.00 | |
14 | +1 |
|
| Valid votes |
670,539 | 99.08 | +1.10 |
|
| Invalid votes |
6,207 | 0.92 | –1.10 |
| Votes cast / turnout |
676,746 | 62.15 | –6.13 |
| Abstentions |
412,187 | 37.85 | +6.13 |
| Registered voters |
1,088,933 | |
|
| Source: Ministry of the Interior |
| |
Cantabria
|
Blank ballots |
2,824 | 0.95 | +0.14 |
|
|
| Total |
297,873 | 100.00 | |
5 | ±0 |
|
| Valid votes |
297,873 | 98.92 | +0.99 |
|
| Invalid votes |
3,245 | 1.08 | –0.99 |
| Votes cast / turnout |
301,118 | 74.28 | +0.85 |
| Abstentions |
104,263 | 25.72 | –0.85 |
| Registered voters |
405,381 | |
|
| Source: Ministry of the Interior |
| |
Castile-La Mancha
|
Blank ballots |
6,105 | 0.63 | +0.02 |
|
|
| Total |
973,659 | 100.00 | |
20 | ±0 |
|
| Valid votes |
973,659 | 99.16 | +0.60 |
|
| Invalid votes |
8,209 | 0.84 | –0.60 |
| Votes cast / turnout |
981,868 | 76.44 | +1.35 |
| Abstentions |
302,642 | 23.56 | –1.35 |
| Registered voters |
1,284,510 | |
|
| Source: Ministry of the Interior |
| |
Castile and León
| Parties with less than 1.0% of the vote |
56,402 |
3.80 |
— |
0 |
±0 |
|
The Ecologist Greens (LVE) |
12,348 | 0.83 | New |
0 | ±0 |
|
Ruiz-Mateos Group (Ruiz-Mateos) |
9,684 | 0.65 | New |
0 | ±0 |
|
The Greens–Green List (LV–LV) |
8,597 | 0.58 | New |
0 | ±0 |
|
Workers' Socialist Party (PST) |
7,971 | 0.54 | +0.02 |
0 | ±0 |
|
Workers' Party of Spain–Communist Unity (PTE–UC)[lower-alpha 2] |
5,355 | 0.36 | –0.73 |
0 | ±0 |
|
Regionalist Party of the Leonese Country (PREPAL) |
2,962 | 0.20 | +0.03 |
0 | ±0 |
|
Communist Party of the Peoples of Spain (PCPE) |
2,697 | 0.18 | New |
0 | ±0 |
|
Spanish Falange of the JONS (FE–JONS) |
2,172 | 0.15 | –0.14 |
0 | ±0 |
|
Humanist Party (PH) |
1,763 | 0.12 | New |
0 | ±0 |
|
Alliance for the Republic (AR) |
1,369 | 0.09 | New |
0 | ±0 |
|
Nationalist Party of Castile and León (PANCAL) |
1,199 | 0.08 | –0.01 |
0 | ±0 |
|
Centrist Unity–Democratic Spanish Party (PED) |
285 | 0.02 | New |
0 | ±0 |
|
Communist Party of Spain (Marxist–Leninist) (PCE (m–l)) |
0 | 0.00 | –0.20 |
0 | ±0 |
|
Blank ballots |
14,783 | 1.00 | +0.10 |
|
|
| Total |
1,483,835 | 100.00 | |
33 | –1 |
|
| Valid votes |
1,483,835 | 98.90 | +0.90 |
|
| Invalid votes |
16,461 | 1.10 | –0.90 |
| Votes cast / turnout |
1,500,296 | 73.35 | +0.54 |
| Abstentions |
545,217 | 26.65 | –0.54 |
| Registered voters |
2,045,513 | |
|
| Source: Ministry of the Interior |
| |
Catalonia
← Summary of the 29 October 1989 Congress of Deputies election results in Catalonia →
| Party |
Popular vote |
Seats |
| Votes |
% |
±pp |
Won |
+/− |
|
Socialists' Party of Catalonia (PSC–PSOE) |
1,123,975 | 35.59 | –5.41 |
20 | –1 |
|
Convergence and Union (CiU) |
1,032,243 | 32.68 | +0.68 |
18 | ±0 |
|
People's Party (PP)[lower-alpha 1] |
336,015 | 10.64 | –0.76 |
4 | –2 |
|
Initiative for Catalonia (IC)[lower-alpha 2] |
231,452 | 7.33 | +3.42 |
3 | +2 |
|
Democratic and Social Centre (CDS) |
136,518 | 4.32 | +0.20 |
1 | ±0 |
|
Republican Left of Catalonia (ERC) |
84,756 | 2.68 | +0.01 |
0 | ±0 |
|
Ruiz-Mateos Group (Ruiz-Mateos) |
37,942 | 1.20 | New |
0 | ±0 |
|
Communists' Party of Catalonia (PCC) |
31,966 | 1.01 | –0.59 |
0 | ±0 |
| Parties with less than 1.0% of the vote |
124,128 |
3.93 |
— |
0 |
±0 |
|
Green Alternative–Ecologist Movement of Catalonia (AV–MEC)[lower-alpha 3] |
25,978 | 0.82 | +0.10 |
0 | ±0 |
|
The Ecologist Greens (EVE) |
24,406 | 0.77 | New |
0 | ±0 |
|
The Greens–Green List (EV–LV) |
19,444 | 0.62 | New |
0 | ±0 |
|
Workers' Party of Spain–Communist Unity (PTE–UC)[lower-alpha 4] |
13,137 | 0.42 | –0.15 |
0 | ±0 |
|
Workers' Socialist Party (PST) |
12,322 | 0.39 | +0.03 |
0 | ±0 |
|
Ecologist Party of Catalonia–VERDE (PEC–VERDE) |
10,054 | 0.32 | –0.05 |
0 | ±0 |
|
Social Democratic Coalition (CSD) |
6,435 | 0.20 | +0.05 |
0 | ±0 |
|
Revolutionary Workers' Party of Spain (PORE) |
3,022 | 0.10 | +0.02 |
0 | ±0 |
|
Humanist Party of Catalonia (PHC) |
2,653 | 0.08 | New |
0 | ±0 |
|
Spanish Falange of the JONS (FE–JONS) |
2,506 | 0.08 | –0.03 |
0 | ±0 |
|
Centrist Unity–Democratic Spanish Party (PED) |
1,662 | 0.05 | +0.01 |
0 | ±0 |
|
Alliance for the Republic (AR) |
1,619 | 0.05 | New |
0 | ±0 |
|
Valencian Nationalist Left-Valencianist Regional Union (ENV–URV) |
890 | 0.03 | New |
0 | ±0 |
|
Communist Party of Spain (Marxist–Leninist) (PCE (m–l)) |
0 | 0.00 | –0.11 |
0 | ±0 |
|
Blank ballots |
19,252 | 0.61 | +0.19 |
|
|
| Total |
3,158,247 | 100.00 | |
46 | –1 |
|
| Valid votes |
3,158,247 | 99.44 | +0.29 |
|
| Invalid votes |
17,660 | 0.56 | –0.29 |
| Votes cast / turnout |
3,175,907 | 67.62 | –1.33 |
| Abstentions |
1,521,105 | 32.38 | +1.33 |
| Registered voters |
4,697,012 | |
|
| Source: Ministry of the Interior |
- ↑ People's Party results are compared to People's Coalition totals in the 1986 election.
- ↑ Initiative for Catalonia results are compared to Union of the Catalan Left totals in the 1986 election.
- ↑ AV–MEC results are compared to the Green Alternative List totals in the 1986 election.
- ↑ PTE–UC results are compared to Communists' Unity Board totals in the 1986 election.
|
Extremadura
|
Blank ballots |
2,885 | 0.47 | –0.05 |
|
|
| Total |
613,801 | 100.00 | |
11 | ±0 |
|
| Valid votes |
613,801 | 99.28 | +0.52 |
|
| Invalid votes |
4,464 | 0.72 | –0.52 |
| Votes cast / turnout |
618,265 | 75.57 | +1.99 |
| Abstentions |
199,878 | 24.43 | –1.99 |
| Registered voters |
818,143 | |
|
| Source: Ministry of the Interior |
| |
Galicia
| Parties with less than 1.0% of the vote |
50,598 |
3.80 |
— |
0 |
±0 |
|
Ruiz-Mateos Group (Ruiz-Mateos) |
13,060 | 0.98 | New |
0 | ±0 |
|
Workers' Socialist Party (PST) |
6,980 | 0.52 | –0.12 |
0 | ±0 |
|
The Ecologist Greens (LVE) |
6,549 | 0.49 | New |
0 | ±0 |
|
The Greens–Green List (LV–LV) |
5,793 | 0.44 | New |
0 | ±0 |
|
Workers' Party of Spain–Communist Unity (PTE–UC)[lower-alpha 2] |
5,280 | 0.40 | –0.54 |
0 | ±0 |
|
Galician People's Front (FPG) |
3,657 | 0.27 | New |
0 | ±0 |
|
Communist Party of the Galician People (PCPG) |
1,801 | 0.14 | New |
0 | ±0 |
|
Spanish Vertex Ecological Development Revindication (VERDE) |
1,539 | 0.12 | +0.01 |
0 | ±0 |
|
Revolutionary Workers' Party of Spain (PORE) |
1,503 | 0.11 | New |
0 | ±0 |
|
Humanist Party (PH) |
1,482 | 0.11 | New |
0 | ±0 |
|
Spanish Falange of the JONS (FE–JONS) |
1,429 | 0.11 | –0.07 |
0 | ±0 |
|
Asturianist Party (PAS) |
935 | 0.07 | New |
0 | ±0 |
|
Alliance for the Republic (AR) |
590 | 0.04 | New |
0 | ±0 |
|
Communist Party of Spain (Marxist–Leninist) (PCE (m–l)) |
0 | 0.00 | –0.17 |
0 | ±0 |
|
Blank ballots |
11,339 | 0.85 | +0.30 |
|
|
| Total |
1,330,388 | 100.00 | |
27 | ±0 |
|
| Valid votes |
1,330,388 | 98.87 | +0.24 |
|
| Invalid votes |
15,265 | 1.13 | –0.24 |
| Votes cast / turnout |
1,345,653 | 60.13 | +2.24 |
| Abstentions |
892,320 | 39.87 | –2.24 |
| Registered voters |
2,237,973 | |
|
| Source: Ministry of the Interior |
| |
La Rioja
|
Blank ballots |
1,775 | 1.20 | +0.28 |
|
|
| Total |
147,808 | 100.00 | |
4 | ±0 |
|
| Valid votes |
147,808 | 99.11 | +1.07 |
|
| Invalid votes |
1,326 | 0.89 | –1.07 |
| Votes cast / turnout |
149,134 | 72.04 | –2.27 |
| Abstentions |
57,875 | 27.96 | +2.27 |
| Registered voters |
207,009 | |
|
| Source: Ministry of the Interior |
| |
Madrid
.png)
| Parties with less than 1.0% of the vote |
100,256 |
3.73 |
— |
0 |
±0 |
|
Ruiz-Mateos Group (Ruiz-Mateos) |
25,539 | 0.95 | New |
0 | ±0 |
|
The Ecologist Greens (LVE) |
23,996 | 0.89 | New |
0 | ±0 |
|
Workers' Party of Spain–Communist Unity (PTE–UC)[lower-alpha 2] |
11,621 | 0.43 | –2.04 |
0 | ±0 |
|
Workers' Socialist Party (PST) |
8,427 | 0.31 | –0.13 |
0 | ±0 |
|
Spanish Vertex Ecological Development Revindication (VERDE) |
4,963 | 0.18 | –0.10 |
0 | ±0 |
|
Spanish Falange of the JONS (FE–JONS) |
3,657 | 0.14 | –0.16 |
0 | ±0 |
|
Madrid Regional Party (PAM) |
3,396 | 0.13 | New |
0 | ±0 |
|
Madrid Radicals' Group (GRM) |
3,330 | 0.12 | New |
0 | ±0 |
|
Communist Party of the Peoples of Spain (PCPE) |
3,002 | 0.11 | New |
0 | ±0 |
|
Humanist Party (PH) |
1,973 | 0.07 | New |
0 | ±0 |
|
Liberal and Social Democratic Coalition (CSD–L) |
1,888 | 0.07 | New |
0 | ±0 |
|
Revolutionary Workers' Party of Spain (PORE) |
1,847 | 0.07 | –0.01 |
0 | ±0 |
|
Alliance for the Republic (AR) |
1,632 | 0.06 | New |
0 | ±0 |
|
Independent Citizen Group (ACI) |
1,359 | 0.05 | New |
0 | ±0 |
|
Centrist Unity–Democratic Spanish Party (PED) |
1,057 | 0.04 | New |
0 | ±0 |
|
Spanish Democratic Republican Action (ARDE) |
975 | 0.04 | New |
0 | ±0 |
|
Independent Spanish Falange (FEI) |
827 | 0.03 | New |
0 | ±0 |
|
Asturianist Party (PAS) |
767 | 0.03 | New |
0 | ±0 |
|
Communist Party of Spain (Marxist–Leninist) (PCE (m–l)) |
0 | 0.00 | –0.08 |
0 | ±0 |
|
Blank ballots |
27,303 | 1.02 | +0.06 |
|
|
| Total |
2,686,715 | 100.00 | |
33 | ±0 |
|
| Valid votes |
2,686,715 | 99.47 | +1.18 |
|
| Invalid votes |
14,227 | 0.53 | –1.18 |
| Votes cast / turnout |
2,700,942 | 72.72 | –1.18 |
| Abstentions |
1,012,999 | 27.28 | +1.18 |
| Registered voters |
3,713,941 | |
|
| Source: Ministry of the Interior |
| |
Murcia
|
Blank ballots |
2,640 | 0.47 | –0.02 |
|
|
| Total |
556,083 | 100.00 | |
9 | +1 |
|
| Valid votes |
556,083 | 99.33 | +0.82 |
|
| Invalid votes |
3,741 | 0.67 | –0.82 |
| Votes cast / turnout |
559,824 | 74.25 | –0.41 |
| Abstentions |
194,156 | 25.75 | +0.41 |
| Registered voters |
753,980 | |
|
| Source: Ministry of the Interior |
| |
Navarre
|
Blank ballots |
2,960 | 1.06 | +0.07 |
|
|
| Total |
277,937 | 100.00 | |
5 | ±0 |
|
| Valid votes |
277,937 | 99.21 | +1.19 |
|
| Invalid votes |
2,213 | 0.79 | –1.19 |
| Votes cast / turnout |
280,150 | 68.54 | –1.26 |
| Abstentions |
128,568 | 31.46 | +1.26 |
| Registered voters |
408,718 | |
|
| Source: Ministry of the Interior |
| |
Valencian Community
| Parties with less than 1.0% of the vote |
55,442 |
2.62 |
— |
0 |
±0 |
|
The Ecologist Greens (LVE) |
15,458 | 0.73 | New |
0 | ±0 |
|
Workers' Party of Spain–Communist Unity (PTE–UC)[lower-alpha 2] |
12,948 | 0.61 | –0.83 |
0 | ±0 |
|
Workers' Socialist Party (PST) |
6,786 | 0.32 | –0.09 |
0 | ±0 |
|
Social Democratic Coalition (CSD) |
4,613 | 0.22 | New |
0 | ±0 |
|
Communist Party of the Peoples of Spain (PCPE) |
4,026 | 0.19 | New |
0 | ±0 |
|
Spanish Falange of the JONS (FE–JONS) |
3,098 | 0.15 | –0.09 |
0 | ±0 |
|
Valencian Nationalist Left–Valencian Regional Union (ENV–URV) |
2,098 | 0.10 | ±0.00 |
0 | ±0 |
|
Alliance for the Republic (AR) |
1,920 | 0.09 | New |
0 | ±0 |
|
Green Movement (MV) |
1,368 | 0.06 | New |
0 | ±0 |
|
Humanist Party (PH) |
1,197 | 0.06 | New |
0 | ±0 |
|
'Alicantón' Alicantine Coalition (COA) |
1,041 | 0.05 | New |
0 | ±0 |
|
Spanish Vertex Ecological Development Revindication (VERDE) |
889 | 0.04 | –0.10 |
0 | ±0 |
|
Communist Party of Spain (Marxist–Leninist) (PCE (m–l)) |
0 | 0.00 | –0.15 |
0 | ±0 |
|
Blank ballots |
11,024 | 0.52 | +0.04 |
|
|
| Total |
2,118,805 | 100.00 | |
31 | ±0 |
|
| Valid votes |
2,118,805 | 99.43 | +1.59 |
|
| Invalid votes |
12,108 | 0.57 | –1.59 |
| Votes cast / turnout |
2,130,913 | 74.80 | –1.60 |
| Abstentions |
717,743 | 25.20 | +1.60 |
| Registered voters |
2,848,656 | |
|
| Source: Ministry of the Interior |
| |
Autonomous cities
Ceuta
Melilla
1989 (void)
1990 (by-election)
|
Blank ballots |
157 | 0.90 | –0.49 |
|
|
| Total |
17,508 | 100.00 | |
1 | ±0 |
|
| Valid votes |
17,508 | 99.29 | +0.57 |
|
| Invalid votes |
126 | 0.71 | –0.57 |
| Votes cast / turnout |
17,634 | 51.89 | –6.06 |
| Abstentions |
16,351 | 48.11 | +6.06 |
| Registered voters |
33,985 | |
|
| Source: Ministry of the Interior |
|
|---|
|
| General elections | |
|---|
|
| European elections | |
|---|
|
| Local elections | |
|---|
|
| Regional elections | |
|---|
|
| Referendums | |
|---|
|
- See also: Elections and referendums in Andalusia
- Aragon
- Asturias
- Balearic Islands
- Basque Country
- Canary Islands
- Cantabria
- Castile and León
- Castile-La Mancha
- Catalonia
- Extremadura
- Galicia
- Madrid
- Murcia
- Navarre
- La Rioja
- Valencian Community
|


.png)
.png)
.png)
.png)
.png)
.png)
.png)
.png)