Results breakdown of the Spanish general election, 1982 (Congress)
 |
Main: Spanish general election, 1982 |
|---|
| Thursday, 28 October 1982 |
| |
| Party | Votes | % | MPs |
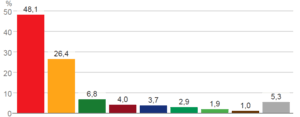
| | PSOE | 10,127,392 | 48.1% | 202 |
| | AP–PDP | 5,548,107 | 26.4% | 107 |
| | UCD | 1,425,093 | 6.8% | 11 |
| | PCE | 846,515 | 4.0% | 4 |
| | CiU | 772,726 | 3.7% | 12 |
| | CDS | 604,309 | 2.9% | 2 |
| | EAJ/PNV | 395,656 | 1.9% | 8 |
| | HB | 210,601 | 1.0% | 2 |
| | Others | 1,119,639 | 5.3% | 2 |
| Total | 21,050,038 | 100.0% | 350 |
This is the results breakdown of the Congress of Deputies election held in Spain on 28 October 1982.
Nationwide
Overall
← Summary of the 28 October 1982 Congress of Deputies election results →
| |
| Party |
Popular vote |
Seats |
| Votes |
% |
±pp |
Won |
+/− |
|
Spanish Socialist Workers' Party (PSOE) |
10,127,392 | 48.11 | +17.71 |
202 | +81 |
|
People's Alliance–People's Democratic Party (AP–PDP)[lower-alpha 1] |
5,548,107 | 26.36 | +18.97 |
107 | +91 |
|
Union of the Democratic Centre (UCD)[lower-alpha 2] |
1,425,093 | 6.77 | –27.14 |
11 | –152 |
|
Communist Party of Spain (PCE) |
846,515 | 4.02 | –6.75 |
4 | –19 |
|
Convergence and Union (CiU) |
772,726 | 3.67 | +0.98 |
12 | +4 |
|
Democratic and Social Centre (CDS) |
604,309 | 2.87 | New |
2 | +2 |
|
Basque Nationalist Party (EAJ/PNV) |
395,656 | 1.88 | +0.23 |
8 | +1 |
|
Popular Unity (HB) |
210,601 | 1.00 | +0.04 |
2 | –1 |
|
Republican Left of Catalonia (ERC) |
138,118 | 0.66 | –0.03 |
1 | ±0 |
|
New Force (FN)[lower-alpha 3] |
108,746 | 0.52 | –1.59 |
0 | –1 |
|
Workers' Socialist Party (PST) |
103,133 | 0.49 | New |
0 | ±0 |
|
Basque Country Left–Left for Socialism (EE) |
100,326 | 0.48 | ±0.00 |
1 | ±0 |
|
Socialist Party of Andalusia–Andalusian Party (PSA–PA) |
84,474 | 0.40 | –1.41 |
0 | –5 |
|
Communists' Party of Catalonia (PCC) |
47,249 | 0.22 | New |
0 | ±0 |
|
Galician Nationalist Bloc–Galician Socialist Party (B–PSG)[lower-alpha 4] |
38,437 | 0.18 | –0.47 |
0 | ±0 |
|
Canarian People's Union (UPC) |
35,013 | 0.17 | –0.16 |
0 | –1 |
|
Left Nationalists (NE) |
30,643 | 0.15 | New |
0 | ±0 |
|
Spanish Solidarity (SE) |
28,451 | 0.14 | New |
0 | ±0 |
|
United Extremadura (EU) |
26,148 | 0.12 | New |
0 | ±0 |
|
Spanish Communist Workers' Party (PCOE) |
25,830 | 0.12 | New |
0 | ±0 |
|
Canarian Convergence (CC) |
25,792 | 0.12 | New |
0 | ±0 |
|
Communist Unification of Spain (UCE) |
24,044 | 0.11 | –0.16 |
0 | ±0 |
|
Communist Party of Spain (Marxist–Leninist) (PCE (m–l)) |
23,186 | 0.11 | New |
0 | ±0 |
|
Galician Left (EG) |
22,192 | 0.11 | New |
0 | ±0 |
| Parties with less than 0.1% of the vote |
159,419 |
0.76 |
— |
0 |
±0 |
|
Canarian Assembly–Canarian Coordinator (AC–CC) |
18,757 | 0.09 | New |
0 | ±0 |
|
Valencian People's Union (UPV) |
18,516 | 0.09 | +0.01 |
0 | ±0 |
|
Communist Unity Candidacy (CUC) |
15,632 | 0.07 | New |
0 | ±0 |
|
United Left of the Valencian Country (EUPV) |
9,302 | 0.04 | New |
0 | ±0 |
|
Falangist Movement of Spain (MFE) |
8,976 | 0.04 | +0.04 |
0 | ±0 |
|
Agrarian Bloc Electoral Group (AEBA) |
8,748 | 0.04 | New |
0 | ±0 |
|
Socialist Party of Majorca–Nationalists of the Islands (PSM) |
8,633 | 0.04 | –0.02 |
0 | ±0 |
|
Socialist Party of Aragon (PSAr) |
6,861 | 0.03 | –0.08 |
0 | ±0 |
|
Valencian Nationalist Left (ENV–URV) |
6,738 | 0.03 | –0.06 |
0 | ±0 |
|
Socialist Party (PS) |
6,375 | 0.03 | –0.71 |
0 | ±0 |
|
Independent Galician Electoral Group (AEGI) |
5,512 | 0.03 | New |
0 | ±0 |
|
Communist League–Internationalist Socialist Workers' Coalition (LC (COSI)) |
5,462 | 0.03 | +0.01 |
0 | ±0 |
|
Communist Front of Catalonia (FCC) |
4,900 | 0.02 | –0.18 |
0 | ±0 |
|
Communist Left Front (FIC) |
3,772 | 0.02 | New |
0 | ±0 |
|
Canarian Nationalist Party (PNC) |
3,257 | 0.02 | New |
0 | ±0 |
|
Regionalist Party of the Leonese Country (PREPAL) |
3,234 | 0.02 | New |
0 | ±0 |
|
Conservatives of Catalonia (CC) |
2,596 | 0.01 | New |
0 | ±0 |
|
Spanish Falange of the JONS (FE–JONS) |
2,528 | 0.01 | –0.16 |
0 | ±0 |
|
Liberal Democratic Asturian Party (PADL) |
2,493 | 0.01 | New |
0 | ±0 |
|
Galician Independents and Migrants (IDG) |
2,236 | 0.01 | New |
0 | ±0 |
|
Spanish Ruralist Party (PRE) |
1,984 | 0.01 | –0.05 |
0 | ±0 |
|
Independent Spanish Falange (FEI) |
1,862 | 0.01 | New |
0 | ±0 |
|
Nationalist Party of Ceuta (PNCe) |
1,785 | 0.01 | New |
0 | ±0 |
|
Independent Citizen Group (ACI) |
1,710 | 0.01 | New |
0 | ±0 |
|
Spanish Catholic Movement (MCE) |
1,694 | 0.01 | New |
0 | ±0 |
|
Communist Left (LCR–MC) |
1,515 | 0.01 | –0.19 |
0 | ±0 |
|
El Bierzo Party (PB) |
1,454 | 0.01 | New |
0 | ±0 |
|
Canarian Social Democratic Association (ASDC) |
1,131 | 0.01 | New |
0 | ±0 |
|
Republican Left (IR) |
610 | 0.00 | –0.31 |
0 | ±0 |
|
Asturian Falange (FA) |
532 | 0.00 | New |
0 | ±0 |
|
Carlist Party (PC) |
224 | 0.00 | –0.28 |
0 | ±0 |
|
Spanish Agrarian Party (PAE) |
222 | 0.00 | New |
0 | ±0 |
|
Proverist Party (PPR) |
168 | 0.00 | –0.03 |
0 | ±0 |
|
Riojan Left Coordinator (CIR) |
0 | 0.00 | New |
0 | ±0 |
|
United Canarian People (PCU) |
0 | 0.00 | New |
0 | ±0 |
|
Majorcan Left (EM) |
0 | 0.00 | New |
0 | ±0 |
|
Asturian Left Bloc (BIA) |
0 | 0.00 | New |
0 | ±0 |
|
Blank ballots |
98,438 | 0.47 | +0.15 |
|
|
| Total |
21,050,038 | 100.00 | |
350 | ±0 |
|
| Valid votes |
21,050,038 | 98.05 | –0.48 |
|
| Invalid votes |
419,236 | 1.95 | +0.48 |
| Votes cast / turnout |
21,469,274 | 79.97 | +11.93 |
| Abstentions |
5,377,666 | 20.03 | –11.93 |
| Registered voters |
26,846,940 | |
|
| Source: Ministry of the Interior |
- ↑ AP–PDP results are compared to the combined totals of CD, UCD in the Basque Country, PAR and UPN in the 1979 election.
- ↑ Union of the Democratic Centre results are compared to UCD totals in the 1979 election, excluding Basque Country results.
- ↑ New Force results are compared to National Union totals in the 1979 election.
- ↑ B–PSG results are compared to the combined totals of the BNPG and UG in the 1979 election.
|
Distribution by constituency
Summary of constituency results in the 28 October 1982 Congress of Deputies election
| Constituency |
PSOE |
AP–PDP |
UCD |
PCE |
CiU |
CDS |
PNV |
HB |
ERC |
EE |
| % |
S |
% |
S |
% |
S |
% |
S |
% |
S |
% |
S |
% |
S |
% |
S |
% |
S |
% |
S |
| A Coruña |
38.2 |
4 |
35.2 |
4 |
13.0 |
1 |
1.8 |
− |
|
2.8 |
− |
|
|
|
|
| Álava |
35.3 |
2 |
19.1 |
1 |
|
1.1 |
− |
3.8 |
− |
22.0 |
1 |
9.9 |
− |
7.0 |
− |
| Almería |
57.8 |
4 |
23.3 |
1 |
11.2 |
− |
2.7 |
− |
1.8 |
− |
|
|
|
| Albacete |
53.6 |
3 |
28.9 |
1 |
8.7 |
− |
4.6 |
− |
2.0 |
− |
| Alicante |
54.1 |
6 |
29.0 |
3 |
7.2 |
− |
4.1 |
− |
2.6 |
− |
| Asturias |
52.1 |
6 |
27.9 |
3 |
4.9 |
− |
8.1 |
1 |
4.3 |
− |
| Ávila |
30.6 |
1 |
33.3 |
1 |
10.0 |
− |
1.7 |
− |
22.4 |
1 |
| Badajoz |
57.3 |
5 |
23.4 |
2 |
8.4 |
− |
4.2 |
− |
1.4 |
− |
| Balearic |
40.5 |
3 |
37.7 |
3 |
10.4 |
− |
1.7 |
− |
5.3 |
− |
| Barcelona |
48.2 |
18 |
14.4 |
5 |
1.5 |
− |
4.9 |
1 |
20.9 |
8 |
1.9 |
− |
3.7 |
1 |
| Biscay |
29.6 |
4 |
12.0 |
1 |
|
2.2 |
− |
|
1.5 |
− |
33.4 |
4 |
13.1 |
1 |
|
6.6 |
− |
| Burgos |
37.6 |
2 |
42.9 |
2 |
9.7 |
− |
1.8 |
− |
4.9 |
− |
|
|
|
| Cáceres |
52.5 |
4 |
24.5 |
1 |
12.6 |
− |
1.6 |
− |
1.9 |
− |
| Cádiz |
63.7 |
6 |
20.1 |
2 |
4.7 |
− |
4.3 |
− |
1.7 |
− |
| Cantabria |
45.0 |
3 |
38.9 |
2 |
5.4 |
− |
3.1 |
− |
5.1 |
− |
| Castellón |
49.6 |
3 |
28.1 |
2 |
12.8 |
− |
3.2 |
− |
2.7 |
− |
| Ceuta |
45.5 |
1 |
29.9 |
− |
7.3 |
− |
0.7 |
− |
7.8 |
− |
| Ciudad Real |
54.0 |
3 |
28.2 |
2 |
10.5 |
− |
2.7 |
− |
2.0 |
− |
| Córdoba |
57.2 |
5 |
21.2 |
2 |
6.7 |
− |
8.8 |
− |
1.3 |
− |
| Cuenca |
44.9 |
2 |
31.8 |
2 |
15.2 |
− |
3.2 |
− |
1.8 |
− |
| Gipuzkoa |
26.0 |
2 |
8.1 |
− |
|
1.3 |
− |
1.7 |
− |
32.6 |
3 |
19.3 |
1 |
9.9 |
1 |
| Girona |
34.2 |
2 |
13.2 |
1 |
2.2 |
− |
3.2 |
− |
36.1 |
2 |
2.0 |
− |
|
|
5.7 |
− |
|
| Granada |
57.8 |
5 |
24.1 |
2 |
6.9 |
− |
7.1 |
− |
|
1.8 |
− |
|
| Guadalajara |
38.2 |
2 |
37.7 |
1 |
13.4 |
− |
3.8 |
− |
3.3 |
− |
| Huelva |
63.4 |
4 |
20.8 |
1 |
7.8 |
− |
3.6 |
− |
1.4 |
− |
| Huesca |
48.4 |
2 |
26.0 |
1 |
14.7 |
− |
2.5 |
− |
4.9 |
− |
| Jaén |
57.1 |
5 |
23.0 |
2 |
8.9 |
− |
7.4 |
− |
0.9 |
− |
| La Rioja |
43.5 |
2 |
41.5 |
2 |
7.4 |
− |
1.6 |
− |
3.7 |
− |
| Las Palmas |
32.6 |
3 |
29.1 |
2 |
13.7 |
1 |
|
5.9 |
− |
| León |
44.7 |
3 |
31.7 |
2 |
15.5 |
1 |
2.0 |
− |
2.7 |
− |
| Lleida |
35.2 |
2 |
15.8 |
1 |
5.7 |
− |
2.7 |
− |
28.0 |
1 |
3.1 |
− |
5.8 |
− |
| Lugo |
27.8 |
1 |
46.2 |
3 |
18.0 |
1 |
0.7 |
− |
|
2.0 |
− |
|
| Madrid |
52.1 |
18 |
32.3 |
11 |
3.3 |
1 |
5.0 |
1 |
4.1 |
1 |
| Málaga |
62.0 |
6 |
23.3 |
2 |
3.8 |
− |
5.3 |
− |
1.5 |
− |
| Melilla |
49.0 |
1 |
26.4 |
− |
14.7 |
− |
|
7.7 |
− |
| Murcia |
50.8 |
5 |
35.6 |
3 |
6.4 |
− |
3.8 |
− |
1.9 |
− |
| Navarre |
37.6 |
3 |
25.6 |
2 |
10.5 |
− |
0.7 |
− |
4.1 |
− |
5.5 |
− |
11.7 |
− |
2.8 |
− |
| Ourense |
28.2 |
1 |
35.6 |
2 |
29.2 |
2 |
0.9 |
− |
1.9 |
− |
|
|
|
| Palencia |
42.9 |
2 |
38.8 |
1 |
10.6 |
− |
2.3 |
− |
3.9 |
− |
| Pontevedra |
30.5 |
3 |
37.5 |
4 |
18.5 |
1 |
1.9 |
− |
2.9 |
− |
| Salamanca |
46.0 |
3 |
29.7 |
1 |
13.7 |
− |
1.2 |
− |
3.8 |
− |
| Santa Cruz |
40.9 |
4 |
24.5 |
2 |
19.3 |
1 |
|
4.0 |
− |
| Segovia |
37.1 |
1 |
38.3 |
2 |
10.5 |
− |
1.5 |
− |
7.5 |
− |
| Seville |
62.0 |
8 |
22.0 |
3 |
3.7 |
− |
7.2 |
1 |
0.7 |
− |
| Soria |
35.3 |
1 |
37.3 |
1 |
18.7 |
1 |
1.2 |
− |
4.7 |
− |
| Tarragona |
42.1 |
3 |
17.8 |
1 |
4.4 |
− |
4.6 |
− |
20.8 |
1 |
2.4 |
− |
4.0 |
− |
| Teruel |
41.0 |
2 |
33.5 |
1 |
16.4 |
− |
1.2 |
− |
|
4.7 |
− |
|
| Toledo |
47.1 |
3 |
33.5 |
2 |
9.7 |
− |
4.4 |
− |
1.8 |
− |
| Valencia |
53.3 |
10 |
29.4 |
5 |
4.4 |
− |
5.3 |
− |
2.4 |
− |
| Valladolid |
51.3 |
3 |
31.3 |
2 |
7.4 |
− |
3.4 |
− |
4.2 |
− |
| Zamora |
36.1 |
2 |
35.9 |
1 |
18.7 |
1 |
1.0 |
− |
4.4 |
− |
| Zaragoza |
51.3 |
5 |
31.5 |
3 |
6.8 |
− |
3.3 |
− |
4.0 |
− |
| Total |
48.1 |
202 |
26.4 |
107 |
6.8 |
11 |
4.0 |
4 |
3.7 |
12 |
2.9 |
2 |
1.9 |
8 |
1.0 |
2 |
0.7 |
1 |
0.5 |
1 |
Autonomous communities
Andalusia
|
Blank ballots |
13,996 | 0.41 | +0.24 |
|
|
| Total |
3,415,819 | 100.00 | |
59 | ±0 |
|
| Valid votes |
3,415,819 | 98.56 | –0.30 |
|
| Invalid votes |
49,863 | 1.44 | +0.30 |
| Votes cast / turnout |
3,465,682 | 78.75 | +10.10 |
| Abstentions |
934,922 | 21.25 | –10.10 |
| Registered voters |
4,400,604 | |
|
| Source: Ministry of the Interior |
| |
Aragon
|
Blank ballots |
4,730 | 0.65 | +0.24 |
|
|
| Total |
723,267 | 100.00 | |
14 | ±0 |
|
| Valid votes |
723,267 | 97.01 | –1.46 |
|
| Invalid votes |
22,295 | 2.99 | +1.46 |
| Votes cast / turnout |
745,562 | 82.42 | +11.67 |
| Abstentions |
159,020 | 17.58 | –11.67 |
| Registered voters |
904,582 | |
|
| Source: Ministry of the Interior |
- ↑ AP–PDP–PAR results are compared to the combined totals of Aragonese Party and Democratic Coalition in the 1979 election.
- ↑ New Force results are compared to National Union totals in the 1979 election.
|
Asturias
|
Blank ballots |
2,799 | 0.43 | +0.21 |
|
|
| Total |
651,378 | 100.00 | |
10 | ±0 |
|
| Valid votes |
651,378 | 98.29 | –0.28 |
|
| Invalid votes |
11,332 | 1.71 | +0.28 |
| Votes cast / turnout |
662,710 | 77.60 | +14.86 |
| Abstentions |
191,271 | 22.40 | –14.86 |
| Registered voters |
853,981 | |
|
| Source: Ministry of the Interior |
| |
Balearic Islands
|
Blank ballots |
2,148 | 0.60 | +0.22 |
|
|
| Total |
356,539 | 100.00 | |
6 | ±0 |
|
| Valid votes |
356,539 | 95.76 | +0.37 |
|
| Invalid votes |
15,791 | 4.24 | –0.37 |
| Votes cast / turnout |
372,330 | 79.74 | +10.09 |
| Abstentions |
94,579 | 20.26 | –10.09 |
| Registered voters |
466,909 | |
|
| Source: Ministry of the Interior |
| |
Basque Country
|
Blank ballots |
5,809 | 0.49 | +0.25 |
|
|
| Total |
1,195,481 | 100.00 | |
21 | ±0 |
|
| Valid votes |
1,195,481 | 97.96 | +0.11 |
|
| Invalid votes |
24,888 | 2.04 | –0.11 |
| Votes cast / turnout |
1,220,369 | 79.34 | +13.39 |
| Abstentions |
317,764 | 20.66 | –13.39 |
| Registered voters |
1,538,133 | |
|
| Source: Ministry of the Interior |
- ↑ AP–PDP–PDL–UCD results are compared to the combined totals of UFV and UCD in the 1979 election.
- ↑ New Force results are compared to National Union totals in the 1979 election.
|
Canary Islands
|
Blank ballots |
3,194 | 0.49 | +0.17 |
|
|
| Total |
653,732 | 100.00 | |
13 | ±0 |
|
| Valid votes |
653,732 | 97.11 | –0.42 |
|
| Invalid votes |
19,475 | 2.89 | +0.42 |
| Votes cast / turnout |
673,207 | 76.00 | +14.86 |
| Abstentions |
212,643 | 24.00 | –14.86 |
| Registered voters |
885,850 | |
|
| Source: Ministry of the Interior |
| |
Cantabria
|
Blank ballots |
1,768 | 0.59 | +0.14 |
|
|
| Total |
302,165 | 100.00 | |
5 | ±0 |
|
| Valid votes |
302,165 | 97.03 | –0.95 |
|
| Invalid votes |
9,250 | 2.97 | +0.95 |
| Votes cast / turnout |
311,415 | 82.67 | +12.22 |
| Abstentions |
65,297 | 17.33 | –12.22 |
| Registered voters |
376,712 | |
|
| Source: Ministry of the Interior |
| |
Castile-La Mancha
|
Blank ballots |
4,330 | 0.44 | +0.20 |
|
|
| Total |
988,746 | 100.00 | |
21 | ±0 |
|
| Valid votes |
988,746 | 97.99 | –0.94 |
|
| Invalid votes |
20,258 | 2.01 | +0.94 |
| Votes cast / turnout |
1,009,004 | 84.11 | +11.33 |
| Abstentions |
190,671 | 15.89 | –11.33 |
| Registered voters |
1,199,675 | |
|
| Source: Ministry of the Interior |
| |
Castile and León
| Parties with less than 1.0% of the vote |
39,076 |
2.57 |
— |
0 |
±0 |
|
Agrarian Bloc Electoral Group (AEBA) |
8,748 | 0.57 | New |
0 | ±0 |
|
New Force (FN)[lower-alpha 2] |
7,556 | 0.50 | –1.73 |
0 | ±0 |
|
Workers' Socialist Party (PST) |
7,219 | 0.47 | New |
0 | ±0 |
|
Regionalist Party of the Leonese Country (PREPAL) |
3,234 | 0.21 | New |
0 | ±0 |
|
Communist Unification of Spain (UCE) |
3,061 | 0.20 | New |
0 | ±0 |
|
Spanish Ruralist Party (PRE) |
1,984 | 0.13 | –0.64 |
0 | ±0 |
|
Communist Party of Spain (Marxist–Leninist) (PCE (m–l)) |
1,740 | 0.11 | New |
0 | ±0 |
|
El Bierzo Party (PB) |
1,454 | 0.10 | New |
0 | ±0 |
|
Communist Unity Candidacy (CUC) |
1,433 | 0.09 | New |
0 | ±0 |
|
Spanish Solidarity (SE) |
1,202 | 0.08 | New |
0 | ±0 |
|
Falangist Movement of Spain (MFE) |
650 | 0.04 | New |
0 | ±0 |
|
Communist League–Internationalist Socialist Workers' Coalition (LC (COSI)) |
435 | 0.03 | +0.03 |
0 | ±0 |
|
Revolutionary Communist League (LCR) |
239 | 0.02 | –0.19 |
0 | ±0 |
|
Communist Movement of Castile and León (MC–CL) |
75 | 0.00 | –0.46 |
0 | ±0 |
|
Spanish Falange of the JONS (FE–JONS) |
46 | 0.00 | –0.35 |
0 | ±0 |
|
Socialist Party (PS) |
0 | 0.00 | New |
0 | ±0 |
|
Blank ballots |
11,606 | 0.76 | +0.17 |
|
|
| Total |
1,523,194 | 100.00 | |
35 | ±0 |
|
| Valid votes |
1,523,194 | 97.21 | –1.30 |
|
| Invalid votes |
43,637 | 2.79 | +1.30 |
| Votes cast / turnout |
1,566,831 | 80.66 | +11.08 |
| Abstentions |
375,564 | 19.34 | –11.08 |
| Registered voters |
1,942,395 | |
|
| Source: Ministry of the Interior |
| |
Catalonia
| Parties with less than 1.0% of the vote |
89,026 |
2.59 |
— |
0 |
±0 |
|
Left Nationalists (NE) |
30,643 | 0.89 | New |
0 | ±0 |
|
Workers' Socialist Party (PST) |
20,110 | 0.58 | New |
0 | ±0 |
|
New Force (FN)[lower-alpha 2] |
12,125 | 0.35 | –0.58 |
0 | ±0 |
|
Socialist Party of Andalusia–Andalusian Party (PSA–PA) |
7,406 | 0.22 | New |
0 | ±0 |
|
Communist Front of Catalonia (FCC) |
4,900 | 0.14 | –0.10 |
0 | ±0 |
|
Communist Workers' Party of Catalonia (PCOC) |
3,143 | 0.09 | New |
0 | ±0 |
|
Communist Party of Spain (Marxist–Leninist) (PCE (m–l)) |
2,751 | 0.08 | New |
0 | ±0 |
|
Spanish Solidarity (SE) |
2,702 | 0.08 | New |
0 | ±0 |
|
Conservatives of Catalonia (CC) |
2,596 | 0.08 | New |
0 | ±0 |
|
Communist Unification of Spain (UCE) |
2,318 | 0.07 | –0.15 |
0 | ±0 |
|
Falangist Movement of Spain (MFE) |
171 | 0.00 | New |
0 | ±0 |
|
Communist League–Internationalist Socialist Workers' Coalition (LC (COSI)) |
161 | 0.00 | ±0.00 |
0 | ±0 |
|
Spanish Falange of the JONS (FE–JONS) |
0 | 0.00 | –0.15 |
0 | ±0 |
|
Socialist Party (PS) |
0 | 0.00 | New |
0 | ±0 |
|
Blank ballots |
13,728 | 0.40 | ±0.00 |
|
|
| Total |
3,437,706 | 100.00 | |
47 | ±0 |
|
| Valid votes |
3,437,706 | 98.66 | +0.42 |
|
| Invalid votes |
46,821 | 1.34 | –0.42 |
| Votes cast / turnout |
3,484,527 | 80.83 | +13.21 |
| Abstentions |
826,342 | 19.17 | –13.21 |
| Registered voters |
4,310,869 | |
|
| Source: Ministry of the Interior |
| |
Extremadura
|
Blank ballots |
2,294 | 0.38 | +0.19 |
|
|
| Total |
601,065 | 100.00 | |
12 | ±0 |
|
| Valid votes |
601,065 | 98.15 | –0.75 |
|
| Invalid votes |
11,356 | 1.85 | +0.75 |
| Votes cast / turnout |
612,421 | 79.98 | +9.90 |
| Abstentions |
153,307 | 20.02 | –9.90 |
| Registered voters |
765,728 | |
|
| Source: Ministry of the Interior |
| |
Galicia
|
Blank ballots |
6,553 | 0.50 | +0.33 |
|
|
| Total |
1,299,010 | 100.00 | |
27 | ±0 |
|
| Valid votes |
1,299,010 | 98.33 | –0.12 |
|
| Invalid votes |
22,050 | 1.67 | +0.12 |
| Votes cast / turnout |
1,321,060 | 63.70 | +14.50 |
| Abstentions |
752,922 | 36.30 | –14.50 |
| Registered voters |
2,073,982 | |
|
| Source: Ministry of the Interior |
- ↑ AP–PDP results are compared to Democratic Coalition totals in the 1979 election.
- ↑ B–PSG results are compared to the combined totals of the BNPG and UG in the 1979 election.
- ↑ New Force results are compared to National Union totals in the 1979 election.
|
La Rioja
|
Blank ballots |
1,086 | 0.70 | +0.12 |
|
|
| Total |
155,995 | 100.00 | |
4 | ±0 |
|
| Valid votes |
155,995 | 97.52 | –1.25 |
|
| Invalid votes |
3,971 | 2.48 | +1.25 |
| Votes cast / turnout |
159,966 | 84.10 | +10.79 |
| Abstentions |
30,238 | 15.90 | –10.79 |
| Registered voters |
190,204 | |
|
| Source: Ministry of the Interior |
| |
Madrid
| Parties with less than 1.0% of the vote |
76,977 |
2.79 |
— |
0 |
–1 |
|
New Force (FN)[lower-alpha 2] |
22,602 | 0.82 | –3.98 |
0 | –1 |
|
Spanish Solidarity (SE) |
10,017 | 0.36 | New |
0 | ±0 |
|
Workers' Socialist Party (PST) |
8,064 | 0.29 | New |
0 | ±0 |
|
Communist Party of Spain (Marxist–Leninist) (PCE (m–l)) |
7,532 | 0.27 | New |
0 | ±0 |
|
Socialist Party (PS) |
6,375 | 0.23 | –0.35 |
0 | ±0 |
|
Spanish Communist Workers' Party (PCOE) |
5,210 | 0.19 | New |
0 | ±0 |
|
Communist Unification of Spain (UCE) |
3,900 | 0.14 | –0.15 |
0 | ±0 |
|
Communist Left Front (FIC) |
3,772 | 0.14 | New |
0 | ±0 |
|
Communist Unity Candidacy (CUC) |
3,188 | 0.12 | New |
0 | ±0 |
|
Falangist Movement of Spain (MFE) |
2,187 | 0.08 | New |
0 | ±0 |
|
Independent Citizen Group (ACI) |
1,710 | 0.06 | New |
0 | ±0 |
|
Spanish Catholic Movement (MCE) |
1,694 | 0.06 | New |
0 | ±0 |
|
Communist League–Internationalist Socialist Workers' Coalition (LC (COSI)) |
634 | 0.02 | –0.10 |
0 | ±0 |
|
Spanish Falange of the JONS (FE–JONS) |
92 | 0.00 | –0.23 |
0 | ±0 |
|
Blank ballots |
11,826 | 0.43 | +0.05 |
|
|
| Total |
2,762,663 | 100.00 | |
32 | ±0 |
|
| Valid votes |
2,762,663 | 98.13 | –0.99 |
|
| Invalid votes |
52,635 | 1.87 | +0.99 |
| Votes cast / turnout |
2,815,298 | 85.96 | +12.69 |
| Abstentions |
459,668 | 14.04 | –12.69 |
| Registered voters |
3,274,966 | |
|
| Source: Ministry of the Interior |
| |
Murcia
|
Blank ballots |
1,854 | 0.35 | –0.11 |
|
|
| Total |
532,961 | 100.00 | |
8 | ±0 |
|
| Valid votes |
532,961 | 98.49 | –0.26 |
|
| Invalid votes |
8,197 | 1.51 | +0.26 |
| Votes cast / turnout |
541,158 | 82.49 | +9.78 |
| Abstentions |
114,894 | 17.51 | –9.78 |
| Registered voters |
656,052 | |
|
| Source: Ministry of the Interior |
| |
Navarre
|
Blank ballots |
1,885 | 0.63 | +0.31 |
|
|
| Total |
298,011 | 100.00 | |
5 | ±0 |
|
| Valid votes |
298,011 | 97.49 | –0.95 |
|
| Invalid votes |
7,682 | 2.51 | +0.95 |
| Votes cast / turnout |
305,693 | 81.33 | +10.67 |
| Abstentions |
70,153 | 18.67 | –10.67 |
| Registered voters |
375,846 | |
|
| Source: Ministry of the Interior |
- ↑ UPN–AP–PDP results are compared to Navarrese People's Union totals in the 1979 election.
|
Valencian Community
| Parties with less than 1.0% of the vote |
82,565 |
3.92 |
— |
0 |
±0 |
|
New Force (FN)[lower-alpha 2] |
18,669 | 0.89 | –1.42 |
0 | ±0 |
|
Valencian People's Union (UPV) |
18,516 | 0.88 | New |
0 | ±0 |
|
Workers' Socialist Party (PST) |
11,967 | 0.57 | New |
0 | ±0 |
|
United Left of the Valencian Country (EUPV) |
9,302 | 0.44 | New |
0 | ±0 |
|
Valencian Nationalist Left (ENV–URV) |
6,738 | 0.32 | –0.52 |
0 | ±0 |
|
Spanish Communist Workers' Party (PCOE) |
4,906 | 0.23 | New |
0 | ±0 |
|
Communist Unification of Spain (UCE) |
2,212 | 0.11 | –0.04 |
0 | ±0 |
|
Spanish Solidarity (SE) |
2,168 | 0.10 | New |
0 | ±0 |
|
Communist Unity Candidacy (CUC) |
2,070 | 0.10 | New |
0 | ±0 |
|
Falangist Movement of Spain (MFE) |
1,753 | 0.08 | New |
0 | ±0 |
|
Communist Party of Spain (Marxist–Leninist) (PCE (m–l)) |
1,753 | 0.08 | New |
0 | ±0 |
|
Independent Spanish Falange (FEI) |
966 | 0.05 | New |
0 | ±0 |
|
Communist League–Internationalist Socialist Workers' Coalition (LC (COSI)) |
935 | 0.04 | New |
0 | ±0 |
|
Republican Left (IR) |
610 | 0.03 | –0.49 |
0 | ±0 |
|
Socialist Party (PS) |
0 | 0.00 | New |
0 | ±0 |
|
Spanish Falange of the JONS (FE–JONS) |
0 | 0.00 | –0.23 |
0 | ±0 |
|
Blank ballots |
8,561 | 0.41 | +0.13 |
|
|
| Total |
2,105,610 | 100.00 | |
29 | ±0 |
|
| Valid votes |
2,105,610 | 97.72 | –1.01 |
|
| Invalid votes |
49,090 | 2.28 | +1.01 |
| Votes cast / turnout |
2,154,700 | 84.03 | +9.14 |
| Abstentions |
409,517 | 15.97 | –9.14 |
| Registered voters |
2,564,217 | |
|
| Source: Ministry of the Interior |
| |
Autonomous cities
Ceuta
|
Blank ballots |
119 | 0.46 | –0.07 |
|
|
| Total |
25,690 | 100.00 | |
1 | ±0 |
|
| Valid votes |
25,690 | 98.37 | –0.51 |
|
| Invalid votes |
427 | 1.63 | +0.51 |
| Votes cast / turnout |
26,117 | 72.29 | +6.85 |
| Abstentions |
10,011 | 27.71 | –6.85 |
| Registered voters |
36,128 | |
|
| Source: Ministry of the Interior |
| |
Melilla
|
Blank ballots |
152 | 0.72 | +0.36 |
|
|
| Total |
21,006 | 100.00 | |
1 | ±0 |
|
| Valid votes |
21,006 | 98.97 | –0.09 |
|
| Invalid votes |
218 | 1.03 | +0.09 |
| Votes cast / turnout |
21,224 | 70.50 | +9.83 |
| Abstentions |
8,883 | 29.50 | –9.83 |
| Registered voters |
30,107 | |
|
| Source: Ministry of the Interior |
| |
|
|---|
|
| General elections | |
|---|
|
| European elections | |
|---|
|
| Local elections | |
|---|
|
| Regional elections | |
|---|
|
| Referendums | |
|---|
|
- See also: Elections and referendums in Andalusia
- Aragon
- Asturias
- Balearic Islands
- Basque Country
- Canary Islands
- Cantabria
- Castile and León
- Castile-La Mancha
- Catalonia
- Extremadura
- Galicia
- Madrid
- Murcia
- Navarre
- La Rioja
- Valencian Community
|


.png)
.png)
.png)
.png)
.png)
.png)
.png)
.png)
.png)