Results breakdown of the Spanish general election, 1993 (Congress)
| |
Main: Spanish general election, 1993 | |||
|---|---|---|---|---|
| Sunday, 6 June 1993 | ||||
 | ||||
| Party | Votes | % | MPs | |
| PSOE | 9,150,083 | 48.1% | 159 | |
| PP | 8,201,463 | 34.8% | 141 | |
| IU | 2,253,722 | 9.6% | 18 | |
| CiU | 1,165,783 | 4.9% | 17 | |
| CDS | 414,740 | 1.8% | 0 | |
| EAJ/PNV | 291,448 | 1.2% | 5 | |
| Others | 2,114,625 | 9.0% | 10 | |
| Total | 23,591,864 | 100.0% | 350 | |
This is the results breakdown of the Congress of Deputies election held in Spain on 6 June 1993.
Nationwide
Overall
 | ||||||
| Party | Popular vote | Seats | ||||
|---|---|---|---|---|---|---|
| Votes | % | ±pp | Won | +/− | ||
| Spanish Socialist Workers' Party (PSOE)[lower-alpha 1] | 9,150,083 | 38.78 | –1.33 | 159 | –18 | |
| People's Party (PP) | 8,201,463 | 34.76 | +8.97 | 141 | +34 | |
| United Left (IU) | 2,253,722 | 9.55 | +0.48 | 18 | +1 | |
| Convergence and Union (CiU) | 1,165,783 | 4.94 | –0.10 | 17 | –1 | |
| Democratic and Social Centre (CDS) | 414,740 | 1.76 | –6.13 | 0 | –14 | |
| Basque Nationalist Party (EAJ/PNV) | 291,448 | 1.24 | ±0.00 | 5 | ±0 | |
| Canarian Coalition (CC)[lower-alpha 2] | 207,077 | 0.88 | +0.45 | 4 | +3 | |
| Popular Unity (HB) | 206,876 | 0.88 | –0.18 | 2 | –2 | |
| Republican Left of Catalonia (ERC) | 189,632 | 0.80 | +0.39 | 1 | +1 | |
| The Greens (LV)[lower-alpha 3] | 185,940 | 0.79 | –0.11 | 0 | ±0 | |
| Aragonese Party (PAR) | 144,544 | 0.61 | +0.26 | 1 | ±0 | |
| Basque Solidarity–Basque Left (EA–EUE) | 129,293 | 0.55 | –0.12 | 1 | –1 | |
| Galician Nationalist Bloc (BNG) | 126,965 | 0.54 | +0.31 | 0 | ±0 | |
| Valencian Union (UV) | 112,341 | 0.48 | –0.23 | 1 | –1 | |
| Andalusian Party (PA) | 96,513 | 0.41 | –0.63 | 0 | –2 | |
| The Ecologists (LE) | 68,851 | 0.29 | –0.38 | 0 | ±0 | |
| Ruiz-Mateos Group–European Democratic Alliance (ARM–ADE) | 54,518 | 0.23 | –0.84 | 0 | ±0 | |
| Andalusian Progress Party (PAP) | 43,169 | 0.18 | New | 0 | ±0 | |
| Valencian People's Union (UPV) | 41,052 | 0.17 | –0.03 | 0 | ±0 | |
| Workers' Socialist Party (PST) | 30,068 | 0.13 | –0.27 | 0 | ±0 | |
| Union for the Progress of Cantabria (UPCA) | 27,005 | 0.11 | New | 0 | ±0 | |
| Parties with less than 0.1% of the vote | 262,102 | 1.11 | — | 0 | ±0 | |
|---|---|---|---|---|---|---|
| Nationalists of the Balearic Islands (PSM–EN) | 20,118 | 0.09 | +0.05 | 0 | ±0 | |
| Regionalist Party of Cantabria (PRC) | 18,608 | 0.08 | New | 0 | ±0 | |
| Alavese Unity (UA) | 16,623 | 0.07 | New | 0 | ±0 | |
| Independent Liberal Group (GIL) | 16,452 | 0.07 | New | 0 | ±0 | |
| Gran Canaria Party (PGC) | 15,246 | 0.06 | New | 0 | ±0 | |
| Leonese People's Union (UPL) | 13,097 | 0.06 | New | 0 | ±0 | |
| Natural Law Party (PLN) | 11,392 | 0.05 | New | 0 | ±0 | |
| Asturianist Party (PAS) | 11,088 | 0.05 | +0.02 | 0 | ±0 | |
| United Extremadura (EU) | 10,653 | 0.05 | ±0.00 | 0 | ±0 | |
| Communist Party of the Peoples of Spain (PCPE) | 10,233 | 0.04 | –0.27 | 0 | ±0 | |
| Majorcan, Minorcan and Pityusic Union (UMMP) | 10,053 | 0.04 | New | 0 | ±0 | |
| Ecologist Party of Catalonia–VERDE (PEC–VERDE) | 9,249 | 0.04 | –0.06 | 0 | ±0 | |
| Humanist Party (PH) | 8,834 | 0.04 | –0.04 | 0 | ±0 | |
| Revolutionary Workers' Party (POR) | 8,667 | 0.04 | ±0.00 | 0 | ±0 | |
| Spanish Falange of the JONS (FE–JONS) | 8,000 | 0.03 | –0.09 | 0 | ±0 | |
| New Socialist Party (NPS) | 7,991 | 0.03 | New | 0 | ±0 | |
| Riojan Party (PR) | 7,532 | 0.03 | New | 0 | ±0 | |
| Aragonese Union (CHA) | 6,344 | 0.03 | +0.01 | 0 | ±0 | |
| Galician Nationalist Convergence (CNG) | 4,663 | 0.02 | New | 0 | ±0 | |
| Commoners' Land–Castilian Nationalist Party (TC–PNC) | 4,647 | 0.02 | New | 0 | ±0 | |
| Galician Alternative (AG) | 3,286 | 0.01 | New | 0 | ±0 | |
| Spanish Democratic Republican Action (ARDE) | 3,063 | 0.01 | +0.01 | 0 | ±0 | |
| Regionalist Unity of Castile and León (URCL) | 2,715 | 0.01 | New | 0 | ±0 | |
| El Bierzo Party (PB) | 2,681 | 0.01 | New | 0 | ±0 | |
| Extremenian Regionalist Party (PREx) | 2,086 | 0.01 | New | 0 | ±0 | |
| Health and Ecology in Solidarity (SEES) | 1,959 | 0.01 | New | 0 | ±0 | |
| Madrilenian Independent Regional Party (PRIM) | 1,917 | 0.01 | –0.01 | 0 | ±0 | |
| Gray Panthers of Spain (ACI) | 1,644 | 0.01 | New | 0 | ±0 | |
| Valencian Nationalist Left (ENV) | 1,517 | 0.01 | ±0.00 | 0 | ±0 | |
| Independent Spanish Falange (FEI) | 1,415 | 0.01 | +0.01 | 0 | ±0 | |
| People's Palentine Group (APP) | 1,410 | 0.01 | New | 0 | ±0 | |
| Rainbow (Arcoiris) | 1,407 | 0.01 | New | 0 | ±0 | |
| Alicantine Country's Greens (PVPA) | 1,375 | 0.01 | New | 0 | ±0 | |
| Cantonal Party (PCAN) | 1,300 | 0.01 | New | 0 | ±0 | |
| Regionalist Party of the Leonese Country (PREPAL) | 1,193 | 0.01 | ±0.00 | 0 | ±0 | |
| Spanish Catholic Movement (MCE) | 1,178 | 0.00 | New | 0 | ±0 | |
| Tinerfenian Assembly (ATF) | 1,159 | 0.00 | New | 0 | ±0 | |
| Socialist Party of the People of Ceuta (PSPC) | 1,155 | 0.00 | New | 0 | ±0 | |
| Gran Canaria Insular Group's Party (AIGC) | 1,009 | 0.00 | New | 0 | ±0 | |
| Castilianist Union (UC) | 949 | 0.00 | New | 0 | ±0 | |
| Andecha Astur (AA) | 787 | 0.00 | New | 0 | ±0 | |
| Authentic Spanish Falange (FEA) | 747 | 0.00 | New | 0 | ±0 | |
| Alicantine Democratic Union (UNIDA) | 715 | 0.00 | –0.01 | 0 | ±0 | |
| Progressive Front of Spain (FPE) | 641 | 0.00 | New | 0 | ±0 | |
| Union of Autonomies (UDLA) | 594 | 0.00 | New | 0 | ±0 | |
| Socialist October (OS) | 540 | 0.00 | New | 0 | ±0 | |
| Independent Council of Asturias (Conceyu) | 528 | 0.00 | New | 0 | ±0 | |
| Integration Party for Almeria and its Peoples (PIAP) | 466 | 0.00 | New | 0 | ±0 | |
| Spanish Balearic Alternative (ABE) | 416 | 0.00 | New | 0 | ±0 | |
| Referendum Tolerant Independent Political Party (PITRCG) | 408 | 0.00 | New | 0 | ±0 | |
| Party of The People (LG) | 385 | 0.00 | New | 0 | ±0 | |
| Nationalist Party of Cantabria (PNC) | 383 | 0.00 | New | 0 | ±0 | |
| Federated Independents of Aragon (IF) | 303 | 0.00 | New | 0 | ±0 | |
| Radical Balearic Party (PRB) | 282 | 0.00 | New | 0 | ±0 | |
| Tagoror Party (Tagoror) | 278 | 0.00 | ±0.00 | 0 | ±0 | |
| Regionalist Party of Guadalajara (PRGU) | 267 | 0.00 | ±0.00 | 0 | ±0 | |
| Socialdemocrat Spanish Christian Monarchy (MCES) | 244 | 0.00 | New | 0 | ±0 | |
| Progressive Sorian Union (US) | 98 | 0.00 | New | 0 | ±0 | |
| Nationalist Party of Castile and León (PANCAL) | 70 | 0.00 | –0.01 | 0 | ±0 | |
| Initiative for Ceuta (INCE) | 42 | 0.00 | New | 0 | ±0 | |
| Communist Unification of Spain (UCE) | 0 | 0.00 | New | 0 | ±0 | |
| Coalition for Free Canaries (CCL) | 0 | 0.00 | New | 0 | ±0 | |
| Centrist Unity–Democratic Spanish Party (PED) | 0 | 0.00 | –0.02 | 0 | ±0 | |
| Ash Independent Group (Freixes) | 0 | 0.00 | New | 0 | ±0 | |
| Blank ballots | 188,679 | 0.80 | +0.11 | |||
| Total | 23,591,864 | 100.00 | 350 | ±0 | ||
| Valid votes | 23,591,864 | 99.46 | +0.20 | |||
| Invalid votes | 126,952 | 0.54 | –0.20 | |||
| Votes cast / turnout | 23,718,816 | 76.44 | +6.70 | |||
| Abstentions | 7,311,695 | 23.56 | –6.70 | |||
| Registered voters | 31,030,511 | |||||
| Source: Ministry of the Interior | ||||||
| ||||||
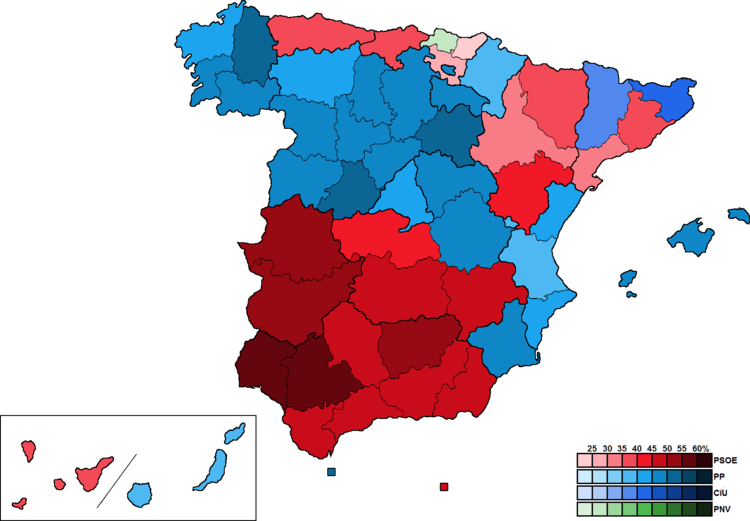
Distribution by constituency
| Constituency | PSOE | PP | IU | CiU | PNV | CC | HB | ERC | PAR | EA | UV | |||||||||||
|---|---|---|---|---|---|---|---|---|---|---|---|---|---|---|---|---|---|---|---|---|---|---|
| % | S | % | S | % | S | % | S | % | S | % | S | % | S | % | S | % | S | % | S | % | S | |
| A Coruña | 37.3 | 4 | 44.2 | 5 | 5.4 | − | ||||||||||||||||
| Álava | 26.1 | 2 | 19.6 | 1 | 6.9 | − | 16.8 | 1 | 9.4 | − | 5.8 | − | ||||||||||
| Almería | 47.9 | 3 | 37.3 | 2 | 9.5 | − | ||||||||||||||||
| Albacete | 46.1 | 2 | 40.5 | 2 | 9.3 | − | ||||||||||||||||
| Alicante | 39.9 | 4 | 43.5 | 5 | 10.3 | 1 | 0.6 | − | ||||||||||||||
| Asturias | 39.3 | 4 | 37.4 | 4 | 15.4 | 1 | ||||||||||||||||
| Ávila | 30.5 | 1 | 50.2 | 2 | 5.5 | − | ||||||||||||||||
| Badajoz | 51.9 | 4 | 35.1 | 2 | 9.0 | − | ||||||||||||||||
| Balearic | 34.0 | 3 | 46.4 | 4 | 6.0 | − | 0.7 | − | ||||||||||||||
| Barcelona | 36.4 | 12 | 17.0 | 6 | 8.5 | 3 | 30.1 | 10 | 4.3 | 1 | ||||||||||||
| Biscay | 24.9 | 3 | 15.3 | 2 | 7.0 | − | 29.5 | 3 | 12.5 | 1 | 6.3 | − | ||||||||||
| Burgos | 34.2 | 2 | 49.6 | 2 | 9.0 | − | ||||||||||||||||
| Cáceres | 50.8 | 3 | 36.9 | 2 | 6.0 | − | ||||||||||||||||
| Cádiz | 50.0 | 5 | 27.7 | 3 | 11.0 | 1 | ||||||||||||||||
| Cantabria | 37.2 | 3 | 37.0 | 2 | 7.4 | − | ||||||||||||||||
| Castellón | 39.6 | 2 | 44.9 | 3 | 7.0 | − | 1.7 | − | ||||||||||||||
| Ceuta | 40.6 | − | 50.9 | 1 | ||||||||||||||||||
| Ciudad Real | 49.0 | 3 | 39.8 | 2 | 7.3 | − | ||||||||||||||||
| Córdoba | 49.2 | 4 | 27.6 | 2 | 17.3 | 1 | ||||||||||||||||
| Cuenca | 43.6 | 1 | 47.0 | 2 | 5.1 | − | ||||||||||||||||
| Gipuzkoa | 23.2 | 2 | 11.5 | 1 | 4.8 | − | 17.3 | 1 | 20.5 | 1 | 17.9 | 1 | ||||||||||
| Girona | 28.1 | 2 | 13.0 | − | 3.5 | − | 42.9 | 3 | 9.1 | − | ||||||||||||
| Granada | 49.4 | 4 | 34.6 | 3 | 10.9 | − | ||||||||||||||||
| Guadalajara | 36.6 | 1 | 48.8 | 2 | 9.2 | − | ||||||||||||||||
| Huelva | 55.9 | 3 | 29.3 | 2 | 9.1 | − | ||||||||||||||||
| Huesca | 38.0 | 2 | 32.3 | 1 | 7.3 | − | 17.8 | − | ||||||||||||||
| Jaén | 52.6 | 4 | 32.4 | 2 | 10.3 | − | ||||||||||||||||
| La Rioja | 37.6 | 2 | 46.3 | 2 | 7.0 | − | ||||||||||||||||
| Las Palmas | 24.8 | 2 | 38.1 | 3 | 5.3 | − | 24.5 | 2 | ||||||||||||||
| León | 40.4 | 2 | 44.2 | 3 | 6.7 | − | ||||||||||||||||
| Lleida | 27.1 | 1 | 19.8 | 1 | 3.2 | − | 39.3 | 2 | 7.5 | − | ||||||||||||
| Lugo | 32.2 | 2 | 53.2 | 3 | 2.7 | − | ||||||||||||||||
| Madrid | 35.0 | 13 | 43.9 | 16 | 14.6 | 5 | ||||||||||||||||
| Málaga | 48.0 | 6 | 31.0 | 3 | 14.1 | 1 | ||||||||||||||||
| Melilla | 48.8 | 1 | 44.9 | − | 2.6 | − | ||||||||||||||||
| Murcia | 38.6 | 4 | 47.3 | 4 | 9.7 | 1 | ||||||||||||||||
| Navarre | 34.9 | 2 | 36.1 | 3 | 8.7 | − | 1.1 | − | 10.4 | − | 3.7 | − | ||||||||||
| Ourense | 39.2 | 2 | 49.1 | 2 | 2.3 | − | ||||||||||||||||
| Palencia | 38.3 | 1 | 47.6 | 2 | 6.4 | − | ||||||||||||||||
| Pontevedra | 34.6 | 3 | 47.2 | 5 | 5.7 | − | ||||||||||||||||
| Salamanca | 37.3 | 2 | 48.6 | 2 | 6.7 | − | ||||||||||||||||
| Santa Cruz | 35.3 | 3 | 29.4 | 2 | 4.6 | − | 26.8 | 2 | ||||||||||||||
| Segovia | 32.3 | 1 | 48.0 | 2 | 7.4 | − | ||||||||||||||||
| Seville | 56.0 | 8 | 26.0 | 3 | 11.7 | 1 | ||||||||||||||||
| Soria | 36.8 | 1 | 50.7 | 2 | 5.6 | − | ||||||||||||||||
| Tarragona | 33.1 | 3 | 19.8 | 1 | 5.1 | − | 32.0 | 2 | 6.6 | − | ||||||||||||
| Teruel | 40.3 | 2 | 38.1 | 1 | 4.4 | − | 13.4 | − | ||||||||||||||
| Toledo | 44.6 | 3 | 44.4 | 2 | 7.3 | − | ||||||||||||||||
| Valencia | 37.2 | 6 | 37.9 | 7 | 11.4 | 2 | 7.5 | 1 | ||||||||||||||
| Valladolid | 36.1 | 2 | 45.4 | 3 | 11.7 | − | ||||||||||||||||
| Zamora | 39.5 | 1 | 49.5 | 2 | 4.4 | − | ||||||||||||||||
| Zaragoza | 32.4 | 3 | 32.2 | 2 | 11.2 | 1 | 20.2 | 1 | ||||||||||||||
| Total | 38.8 | 159 | 34.8 | 141 | 9.6 | 18 | 4.9 | 17 | 1.2 | 5 | 0.9 | 4 | 0.9 | 2 | 0.8 | 1 | 0.6 | 1 | 0.5 | 1 | 0.5 | 1 |
Autonomous communities
Andalusia
.png)
| Party | Popular vote | Seats | ||||
|---|---|---|---|---|---|---|
| Votes | % | ±pp | Won | +/− | ||
| Spanish Socialist Workers' Party of Andalusia (PSOE–A) | 2,063,899 | 51.45 | –1.10 | 37 | –5 | |
| People's Party (PP) | 1,195,476 | 29.80 | +9.63 | 20 | +8 | |
| United Left–Assembly for Andalusia (IU–CA) | 484,753 | 12.08 | +0.11 | 4 | –1 | |
| Andalusian Party (PA) | 96,513 | 2.41 | –3.82 | 0 | –2 | |
| Andalusian Progress Party (PAP) | 43,169 | 1.08 | New | 0 | ±0 | |
| Parties with less than 1.0% of the vote | 106,874 | 2.66 | — | 0 | ±0 | |
|---|---|---|---|---|---|---|
| Democratic and Social Centre (CDS) | 34,900 | 0.87 | –3.80 | 0 | ±0 | |
| The Greens of Andalusia (LV) | 23,372 | 0.58 | –0.07 | 0 | ±0 | |
| Independent Liberal Group (GIL) | 16,452 | 0.41 | New | 0 | ±0 | |
| The Ecologists (LE) | 9,789 | 0.24 | –0.22 | 0 | ±0 | |
| Ruiz-Mateos Group–European Democratic Alliance (ARM–ADE) | 6,765 | 0.17 | –1.34 | 0 | ±0 | |
| Communist Party of the Andalusian People (PCPA) | 5,300 | 0.13 | –0.06 | 0 | ±0 | |
| Workers' Socialist Party (PST) | 2,963 | 0.07 | –0.25 | 0 | ±0 | |
| Spanish Falange of the JONS (FE–JONS) | 2,130 | 0.05 | –0.05 | 0 | ±0 | |
| Natural Law Party (PLN) | 1,447 | 0.04 | New | 0 | ±0 | |
| Humanist Party (PH) | 1,034 | 0.03 | –0.03 | 0 | ±0 | |
| New Socialist Party (NPS) | 935 | 0.02 | New | 0 | ±0 | |
| Health and Ecology in Solidarity (SEES) | 578 | 0.01 | New | 0 | ±0 | |
| Socialist October (OS) | 540 | 0.01 | New | 0 | ±0 | |
| Integration Party for Almeria and its Peoples (PIAP) | 466 | 0.01 | New | 0 | ±0 | |
| Independent Spanish Falange (FEI) | 203 | 0.01 | New | 0 | ±0 | |
| Communist Unification of Spain (UCE) | 0 | 0.00 | New | 0 | ±0 | |
| Blank ballots | 20,742 | 0.52 | +0.07 | |||
| Total | 4,011,426 | 100.00 | 61 | ±0 | ||
| Valid votes | 4,011,426 | 99.57 | +0.27 | |||
| Invalid votes | 17,412 | 0.43 | –0.27 | |||
| Votes cast / turnout | 4,028,838 | 76.20 | +6.87 | |||
| Abstentions | 1,258,648 | 23.80 | –6.87 | |||
| Registered voters | 5,287,486 | |||||
| Source: Ministry of the Interior | ||||||
Aragon
| Party | Popular vote | Seats | ||||
|---|---|---|---|---|---|---|
| Votes | % | ±pp | Won | +/− | ||
| Spanish Socialist Workers' Party (PSOE) | 261,108 | 34.33 | –4.39 | 7 | ±0 | |
| People's Party (PP) | 250,105 | 32.88 | +5.07 | 4 | ±0 | |
| Aragonese Party (PAR) | 144,544 | 19.00 | +8.12 | 1 | ±0 | |
| United Left of Aragon (IU) | 73,820 | 9.71 | –0.03 | 1 | ±0 | |
| Democratic and Social Centre (CDS) | 10,249 | 1.35 | –6.26 | 0 | ±0 | |
| Parties with less than 1.0% of the vote | 15,282 | 2.01 | — | 0 | ±0 | |
|---|---|---|---|---|---|---|
| Aragonese Union (CHA) | 6,344 | 0.83 | +0.35 | 0 | ±0 | |
| The Greens (LV) | 2,808 | 0.37 | –0.08 | 0 | ±0 | |
| Workers' Socialist Party (PST) | 1,692 | 0.22 | –0.39 | 0 | ±0 | |
| Ruiz-Mateos Group–Independent Party–Social Movement (ARM–PAI–MAS) | 1,349 | 0.18 | –0.86 | 0 | ±0 | |
| The Ecologists (LE) | 940 | 0.12 | –0.60 | 0 | ±0 | |
| Natural Law Party (PLN) | 545 | 0.07 | New | 0 | ±0 | |
| Revolutionary Workers' Party (POR) | 438 | 0.06 | New | 0 | ±0 | |
| Health and Ecology in Solidarity (SEES) | 418 | 0.05 | New | 0 | ±0 | |
| Federated Independents of Aragon (IF) | 303 | 0.04 | New | 0 | ±0 | |
| New Socialist Party (NPS) | 250 | 0.03 | New | 0 | ±0 | |
| Humanist Party (PH) | 195 | 0.03 | –0.05 | 0 | ±0 | |
| Communist Unification of Spain (UCE) | 0 | 0.00 | New | 0 | ±0 | |
| Blank ballots | 5,513 | 0.72 | –0.13 | |||
| Total | 760,621 | 100.00 | 13 | ±0 | ||
| Valid votes | 760,621 | 99.41 | +0.15 | |||
| Invalid votes | 4,492 | 0.59 | –0.15 | |||
| Votes cast / turnout | 765,113 | 78.16 | +7.95 | |||
| Abstentions | 213,837 | 21.84 | –7.95 | |||
| Registered voters | 978,950 | |||||
| Source: Ministry of the Interior | ||||||
Asturias
.png)
| Party | Popular vote | Seats | ||||
|---|---|---|---|---|---|---|
| Votes | % | ±pp | Won | +/− | ||
| Spanish Socialist Workers' Party (PSOE) | 271,877 | 39.32 | –1.24 | 4 | ±0 | |
| People's Party (PP) | 258,355 | 37.37 | +10.84 | 4 | +1 | |
| United Left (IU) | 106,757 | 15.44 | –0.14 | 1 | ±0 | |
| Democratic and Social Centre (CDS) | 25,351 | 3.67 | –8.84 | 0 | –1 | |
| Asturianist Party (PAS) | 11,088 | 1.60 | +1.02 | 0 | ±0 | |
| Parties with less than 1.0% of the vote | 11,647 | 1.68 | — | 0 | ±0 | |
|---|---|---|---|---|---|---|
| The Greens (LV) | 4,532 | 0.66 | –0.05 | 0 | ±0 | |
| Workers' Socialist Party (PST) | 2,249 | 0.33 | –0.14 | 0 | ±0 | |
| The Ecologists (LE) | 1,408 | 0.20 | –0.35 | 0 | ±0 | |
| Ruiz-Mateos Group–European Democratic Alliance (ARM–ADE) | 920 | 0.13 | –0.43 | 0 | ±0 | |
| Andecha Astur (AA) | 787 | 0.11 | New | 0 | ±0 | |
| Independent Council of Asturias (Conceyu) | 528 | 0.08 | New | 0 | ±0 | |
| Spanish Falange of the JONS (FE–JONS) | 355 | 0.05 | –0.07 | 0 | ±0 | |
| Natural Law Party (PLN) | 261 | 0.04 | New | 0 | ±0 | |
| Leonese People's Union (UPL) | 243 | 0.04 | New | 0 | ±0 | |
| New Socialist Party (NPS) | 186 | 0.03 | New | 0 | ±0 | |
| Humanist Party (PH) | 178 | 0.03 | –0.04 | 0 | ±0 | |
| Communist Unification of Spain (UCE) | 0 | 0.00 | New | 0 | ±0 | |
| Blank ballots | 6,306 | 0.91 | +0.30 | |||
| Total | 691,381 | 100.00 | 9 | ±0 | ||
| Valid votes | 691,381 | 99.59 | +0.38 | |||
| Invalid votes | 2,862 | 0.41 | –0.38 | |||
| Votes cast / turnout | 694,243 | 75.43 | +6.53 | |||
| Abstentions | 226,147 | 24.57 | –6.53 | |||
| Registered voters | 920,390 | |||||
| Source: Ministry of the Interior | ||||||
Balearic Islands
.png)
| Party | Popular vote | Seats | ||||
|---|---|---|---|---|---|---|
| Votes | % | ±pp | Won | +/− | ||
| People's Party (PP) | 191,461 | 46.41 | +5.75 | 4 | +1 | |
| Spanish Socialist Workers' Party (PSOE) | 140,145 | 33.97 | –0.51 | 3 | ±0 | |
| United Left of the Islands (IU) | 24,574 | 5.96 | +0.87 | 0 | ±0 | |
| Nationalists of the Balearic Islands (PSM–ENE) | 20,118 | 4.88 | +2.56 | 0 | ±0 | |
| Majorcan, Minorcan and Pityusic Union (UMMP) | 10,053 | 2.44 | New | 0 | ±0 | |
| The Greens of the Balearic Islands (EVIB) | 8,971 | 2.17 | –0.37 | 0 | ±0 | |
| Democratic and Social Centre (CDS) | 7,648 | 1.85 | –7.34 | 0 | ±0 | |
| Parties with less than 1.0% of the vote | 6,090 | 1.48 | — | 0 | ±0 | |
|---|---|---|---|---|---|---|
| Republican Left of Catalonia (ERC) | 2,848 | 0.69 | New | 0 | ±0 | |
| Ruiz-Mateos Group–European Democratic Alliance (ARM–ADE) | 1,268 | 0.31 | –2.22 | 0 | ±0 | |
| Natural Law Party (PLN) | 550 | 0.13 | New | 0 | ±0 | |
| Spanish Balearic Alternative (ABE) | 416 | 0.10 | New | 0 | ±0 | |
| Revolutionary Workers' Party (POR) | 369 | 0.09 | –0.04 | 0 | ±0 | |
| New Socialist Party (NPS) | 357 | 0.09 | New | 0 | ±0 | |
| Radical Balearic Party (PRB) | 282 | 0.07 | –0.05 | 0 | ±0 | |
| Communist Unification of Spain (UCE) | 0 | 0.00 | New | 0 | ±0 | |
| Blank ballots | 3,485 | 0.84 | –0.02 | |||
| Total | 412,545 | 100.00 | 7 | +1 | ||
| Valid votes | 412,545 | 99.44 | +0.61 | |||
| Invalid votes | 2,316 | 0.56 | –0.61 | |||
| Votes cast / turnout | 414,861 | 72.56 | +9.02 | |||
| Abstentions | 156,851 | 27.44 | –9.02 | |||
| Registered voters | 571,712 | |||||
| Source: Ministry of the Interior | ||||||
Basque Country
.png)
| Party | Popular vote | Seats | ||||
|---|---|---|---|---|---|---|
| Votes | % | ±pp | Won | +/− | ||
| Socialist Party of the Basque Country–Basque Country Left (PSE–EE (PSOE))[lower-alpha 1] | 293,442 | 24.52 | –5.38 | 7 | –1 | |
| Basque Nationalist Party (EAJ/PNV) | 287,908 | 24.05 | +1.27 | 5 | ±0 | |
| People's Party (PP) | 175,758 | 14.68 | +5.31 | 4 | +2 | |
| Popular Unity (HB) | 174,655 | 14.59 | –2.27 | 2 | –2 | |
| Basque Solidarity–Basque Left (EA–EUE) | 117,856 | 9.85 | –1.32 | 1 | –1 | |
| United Left (IU–EB) | 75,572 | 6.31 | +3.30 | 0 | ±0 | |
| Alavese Unity (UA) | 16,623 | 1.39 | New | 0 | ±0 | |
| The Greens (B–LV) | 12,247 | 1.02 | New | 0 | ±0 | |
| Parties with less than 1.0% of the vote | 23,763 | 1.99 | — | 0 | ±0 | |
|---|---|---|---|---|---|---|
| Democratic and Social Centre (CDS) | 9,147 | 0.76 | –2.70 | 0 | ±0 | |
| The Ecologists (LE) | 6,138 | 0.51 | –0.38 | 0 | ±0 | |
| Workers' Socialist Party (PST) | 3,053 | 0.26 | –0.05 | 0 | ±0 | |
| Ruiz-Mateos Group–European Democratic Alliance (ARM–ADE) | 2,530 | 0.21 | –0.49 | 0 | ±0 | |
| Natural Law Party (PLN) | 901 | 0.08 | New | 0 | ±0 | |
| Revolutionary Workers' Party (POR) | 732 | 0.06 | –0.02 | 0 | ±0 | |
| New Socialist Party (NPS) | 501 | 0.04 | New | 0 | ±0 | |
| Referendum Tolerant Independent Political Party (PITRCG) | 408 | 0.03 | New | 0 | ±0 | |
| Humanist Party (PH) | 353 | 0.03 | –0.05 | 0 | ±0 | |
| Communist Unification of Spain (UCE) | 0 | 0.00 | New | 0 | ±0 | |
| Blank ballots | 19,058 | 1.59 | +0.92 | |||
| Total | 1,196,882 | 100.00 | 19 | –2 | ||
| Valid votes | 1,196,882 | 99.23 | +0.06 | |||
| Invalid votes | 9,247 | 0.77 | –0.06 | |||
| Votes cast / turnout | 1,206,129 | 69.73 | +2.83 | |||
| Abstentions | 523,655 | 30.27 | –2.83 | |||
| Registered voters | 1,729,784 | |||||
| Source: Ministry of the Interior | ||||||
Canary Islands
.png)
| Party | Popular vote | Seats | ||||
|---|---|---|---|---|---|---|
| Votes | % | ±pp | Won | +/− | ||
| People's Party (PP) | 274,666 | 33.93 | +14.54 | 5 | +2 | |
| Spanish Socialist Workers' Party (PSOE) | 241,648 | 29.85 | –6.25 | 5 | –2 | |
| Canarian Coalition (CC)[lower-alpha 1] | 207,077 | 25.58 | +12.71 | 4 | +3 | |
| Canarian United Left (IUC) | 40,314 | 4.98 | –2.98 | 0 | ±0 | |
| Gran Canaria Party (PGC) | 15,246 | 1.88 | New | 0 | ±0 | |
| Democratic and Social Centre (CDS) | 9,910 | 1.22 | –16.36 | 0 | –3 | |
| Parties with less than 1.0% of the vote | 15,552 | 1.92 | — | 0 | ±0 | |
|---|---|---|---|---|---|---|
| The Ecologists (LE) | 4,261 | 0.53 | –0.17 | 0 | ±0 | |
| The Greens (LV) | 2,452 | 0.30 | –0.62 | 0 | ±0 | |
| Workers' Socialist Party (PST) | 2,132 | 0.26 | –0.26 | 0 | ±0 | |
| Tinerfenian Assembly (ATF) | 1,159 | 0.14 | New | 0 | ±0 | |
| Ruiz-Mateos Group–European Democratic Alliance (ARM–ADE) | 1,082 | 0.13 | –1.38 | 0 | ±0 | |
| Gran Canaria Insular Group's Party (AIGC) | 1,009 | 0.12 | New | 0 | ±0 | |
| Communist Party of the Canarian People (PCPC) | 884 | 0.11 | –0.22 | 0 | ±0 | |
| New Socialist Party (NPS) | 780 | 0.10 | New | 0 | ±0 | |
| Humanist Party (PH) | 567 | 0.07 | –0.07 | 0 | ±0 | |
| Natural Law Party (PLN) | 563 | 0.07 | New | 0 | ±0 | |
| Party of The People (LG) | 385 | 0.05 | New | 0 | ±0 | |
| Tagoror Party (Tagoror) | 278 | 0.03 | –0.04 | 0 | ±0 | |
| Coalition for Free Canaries (CCL) | 0 | 0.00 | New | 0 | ±0 | |
| Blank ballots | 5,105 | 0.63 | +0.13 | |||
| Total | 809,518 | 100.00 | 14 | ±0 | ||
| Valid votes | 809,518 | 99.25 | +0.17 | |||
| Invalid votes | 6,129 | 0.75 | –0.17 | |||
| Votes cast / turnout | 815,647 | 68.92 | +6.77 | |||
| Abstentions | 367,853 | 31.08 | –6.77 | |||
| Registered voters | 1,183,500 | |||||
| Source: Ministry of the Interior | ||||||
Cantabria
.png)
| Party | Popular vote | Seats | ||||
|---|---|---|---|---|---|---|
| Votes | % | ±pp | Won | +/− | ||
| Spanish Socialist Workers' Party (PSOE) | 122,418 | 37.17 | –2.90 | 3 | ±0 | |
| People's Party (PP) | 121,967 | 37.03 | –1.38 | 2 | ±0 | |
| Union for the Progress of Cantabria (UPCA) | 27,005 | 8.20 | New | 0 | ±0 | |
| United Left (IU) | 24,453 | 7.42 | +1.02 | 0 | ±0 | |
| Regionalist Party of Cantabria (PRC) | 18,608 | 5.65 | New | 0 | ±0 | |
| Democratic and Social Centre (CDS) | 5,081 | 1.54 | –8.19 | 0 | ±0 | |
| Parties with less than 1.0% of the vote | 5,560 | 1.69 | — | 0 | ±0 | |
|---|---|---|---|---|---|---|
| The Greens (LV) | 1,777 | 0.54 | –0.08 | 0 | ±0 | |
| The Ecologists (LE) | 855 | 0.26 | –0.57 | 0 | ±0 | |
| Workers' Socialist Party (PST) | 729 | 0.22 | –0.36 | 0 | ±0 | |
| Ruiz-Mateos Group–European Democratic Alliance (ARM–ADE) | 557 | 0.17 | –0.57 | 0 | ±0 | |
| Communist Party of the Peoples of Spain (PCPE) | 537 | 0.16 | –0.22 | 0 | ±0 | |
| Nationalist Party of Cantabria (PNC) | 383 | 0.00 | New | 0 | ±0 | |
| Humanist Party (PH) | 239 | 0.07 | –0.05 | 0 | ±0 | |
| Natural Law Party (PLN) | 184 | 0.06 | New | 0 | ±0 | |
| Spanish Democratic Republican Action (ARDE) | 152 | 0.05 | New | 0 | ±0 | |
| New Socialist Party (NPS) | 147 | 0.04 | New | 0 | ±0 | |
| Communist Unification of Spain (UCE) | 0 | 0.00 | New | 0 | ±0 | |
| Blank ballots | 4,252 | 1.29 | +0.36 | |||
| Total | 329,344 | 100.00 | 5 | ±0 | ||
| Valid votes | 329,344 | 99.19 | +0.27 | |||
| Invalid votes | 2,675 | 0.81 | –0.27 | |||
| Votes cast / turnout | 332,019 | 78.98 | +4.70 | |||
| Abstentions | 88,357 | 21.02 | –4.70 | |||
| Registered voters | 420,376 | |||||
| Source: Ministry of the Interior | ||||||
Castile-La Mancha
| Party | Popular vote | Seats | ||||
|---|---|---|---|---|---|---|
| Votes | % | ±pp | Won | +/− | ||
| Spanish Socialist Workers' Party (PSOE) | 487,810 | 45.30 | –2.66 | 10 | –2 | |
| People's Party (PP) | 463,295 | 43.03 | +9.27 | 10 | +2 | |
| United Left (IU) | 81,888 | 7.61 | +0.65 | 0 | ±0 | |
| Democratic and Social Centre (CDS) | 21,868 | 2.03 | –5.70 | 0 | ±0 | |
| Parties with less than 1.0% of the vote | 13,544 | 1.26 | — | 0 | ±0 | |
|---|---|---|---|---|---|---|
| The Greens (LV) | 5,573 | 0.52 | +0.04 | 0 | ±0 | |
| The Ecologists (LE) | 2,786 | 0.26 | –0.23 | 0 | ±0 | |
| Ruiz-Mateos Group–European Democratic Alliance (ARM–ADE) | 2,230 | 0.21 | –0.49 | 0 | ±0 | |
| Commoners' Land–Castilian Nationalist Party (TC–PNC) | 966 | 0.09 | New | 0 | ±0 | |
| Natural Law Party (PLN) | 539 | 0.05 | New | 0 | ±0 | |
| Humanist Party (PH) | 431 | 0.04 | –0.03 | 0 | ±0 | |
| New Socialist Party (NPS) | 416 | 0.04 | New | 0 | ±0 | |
| Regionalist Party of Guadalajara (PRGU) | 267 | 0.02 | –0.02 | 0 | ±0 | |
| Socialdemocrat Spanish Christian Monarchy (MCES) | 137 | 0.01 | New | 0 | ±0 | |
| Castilianist Union (UC) | 124 | 0.01 | New | 0 | ±0 | |
| Spanish Falange of the JONS (FE–JONS) | 75 | 0.01 | –0.09 | 0 | ±0 | |
| Communist Unification of Spain (UCE) | 0 | 0.00 | New | 0 | ±0 | |
| Blank ballots | 8,339 | 0.77 | +0.14 | |||
| Total | 1,076,744 | 100.00 | 20 | ±0 | ||
| Valid votes | 1,076,744 | 99.38 | +0.22 | |||
| Invalid votes | 6,765 | 0.62 | –0.22 | |||
| Votes cast / turnout | 1,083,509 | 82.13 | +5.69 | |||
| Abstentions | 235,743 | 17.87 | –5.69 | |||
| Registered voters | 1,319,252 | |||||
| Source: Ministry of the Interior | ||||||
Castile and León
| Party | Popular vote | Seats | ||||
|---|---|---|---|---|---|---|
| Votes | % | ±pp | Won | +/− | ||
| People's Party (PP) | 771,705 | 47.37 | +7.12 | 20 | +2 | |
| Spanish Socialist Workers' Party (PSOE) | 597,961 | 36.71 | +1.16 | 13 | –1 | |
| United Left of Castile and León (IU) | 125,417 | 7.70 | +1.05 | 0 | ±0 | |
| Democratic and Social Centre (CDS) | 67,517 | 4.14 | –8.61 | 0 | –1 | |
| Parties with less than 1.0% of the vote | 47,447 | 2.91 | — | 0 | ±0 | |
|---|---|---|---|---|---|---|
| Leonese People's Union (UPL) | 12,246 | 0.75 | New | 0 | ±0 | |
| The Greens (LV) | 11,570 | 0.71 | +0.13 | 0 | ±0 | |
| The Ecologists (LE) | 4,955 | 0.30 | –0.53 | 0 | ±0 | |
| Ruiz-Mateos Group–European Democratic Alliance (ARM–ADE) | 3,936 | 0.24 | –0.41 | 0 | ±0 | |
| Commoners' Land–Castilian Nationalist Party (TC–PNC) | 2,876 | 0.18 | New | 0 | ±0 | |
| Regionalist Unity of Castile and León (URCL) | 2,715 | 0.17 | New | 0 | ±0 | |
| El Bierzo Party (PB) | 1,882 | 0.12 | New | 0 | ±0 | |
| People's Palentine Group (APP) | 1,410 | 0.09 | New | 0 | ±0 | |
| Regionalist Party of the Leonese Country (PREPAL) | 1,193 | 0.07 | –0.13 | 0 | ±0 | |
| Spanish Falange of the JONS (FE–JONS) | 1,142 | 0.07 | –0.08 | 0 | ±0 | |
| Castilianist Union (UC) | 825 | 0.05 | New | 0 | ±0 | |
| Natural Law Party (PLN) | 802 | 0.05 | New | 0 | ±0 | |
| Humanist Party (PH) | 699 | 0.04 | –0.08 | 0 | ±0 | |
| New Socialist Party (NPS) | 613 | 0.04 | New | 0 | ±0 | |
| Gray Panthers of Spain (ACI) | 161 | 0.01 | New | 0 | ±0 | |
| Communist Party of the Peoples of Spain (PCPE) | 147 | 0.01 | –0.17 | 0 | ±0 | |
| Socialdemocrat Spanish Christian Monarchy (MCES) | 107 | 0.01 | New | 0 | ±0 | |
| Progressive Sorian Union (US) | 98 | 0.01 | New | 0 | ±0 | |
| Nationalist Party of Castile and León (PANCAL) | 70 | 0.00 | –0.08 | 0 | ±0 | |
| Communist Unification of Spain (UCE) | 0 | 0.00 | New | 0 | ±0 | |
| Blank ballots | 19,001 | 1.17 | +0.17 | |||
| Total | 1,629,048 | 100.00 | 33 | ±0 | ||
| Valid votes | 1,629,048 | 99.25 | +0.35 | |||
| Invalid votes | 12,335 | 0.75 | –0.35 | |||
| Votes cast / turnout | 1,641,383 | 78.27 | +4.92 | |||
| Abstentions | 455,722 | 21.73 | –4.92 | |||
| Registered voters | 2,097,105 | |||||
| Source: Ministry of the Interior | ||||||
Catalonia
| Party | Popular vote | Seats | ||||
|---|---|---|---|---|---|---|
| Votes | % | ±pp | Won | +/− | ||
| Socialists' Party of Catalonia (PSC–PSOE) | 1,277,838 | 34.87 | –0.72 | 18 | –2 | |
| Convergence and Union (CiU) | 1,165,783 | 31.82 | –0.86 | 17 | –1 | |
| People's Party (PP) | 624,493 | 17.04 | +6.40 | 8 | +4 | |
| Initiative for Catalonia (IC) | 273,444 | 7.46 | +0.13 | 3 | ±0 | |
| Republican Left of Catalonia (ERC) | 186,784 | 5.10 | +2.42 | 1 | +1 | |
| The Greens–Ecologist Confederation of Catalonia (EV–CEC)[lower-alpha 1] | 36,683 | 1.00 | –0.44 | 0 | ±0 | |
| Parties with less than 1.0% of the vote | 75,052 | 2.05 | — | 0 | –1 | |
|---|---|---|---|---|---|---|
| Democratic and Social Centre (CDS) | 27,576 | 0.75 | –3.57 | 0 | –1 | |
| The Ecologists (LE) | 11,846 | 0.32 | –0.45 | 0 | ±0 | |
| Workers' Socialist Party (PST) | 9,356 | 0.26 | –0.13 | 0 | ±0 | |
| Ecologist Party of Catalonia–VERDE (PEC–VERDE) | 9,249 | 0.25 | –0.07 | 0 | ±0 | |
| Ruiz-Mateos Group–European Democratic Alliance (ARM–ADE) | 6,961 | 0.19 | –1.01 | 0 | ±0 | |
| Revolutionary Workers' Party (POR) | 3,246 | 0.09 | –0.01 | 0 | ±0 | |
| Natural Law Party (PLN) | 1,592 | 0.04 | New | 0 | ±0 | |
| Humanist Party (PH) | 1,513 | 0.04 | –0.04 | 0 | ±0 | |
| Spanish Falange of the JONS (FE–JONS) | 1,266 | 0.03 | –0.05 | 0 | ±0 | |
| New Socialist Party (NPS) | 1,106 | 0.03 | New | 0 | ±0 | |
| Authentic Spanish Falange (FEA) | 747 | 0.02 | New | 0 | ±0 | |
| Union of Autonomies (UDLA) | 594 | 0.02 | New | 0 | ±0 | |
| Communist Unification of Spain (UCE) | 0 | 0.00 | New | 0 | ±0 | |
| Ash Independent Group (Freixes) | 0 | 0.00 | New | 0 | ±0 | |
| Blank ballots | 24,156 | 0.66 | +0.05 | |||
| Total | 3,664,233 | 100.00 | 47 | +1 | ||
| Valid votes | 3,664,233 | 99.59 | +0.15 | |||
| Invalid votes | 15,047 | 0.41 | –0.15 | |||
| Votes cast / turnout | 3,679,280 | 75.37 | +7.75 | |||
| Abstentions | 1,202,375 | 24.63 | –7.75 | |||
| Registered voters | 4,881,655 | |||||
| Source: Ministry of the Interior | ||||||
| ||||||
Extremadura
| Party | Popular vote | Seats | ||||
|---|---|---|---|---|---|---|
| Votes | % | ±pp | Won | +/− | ||
| Spanish Socialist Workers' Party (PSOE) | 342,977 | 51.50 | –2.40 | 7 | ±0 | |
| People's Party (PP) | 238,191 | 35.77 | +10.80 | 4 | ±0 | |
| United Left of Extremadura (IU) | 52,214 | 7.84 | +0.97 | 0 | ±0 | |
| Democratic and Social Centre (CDS) | 13,598 | 2.04 | –7.48 | 0 | ±0 | |
| United Extremadura (EU) | 6,908 | 1.04 | –0.75 | 0 | ±0 | |
| Parties with less than 1.0% of the vote | 8,416 | 1.26 | — | 0 | ±0 | |
|---|---|---|---|---|---|---|
| The Greens (LV) | 3,388 | 0.51 | +0.24 | 0 | ±0 | |
| Extremenian Regionalist Party (PREx) | 2,086 | 0.31 | New | 0 | ±0 | |
| The Ecologists (LE) | 1,560 | 0.23 | –0.13 | 0 | ±0 | |
| Ruiz-Mateos Group–European Democratic Alliance (ARM–ADE) | 699 | 0.10 | –0.49 | 0 | ±0 | |
| Natural Law Party (PLN) | 300 | 0.05 | New | 0 | ±0 | |
| New Socialist Party (NPS) | 264 | 0.04 | New | 0 | ±0 | |
| Humanist Party (PH) | 119 | 0.02 | –0.03 | 0 | ±0 | |
| Communist Unification of Spain (UCE) | 0 | 0.00 | New | 0 | ±0 | |
| Blank ballots | 3,609 | 0.54 | +0.07 | |||
| Total | 665,913 | 100.00 | 11 | ±0 | ||
| Valid votes | 665,913 | 99.52 | +0.24 | |||
| Invalid votes | 3,194 | 0.48 | –0.24 | |||
| Votes cast / turnout | 669,107 | 80.46 | +4.89 | |||
| Abstentions | 162,457 | 19.56 | –4.89 | |||
| Registered voters | 831,564 | |||||
| Source: Ministry of the Interior | ||||||
Galicia
.png)
| Party | Popular vote | Seats | ||||
|---|---|---|---|---|---|---|
| Votes | % | ±pp | Won | +/− | ||
| People's Party (PP) | 746,964 | 47.12 | +8.10 | 15 | +1 | |
| Socialists' Party of Galicia (PSdeG–PSOE) | 569,899 | 35.95 | +1.39 | 11 | –1 | |
| Galician Nationalist Bloc (BNG) | 126,965 | 8.01 | +4.42 | 0 | ±0 | |
| United Left–Galician Unity (EU–UG) | 74,605 | 4.71 | +1.43 | 0 | ±0 | |
| Democratic and Social Centre (CDS) | 24,279 | 1.53 | –6.27 | 0 | –1 | |
| Parties with less than 1.0% of the vote | 28,756 | 1.81 | — | 0 | ±0 | |
|---|---|---|---|---|---|---|
| The Greens (OV) | 5,466 | 0.34 | –0.10 | 0 | ±0 | |
| Galician Nationalist Convergence (CNG) | 4,663 | 0.29 | New | 0 | ±0 | |
| The Ecologists (LE) | 4,539 | 0.29 | –0.20 | 0 | ±0 | |
| Ruiz-Mateos Group–European Democratic Alliance (ARM–ADE) | 3,913 | 0.25 | –0.73 | 0 | ±0 | |
| Galician Alternative (AG) | 3,286 | 0.21 | New | 0 | ±0 | |
| Communist Party of the Galician People (PCPG) | 2,217 | 0.14 | ±0.00 | 0 | ±0 | |
| Workers' Socialist Party (PST) | 1,355 | 0.09 | –0.43 | 0 | ±0 | |
| New Socialist Party (NPS) | 930 | 0.06 | New | 0 | ±0 | |
| Humanist Party (PH) | 861 | 0.05 | –0.06 | 0 | ±0 | |
| El Bierzo Party (PB) | 799 | 0.05 | New | 0 | ±0 | |
| Natural Law Party (PLN) | 727 | 0.05 | New | 0 | ±0 | |
| Communist Unification of Spain (UCE) | 0 | 0.00 | New | 0 | ±0 | |
| Blank ballots | 13,762 | 0.87 | +0.02 | |||
| Total | 1,585,230 | 100.00 | 26 | –1 | ||
| Valid votes | 1,585,230 | 99.27 | +0.40 | |||
| Invalid votes | 11,626 | 0.73 | –0.40 | |||
| Votes cast / turnout | 1,596,856 | 69.64 | +9.51 | |||
| Abstentions | 696,141 | 30.36 | –9.51 | |||
| Registered voters | 2,292,997 | |||||
| Source: Ministry of the Interior | ||||||
La Rioja
| Party | Popular vote | Seats | ||||
|---|---|---|---|---|---|---|
| Votes | % | ±pp | Won | +/− | ||
| People's Party (PP) | 78,792 | 46.26 | +5.17 | 2 | ±0 | |
| Spanish Socialist Workers' Party (PSOE) | 64,037 | 37.60 | –2.10 | 2 | ±0 | |
| United Left–La Rioja (IU) | 11,850 | 6.96 | +0.54 | 0 | ±0 | |
| Riojan Party (PR) | 7,532 | 4.42 | New | 0 | ±0 | |
| Democratic and Social Centre (CDS) | 3,609 | 2.12 | –5.06 | 0 | ±0 | |
| Parties with less than 1.0% of the vote | 2,365 | 1.39 | — | 0 | ±0 | |
|---|---|---|---|---|---|---|
| The Greens (LV) | 996 | 0.58 | New | 0 | ±0 | |
| The Ecologists (LE) | 493 | 0.29 | –0.99 | 0 | ±0 | |
| Ruiz-Mateos Group–European Democratic Alliance (ARM–ADE) | 432 | 0.25 | –0.98 | 0 | ±0 | |
| Health and Ecology in Solidarity (SEES) | 142 | 0.08 | New | 0 | ±0 | |
| Natural Law Party (PLN) | 82 | 0.05 | New | 0 | ±0 | |
| New Socialist Party (NPS) | 76 | 0.04 | New | 0 | ±0 | |
| Spanish Democratic Republican Action (ARDE) | 73 | 0.04 | New | 0 | ±0 | |
| Humanist Party (PH) | 71 | 0.04 | New | 0 | ±0 | |
| Communist Unification of Spain (UCE) | 0 | 0.00 | New | 0 | ±0 | |
| Blank ballots | 2,125 | 1.25 | +0.05 | |||
| Total | 170,310 | 100.00 | 4 | ±0 | ||
| Valid votes | 170,310 | 99.44 | +0.33 | |||
| Invalid votes | 967 | 0.56 | –0.33 | |||
| Votes cast / turnout | 171,277 | 80.00 | +7.96 | |||
| Abstentions | 42,807 | 20.00 | –7.96 | |||
| Registered voters | 214,084 | |||||
| Source: Ministry of the Interior | ||||||
Madrid
.png)
| Party | Popular vote | Seats | ||||
|---|---|---|---|---|---|---|
| Votes | % | ±pp | Won | +/− | ||
| People's Party (PP) | 1,373,042 | 43.92 | +9.70 | 16 | +4 | |
| Spanish Socialist Workers' Party (PSOE) | 1,093,015 | 34.96 | +1.47 | 13 | +1 | |
| United Left (IU) | 455,685 | 14.58 | –0.84 | 5 | ±0 | |
| Democratic and Social Centre (CDS) | 93,347 | 2.99 | –8.00 | 0 | –4 | |
| The Greens (LV) | 33,295 | 1.07 | –0.07 | 0 | ±0 | |
| Parties with less than 1.0% of the vote | 47,212 | 1.51 | — | 0 | ±0 | |
|---|---|---|---|---|---|---|
| Ruiz-Mateos Group–European Democratic Alliance (ARM–ADE) | 13,782 | 0.44 | –0.51 | 0 | ±0 | |
| The Ecologists (LE) | 10,429 | 0.33 | –0.56 | 0 | ±0 | |
| Workers' Socialist Party (PST) | 4,808 | 0.15 | –0.16 | 0 | ±0 | |
| United Extremadura (EU) | 3,745 | 0.12 | New | 0 | ±0 | |
| Madrilenian Independent Regional Party (PRIM) | 1,917 | 0.06 | –0.07 | 0 | ±0 | |
| Spanish Falange of the JONS (FE–JONS) | 1,488 | 0.05 | –0.09 | 0 | ±0 | |
| Revolutionary Workers' Party (POR) | 1,391 | 0.04 | –0.03 | 0 | ±0 | |
| Independent Spanish Falange (FEI) | 1,212 | 0.04 | +0.01 | 0 | ±0 | |
| Natural Law Party (PLN) | 1,209 | 0.04 | New | 0 | ±0 | |
| Spanish Democratic Republican Action (ARDE) | 1,202 | 0.04 | ±0.00 | 0 | ±0 | |
| Gray Panthers of Spain (ACI) | 1,189 | 0.04 | New | 0 | ±0 | |
| Spanish Catholic Movement (MCE) | 1,178 | 0.04 | New | 0 | ±0 | |
| Humanist Party (PH) | 1,079 | 0.03 | –0.04 | 0 | ±0 | |
| Commoners' Land–Castilian Nationalist Party (TC–PNC) | 805 | 0.03 | New | 0 | ±0 | |
| Progressive Front of Spain (FPE) | 641 | 0.02 | New | 0 | ±0 | |
| Leonese People's Union (UPL) | 608 | 0.02 | New | 0 | ±0 | |
| New Socialist Party (NPS) | 529 | 0.02 | New | 0 | ±0 | |
| Communist Unification of Spain (UCE) | 0 | 0.00 | New | 0 | ±0 | |
| Centrist Unity–Democratic Spanish Party (PED) | 0 | 0.00 | –0.04 | 0 | ±0 | |
| Blank ballots | 30,554 | 0.98 | –0.04 | |||
| Total | 3,126,150 | 100.00 | 34 | +1 | ||
| Valid votes | 3,126,150 | 99.61 | +0.14 | |||
| Invalid votes | 12,361 | 0.39 | –0.14 | |||
| Votes cast / turnout | 3,138,511 | 78.92 | +6.20 | |||
| Abstentions | 838,551 | 21.08 | –6.20 | |||
| Registered voters | 3,977,062 | |||||
| Source: Ministry of the Interior | ||||||
Murcia
.png)
| Party | Popular vote | Seats | ||||
|---|---|---|---|---|---|---|
| Votes | % | ±pp | Won | +/− | ||
| People's Party (PP) | 310,507 | 47.29 | +17.31 | 4 | +1 | |
| Spanish Socialist Workers' Party (PSOE) | 253,324 | 38.59 | –7.47 | 4 | –1 | |
| United Left (IU) | 63,717 | 9.71 | +0.52 | 1 | +1 | |
| Democratic and Social Centre (CDS) | 14,442 | 2.20 | –8.16 | 0 | –1 | |
| Parties with less than 1.0% of the vote | 11,111 | 1.69 | — | 0 | ±0 | |
|---|---|---|---|---|---|---|
| The Greens (LV) | 5,085 | 0.77 | +0.12 | 0 | ±0 | |
| The Ecologists (LE) | 1,685 | 0.26 | –0.44 | 0 | ±0 | |
| Rainbow (Arcoiris) | 1,407 | 0.21 | New | 0 | ±0 | |
| Ruiz-Mateos Group (ARM) | 1,399 | 0.21 | –0.91 | 0 | ±0 | |
| Revolutionary Workers' Party (POR) | 686 | 0.10 | New | 0 | ±0 | |
| Humanist Party (PH) | 487 | 0.07 | –0.04 | 0 | ±0 | |
| Natural Law Party (PLN) | 362 | 0.06 | New | 0 | ±0 | |
| Communist Unification of Spain (UCE) | 0 | 0.00 | New | 0 | ±0 | |
| Blank ballots | 3,433 | 0.52 | +0.05 | |||
| Total | 656,534 | 100.00 | 9 | ±0 | ||
| Valid votes | 656,534 | 99.48 | +0.15 | |||
| Invalid votes | 3,418 | 0.52 | –0.15 | |||
| Votes cast / turnout | 659,952 | 81.56 | +7.31 | |||
| Abstentions | 149,234 | 18.44 | –7.31 | |||
| Registered voters | 809,186 | |||||
| Source: Ministry of the Interior | ||||||
Navarre
.png)
| Party | Popular vote | Seats | ||||
|---|---|---|---|---|---|---|
| Votes | % | ±pp | Won | +/− | ||
| Navarrese People's Union–People's Party (UPN–PP) | 112,228 | 36.13 | +2.95 | 3 | ±0 | |
| Spanish Socialist Workers' Party (PSOE)[lower-alpha 1] | 108,305 | 34.87 | +0.82 | 2 | ±0 | |
| Popular Unity (HB) | 32,221 | 10.37 | –0.65 | 0 | ±0 | |
| United Left (IU–EB) | 27,043 | 8.71 | +2.96 | 0 | ±0 | |
| Basque Solidarity–Basque Left (EA–EUE) | 11,437 | 3.68 | –1.12 | 0 | ±0 | |
| Democratic and Social Centre (CDS) | 5,241 | 1.69 | –5.34 | 0 | ±0 | |
| The Greens (B–LV) | 4,263 | 1.37 | New | 0 | ±0 | |
| Basque Nationalist Party (EAJ/PNV) | 3,540 | 1.14 | +0.22 | 0 | ±0 | |
| Parties with less than 1.0% of the vote | 1,852 | 0.60 | — | 0 | ±0 | |
|---|---|---|---|---|---|---|
| Ruiz-Mateos Group–European Democratic Alliance (ARM–ADE) | 903 | 0.29 | –0.38 | 0 | ±0 | |
| Natural Law Party (PLN) | 332 | 0.11 | New | 0 | ±0 | |
| Humanist Party (PH) | 244 | 0.08 | New | 0 | ±0 | |
| Revolutionary Workers' Party (POR) | 201 | 0.06 | –0.03 | 0 | ±0 | |
| New Socialist Party (NPS) | 172 | 0.06 | New | 0 | ±0 | |
| Communist Unification of Spain (UCE) | 0 | 0.00 | New | 0 | ±0 | |
| Blank ballots | 4,495 | 1.45 | +0.39 | |||
| Total | 310,625 | 100.00 | 5 | ±0 | ||
| Valid votes | 310,625 | 99.24 | +0.03 | |||
| Invalid votes | 2,374 | 0.76 | –0.03 | |||
| Votes cast / turnout | 312,999 | 73.58 | +5.04 | |||
| Abstentions | 112,388 | 26.42 | –5.04 | |||
| Registered voters | 425,387 | |||||
| Source: Ministry of the Interior | ||||||
Valencian Community
| Party | Popular vote | Seats | ||||
|---|---|---|---|---|---|---|
| Votes | % | ±pp | Won | +/− | ||
| People's Party (PP) | 987,317 | 40.48 | +13.48 | 15 | +6 | |
| Spanish Socialist Workers' Party (PSOE) | 935,325 | 38.35 | –3.11 | 12 | –4 | |
| United Left of the Valencian Country (EU–PV) | 256,929 | 10.53 | +1.46 | 3 | +1 | |
| Valencian Union (UV) | 112,341 | 4.61 | –2.23 | 1 | –1 | |
| Valencian People's Union (UPV) | 41,052 | 1.68 | –0.24 | 0 | ±0 | |
| Democratic and Social Centre (CDS) | 39,923 | 1.64 | –6.21 | 0 | –2 | |
| Parties with less than 1.0% of the vote | 51,881 | 2.13 | — | 0 | ±0 | |
|---|---|---|---|---|---|---|
| The Greens (LV) | 22,971 | 0.94 | –0.75 | 0 | ±0 | |
| The Ecologists (LE) | 7,167 | 0.29 | –0.44 | 0 | ±0 | |
| Ruiz-Mateos Group–European Democratic Alliance (ARM–ADE) | 5,792 | 0.24 | –0.79 | 0 | ±0 | |
| Spanish Democratic Republican Action (ARDE) | 1,636 | 0.07 | New | 0 | ±0 | |
| Workers' Socialist Party (PST) | 1,631 | 0.07 | –0.25 | 0 | ±0 | |
| Revolutionary Workers' Party (POR) | 1,604 | 0.07 | New | 0 | ±0 | |
| Spanish Falange of the JONS (FE–JONS) | 1,544 | 0.06 | –0.09 | 0 | ±0 | |
| Valencian Nationalist Left (ENV) | 1,517 | 0.06 | –0.04 | 0 | ±0 | |
| Alicantine Country's Greens (PVPA) | 1,375 | 0.06 | New | 0 | ±0 | |
| Cantonal Party (PCAN) | 1,300 | 0.05 | New | 0 | ±0 | |
| Communist Party of the Peoples of Spain (PCPE) | 1,148 | 0.05 | –0.14 | 0 | ±0 | |
| Natural Law Party (PLN) | 873 | 0.04 | New | 0 | ±0 | |
| Health and Ecology in Solidarity (Eco–Verde) | 821 | 0.03 | New | 0 | ±0 | |
| Humanist Party (PH) | 764 | 0.03 | –0.03 | 0 | ±0 | |
| New Socialist Party (NPS) | 729 | 0.03 | New | 0 | ±0 | |
| Alicantine Democratic Union (UNIDA) | 715 | 0.03 | –0.02 | 0 | ±0 | |
| Gray Panthers of Spain (ACI) | 294 | 0.01 | New | 0 | ±0 | |
| Communist Unification of Spain (UCE) | 0 | 0.00 | New | 0 | ±0 | |
| Blank ballots | 14,188 | 0.58 | +0.06 | |||
| Total | 2,438,956 | 100.00 | 31 | ±0 | ||
| Valid votes | 2,438,956 | 99.45 | +0.02 | |||
| Invalid votes | 13,465 | 0.55 | –0.02 | |||
| Votes cast / turnout | 2,452,421 | 81.71 | +6.91 | |||
| Abstentions | 548,978 | 18.29 | –6.91 | |||
| Registered voters | 3,001,399 | |||||
| Source: Ministry of the Interior | ||||||
Autonomous cities
Ceuta
| Party | Popular vote | Seats | ||||
|---|---|---|---|---|---|---|
| Votes | % | ±pp | Won | +/− | ||
| People's Party (PP) | 15,276 | 50.93 | +17.31 | 1 | +1 | |
| Spanish Socialist Workers' Party (PSOE) | 12,170 | 40.58 | +2.87 | 0 | –1 | |
| Socialist Party of the People of Ceuta (PSPC) | 1,155 | 3.85 | New | 0 | ±0 | |
| The Greens (LV) | 491 | 1.64 | –1.66 | 0 | ±0 | |
| Democratic and Social Centre (CDS) | 485 | 1.62 | –6.58 | 0 | ±0 | |
| Parties with less than 1.0% of the vote | 185 | 0.62 | — | 0 | ±0 | |
|---|---|---|---|---|---|---|
| Workers' Socialist Party (PST) | 100 | 0.33 | –0.32 | 0 | ±0 | |
| Natural Law Party (PLN) | 43 | 0.14 | New | 0 | ±0 | |
| Initiative for Ceuta (INCE) | 42 | 0.14 | New | 0 | ±0 | |
| Communist Unification of Spain (UCE) | 0 | 0.00 | New | 0 | ±0 | |
| Blank ballots | 231 | 0.77 | –0.41 | |||
| Total | 29,993 | 100.00 | 1 | ±0 | ||
| Valid votes | 29,993 | 99.50 | +0.42 | |||
| Invalid votes | 152 | 0.50 | –0.42 | |||
| Votes cast / turnout | 30,145 | 62.13 | +6.19 | |||
| Abstentions | 18,372 | 37.87 | –6.19 | |||
| Registered voters | 48,517 | |||||
| Source: Ministry of the Interior | ||||||
Melilla
| Party | Popular vote | Seats | ||||
|---|---|---|---|---|---|---|
| Votes | % | ±pp | Won | +/− | ||
| Spanish Socialist Workers' Party (PSOE) | 12,885 | 48.79 | +10.29 | 1 | +1 | |
| People's Party (PP) | 11,865 | 44.92 | –10.76 | 0 | –1 | |
| United Left (IU) | 687 | 2.60 | New | 0 | ±0 | |
| Democratic and Social Centre (CDS) | 569 | 2.15 | +0.35 | 0 | ±0 | |
| Natural Law Party (PLN) | 80 | 0.30 | New | 0 | ±0 | |
| Blank ballots | 325 | 1.23 | +0.33 | |||
| Total | 26,411 | 100.00 | 1 | ±0 | ||
| Valid votes | 26,411 | 99.57 | +0.28 | |||
| Invalid votes | 115 | 0.43 | –0.28 | |||
| Votes cast / turnout | 26,526 | 66.14 | +14.25 | |||
| Abstentions | 13,579 | 33.86 | –14.25 | |||
| Registered voters | 40,105 | |||||
| Source: Ministry of the Interior | ||||||
| General elections |
|
|---|---|
| European elections | |
| Local elections | |
| Regional elections | |
| Referendums | |
| |
This article is issued from Wikipedia - version of the 12/4/2016. The text is available under the Creative Commons Attribution/Share Alike but additional terms may apply for the media files.