2013 Atlantic hurricane season
 | |
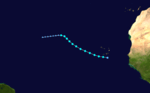
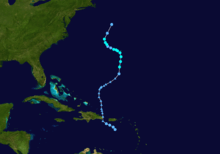
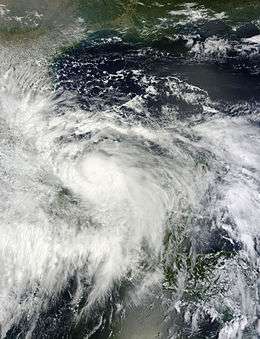
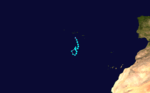
| Season summary map | |
| First system formed | June 5, 2013 |
|---|---|
| Last system dissipated | December 7, 2013 |
| Strongest storm1 | Humberto – 979 mbar (hPa) (28.91 inHg), 90 mph (150 km/h) |
| Total depressions | 15 |
| Total storms | 14 |
| Hurricanes | 2 |
| Major hurricanes (Cat. 3+) | 0 |
| Total fatalities | 47 total |
| Total damage | At least $1.51 billion (2013 USD) |
| 1Strongest storm is determined by lowest pressure | |
2011, 2012, 2013, 2014, 2015 | |
| Related article | |
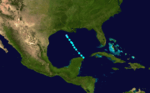
The 2013 Atlantic hurricane season was a below average Atlantic hurricane season and the first since 1994 with no major hurricanes,[nb 1] and the first since 1968 with no storms of at least Category 2 intensity on the Saffir–Simpson hurricane wind scale. The first tropical cyclone of this hurricane season, Andrea, developed on June 5, while the final cyclone, an unnamed subtropical storm, dissipated on December 7. Throughout the year, only two storms – Humberto and Ingrid – reached hurricane intensity; this was the lowest seasonal total since 1982.
The season's impact was minimal; although 15 tropical cyclones developed, most were weak or remained at sea. Tropical Storm Andrea killed four people after making landfall in Florida and moving up the East Coast of the United States. In early July, Tropical Storm Chantal moved through the Leeward Islands, causing one fatality, but minimal damage overall. Tropical storms Dorian and Erin and Hurricane Humberto brought only squally weather to the Cape Verde Islands. Mexico, where Hurricane Ingrid, Tropical Depression Eight, and tropical storms Barry and Fernand all made landfall, was the hardest hit; Ingrid alone caused at least 32 deaths and $1.5 billion (2013 USD) in damage.[nb 2] In early October, Karen brought showers and gusty winds to the central Gulf Coast of the United States.
All major forecasting agencies predicted an above-average season. All reduced their seasonal predictions in early August, but even the revised predictions were too high. The lack of activity was primarily caused by an unexpected significant weakening of the Atlantic Ocean thermohaline circulation between winter and spring. This resulted in continuation of the spring weather pattern over the Atlantic Ocean, with strong vertical wind shear, mid-level moisture, and atmospheric stability, which suppressed tropical cyclogenesis.
Seasonal forecasts
| Source | Date | Named storms |
Hurricanes | Major hurricanes |
Ref |
| Average (1981–2010) | 12.1 | 6.4 | 2.7 | [2] | |
| Record high activity | 28 | 15 | 8 | [3] | |
| Record low activity | 4 | 2† | 0† | [3] | |
| ––––––––––––––––––––––––––––––––––––––––––––––––––––––– | |||||
| TSR | December 5, 2012 | 15 | 8 | 3 | [4] |
| TSR | April 5, 2013 | 15 | 8 | 3 | [5] |
| WSI/TWC | April 8, 2013 | 16 | 9 | 5 | [6] |
| CSU | April 10, 2013 | 18 | 9 | 4 | [7] |
| NCSU | April 15, 2013 | 13–17 | 7–10 | 3–6 | [8] |
| UKMO | May 15, 2013 | 14* | 9* | N/A | [9] |
| NOAA | May 23, 2013 | 13–20 | 7–11 | 3–6 | [10] |
| FSU COAPS | May 30, 2013 | 12–17 | 5–10 | N/A | [11] |
| CSU | June 3, 2013 | 18 | 9 | 4 | [12] |
| TSR | June 4, 2013 | 16 | 8 | 4 | [13] |
| TSR | July 5, 2013 | 15 | 7 | 3 | [14] |
| CSU | August 2, 2013 | 18 | 8 | 3 | [15] |
| NOAA | August 8, 2013 | 13–19 | 6–9 | 3–5 | [16] |
| ––––––––––––––––––––––––––––––––––––––––––––––––––––––– | |||||
| Actual activity |
14 | 2 | 0 | ||
| * June–November only † Most recent of several such occurrences. (See all) | |||||
In advance of, and during, each hurricane season, several forecasts of hurricane activity are issued by national meteorological services, scientific agencies, and noted hurricane experts. These include forecasters from the United States National Oceanic and Atmospheric Administration (NOAA)'s National Hurricane and Climate Prediction Center, Tropical Storm Risk, the United Kingdom's Met Office, and Philip J. Klotzbach, William M. Gray and their associates at Colorado State University (CSU). The forecasts include weekly and monthly changes in significant factors that help determine the number of tropical storms, hurricanes, and major hurricanes within a particular year. According to NOAA and CSU, the average Atlantic hurricane season between 1981 and 2010 contained roughly 12 tropical storms, six hurricanes, three major hurricanes, and an accumulated cyclone energy (ACE) index of 66–103 units.[2][17] NOAA typically categorizes a season as either above-average, average, or below-average based on the cumulative ACE Index, but the number of tropical storms, hurricanes, and major hurricanes within a hurricane season are considered occasionally as well.[2]
Pre-season forecasts
Multiple agencies predicted above-average activity, citing forecasts for slower-than-average trade winds, warmer-than-normal sea surface temperatures,[4] abnormally low wind shear, and the unlikelihood of an El Niño developing prior to the peak of the season.[7] On December 5, 2012, Tropical Storm Risk (TSR), a public consortium consisting of experts on insurance, risk management, and seasonal climate forecasting at University College London, issued an extended-range forecast. In its report, the organization called for 15.4 (±4.3) named storms, 7.7 (±2.9) hurricanes, 3.4 (±1.6) major hurricanes, and a cumulative Accumulated Cyclone Energy (ACE) index of 134. While no value was placed on the number of expected landfalls during the season, TSR stated that the landfalling ACE index was expected to be above average.[4] Four months later, on April 5, Tropical Storm Risk issued its updated forecast, continuing to call for an above-average season with 15.2 (±4.1) named storms, 7.5 (±2.8) hurricanes, 3.4 (±1.6) major hurricanes, and an ACE index of 131; the landfalling ACE index was once again forecast to be higher than normal.[5]
Meanwhile, on April 8, Weather Services International (WSI) issued its first forecast for the hurricane season. In its report, the organization forecast 16 named storms, nine hurricanes, and five major hurricanes.[6] On April 10, Colorado State University (CSU) issued its first forecast for the season, calling for a potentially hyperactive season with 18 named storms, nine hurricanes, four major hurricanes, and an ACE index of 165. The probabilities of a major hurricane hitting the Gulf Coast and East Coast were well above average.[7] On May 15, the United Kingdom Met Office (UKMO) predicted 14 named storms, with a 70% chance that the number would be between 10 and 18, and nine hurricanes with a 70% chance that the number would be between 4 and 14. It also predicted an ACE index of 130 with a 70% chance that the index would be in the range 76 to 184.[9] On May 23, 2013, NOAA issued its first seasonal outlook for the year, stating there was a 70% likelihood of 13 to 20 named storms, of which seven to eleven could become hurricanes, including three to six major hurricanes; these ranges are greater than the seasonal average of twelve named storms, six hurricanes and three major hurricanes.[10] On May 30, the Florida State University Center for Ocean-Atmospheric Prediction Studies, FSU COAPS, issued its first and only prediction for the season. The organization called for 12 to 17 named storms, of which five to ten would further intensify into hurricanes; no forecast was given for the number of major hurricanes. In addition, an ACE index of 135 units was forecast.[11]
Mid-season outlooks
In June, predictions from CSU and TSR were similar to pre-season forecasts due to the a lack of an El Niño and warmer-than-average sea surface temperatures across the Atlantic Ocean.[12][13] However, by July and August, CSU and TSR all adjusted their forecasts downward because of predictions of cooler-than-average sea surface temperatures and above-average wind shear.[14][15] NOAA also decreased the amount of activity in its final outlook, despite predicting a wetter-than-average western Africa and above-average sea surface temperatures in its report.[16] On June 3, CSU issued its first mid-season prediction for the remainder of the year. In its report, the organization continued to predict well above-average activity, with eighteen named storms, nine hurricanes, four major hurricanes, and an ACE index of 165 units. CSU stated that there was a 72% chance of at least one major hurricane impacting any stretch of the United States coastline; the chances of a major hurricane hitting the East Coast and Gulf Coast were 48% and 47%, respectively.[12] The following day, Tropical Storm Risk issued its third forecast for the 2013 Atlantic hurricane season, calling for sixteen named storms, eight hurricanes, four major hurricanes, and an ACE of 134 units; this activity was predicted to be roughly 30% above the 1950–2012 long-term mean. TSR gave a 65% probability that the landfalling ACE index would be above-average.[13] A month later, TSR lowered its numbers to 15 named storms, seven hurricanes, and three major hurricanes.[14] On August 2, Colorado State University issued another update for the season, lowering its numbers slightly. However, the organization continued to state that there was an above-average probability of a United States and Caribbean major hurricane landfall.[15] Finally, on August 8, NOAA issued its second and final outlook for the season, predicting 13 to 19 named storms, six to nine hurricanes, and three to five major hurricanes; these numbers were down slightly from its May outlook.[16]
Post-season review
With 13 tropical storms, two hurricanes, and no major hurricanes,[18] activity fell far below the predictions. Brian McNoldy at the University of Miami noted several reasons why NOAA should not cease seasonal predictions, including the variability of hurricane seasons and the value of supplementing climatology with seasonal forecasts. Further, McNoldy argued that forecasting a hurricane season "challenges us to better understand how the atmosphere works."[19] On November 29, Dr. Phil Klotzbach of CSU noted that "[Dr. Gray and I] have been doing these forecasts for 30 years and that's probably the biggest forecast bust that we've had."[20] The program, which had already lost contributions from an insurance company in June, was defunded further following the botched season forecasts.[21] However, Gray and Klotzbach were able to issue predictions for the 2014 season.[22]
Seasonal summary
The Atlantic hurricane season officially began on June 1, 2013.[11] It was a below average season in which 14 tropical cyclones and one subtropical cyclone formed. Thirteen of the fifteen designated cyclones attained tropical storm status.[18] However, only two of those became hurricanes, the fewest since 1982. Thus, this was a mainly quiet season. None intensified into major hurricanes, for the first time since 1994. By default, 2013 extended the period without major hurricane landfalls in the United States to eight years, with the last such system being Hurricane Wilma in 2005. Further, no hurricane exceeded Category 1 intensity, for the first time since 1968. Throughout the season, NOAA and the United States Air Force Reserve flew a total of 45 reconnaissance missions over the Atlantic basin, totaling 435 hours; this was the lowest number of flight hours since at least 1966.[23] One hurricane and three tropical storms made landfall during the season and caused 47 deaths and about $1.51 billion in damage.[24] Tropical Storm Chantal also caused losses and fatalities, though it did not strike land.[25] The last storm of the season dissipated on December 7,[18] a week after the official end of hurricane season on November 30, 2013.[11]
Activity was primarily suppressed by significant weakening of the Atlantic Ocean thermohaline circulation (THC) early in the year, representing the largest reduction in strength of the THC since NCEP/NCAR Reanalysis began. The weakening of the THC was possibly the result of lowered ocean salinity and a decrease in North Atlantic Deep Water formation. Oceanic and atmospheric gyres were able to strengthen in the subtropical Atlantic, allowing southward advection of cold air and water. Consequently, there was a significant cooling of sea surface temperatures over portions of the north Atlantic. This resulted in a continuation of the spring weather pattern over the Atlantic Ocean, with strong vertical wind shear, mid-level moisture, and atmospheric stability. The weak THC resulted in slightly stronger low-level trade winds, an increase in upper-level zonal winds and vertical wind shear, higher environmental air pressures and less low-level mass wind convergence and rainfall in the Intertropical Convergence Zone, and reduced middle-level moisture. Collectively, these factors worked to suppress tropical cyclogenesis.[26]
Tropical cyclogenesis began in early June, with the development of Tropical Storm Andrea in the Gulf of Mexico on June 5. Twelve days later, Tropical Storm Barry formed in the northwestward Caribbean Sea. Two named storms originated in the month of July – tropical storms Chantal and Dorian. Similarly, there were two tropical storms in August, Erin and Fernand. In September, four tropical cyclones formed, three of which strengthened into tropical storms; two of those reached hurricane status. The most intense tropical cyclone – Hurricane Humberto – peaked with maximum sustained winds of 90 mph (150 km/h) on September 11, which is a Category 1 on the Saffir–Simpson hurricane wind scale.[18] The other hurricane, Ingrid, was the most devastating storm of the season and peaked at slightly less intensity.[23] Activity began to slow in October, with the development of only two tropical storms, Karen and Lorenzo. Tropical cyclogenesis then halted for almost a month, until Tropical Storm Melissa formed over the eastern Atlantic Ocean on November 18. This was the only tropical cyclone in the month of November. The final system was an unnamed subtropical storm that developed south of the Azores on December 5. After meandering for two days, it degenerated into a remnant low-pressure area on December 7.[18]
Accumulated cyclone energy (ACE)
The season's activity was reflected with an accumulated cyclone energy (ACE) rating of 36,[27] which was well below the 1981–2010 median of 92,[22] and the lowest value since 1994. Broadly speaking, ACE is a measure of the power of a tropical or subtropical storm multiplied by the length of time it existed. Therefore, a storm with a longer duration, such as Humberto, will have high values of ACE. It is only calculated for full advisories on specific tropical and subtropical systems reaching or exceeding wind speeds of 39 mph (63 km/h). Accordingly, tropical depressions are not included here. After the storm has dissipated, typically after the end of the season, the NHC reexamines the data, and produces a final report on each storm. These revisions can lead to a revised ACE total either upward or downward compared to the operational value.[27]
Storms
Tropical Storm Andrea
| Tropical storm (SSHWS) | |||
|---|---|---|---|
| |||
| Duration | June 5 – June 7 | ||
| Peak intensity | 65 mph (100 km/h) (1-min) 992 mbar (hPa) | ||


An area of low pressure in the eastern Gulf of Mexico developed into Tropical Storm Andrea on June 5. Despite strong wind shear and an abundance of dry air, the storm strengthened while initially heading north-northeastward, before turning northeastward later that day. Andrea intensified and peaked as a strong tropical storm with winds at 65 mph (100 km/h) on June 6. A few hours later, the storm weakened slightly and made landfall near Steinhatchee, Florida. It began losing tropical characteristics while tracking across Florida and Georgia. Andrea transitioned into an extratropical cyclone over South Carolina on June 7, though the remnants continued to move along the East Coast of the United States until being absorbed by another extratropical system off Maine on June 10.[28]
The precursor to Andrea dropped nearly 12 in (300 mm) of rainfall on the Yucatán Peninsula. In Cuba, the storm brought flooding, with over 1,000 people fleeing their homes, mainly along the Cuyaguateje River in Pinar del Río Province.[29] In the area, five tornadoes were spawned,[28] one of which damaged three homes.[29] In Florida, the storm brought heavy rainfall to some areas, causing localized flooding. There were 10 tornadoes,[28] the worst of which touched down in The Acreage. The twister downed power lines and trees, causing significant roof damage to several houses; there was also one injury.[30] A surfer went missing in South Carolina and was presumed to have drowned.[28] The remnants of Andrea spawned one tornado in North Carolina, though damage was minor. Additionally, flooding was reported in some areas of the Northeastern United States.[30] Three fatalities occurred due to weather-related traffic accidents in Virginia and New Jersey.[28] The remnants of Andrea brought gusty winds to Atlantic Canada, causing thousands of power outages in Nova Scotia and New Brunswick.[31]
Tropical Storm Barry
| Tropical storm (SSHWS) | |||
|---|---|---|---|
| |||
| Duration | June 17 – June 20 | ||
| Peak intensity | 45 mph (75 km/h) (1-min) 1003 mbar (hPa) | ||
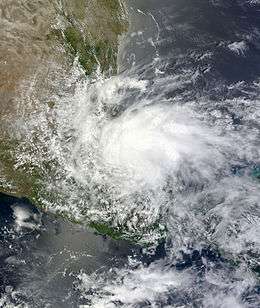
A tropical wave emerged into the Atlantic Ocean from the west coast of Africa on June 8. The system moved westward and an area of low pressure developed over the southwestern Caribbean Sea on June 16. The low then moved across Honduras,[32] where heavy rainfall triggered flooding that damaged 60 homes and affected 300 people.[33] The low later re-emerged into the Caribbean Sea and developed into a tropical depression at 12:00 UTC on June 17, while situated 60 mi (95 km) east of Monkey River Town. About 10 hours later, it made landfall near Big Creek, Belize.[32] In that country, an estimated 10 in (250 mm) of rain fell in 24 hours, causing several rivers to overflow their banks. In some areas, culverts were washed away. At least 54 people living along Hope Creek were relocated to shelters.[34] In El Salvador, flooding and lightning caused one fatality each.[32]
Despite decreasing wind speeds as the storm crossed land, the circulation became better-defined. Early on June 19, the depression emerged into the Bay of Campeche and began strengthening due to warm sea surface temperatures. Around 12:00 UTC, the depression intensified into Tropical Storm Barry. After about 12 hours, Barry attained its peak intensity with maximum sustained winds of 45 mph (75 km/h) and a minimum barometric pressure of 1,003 mbar (29.6 inHg). At 11:15 UTC on June 20, Barry made landfall near Veracruz at the same intensity. The storm rapidly weakened and degenerated into a remnant low early on June 21.[32] In the Mexican state of Yucatán, wind gusts up to 48 mph (77 km/h) and heavy rains downed trees and power lines.[35] More than 26,000 residents temporarily lost power after lightning struck a nearby power station, leading to a fire.[36] Four deaths were reported in Mexico due to drowning.[32]
Tropical Storm Chantal
| Tropical storm (SSHWS) | |||
|---|---|---|---|
| |||
| Duration | July 7 – July 10 | ||
| Peak intensity | 65 mph (100 km/h) (1-min) 1003 mbar (hPa) | ||

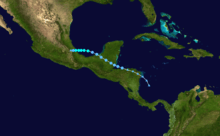
A large tropical wave emerged into the Atlantic Ocean from the west coast of Africa on July 4. The system moved rapidly westward under the influence of a subtropical ridge. Scatterometer passes indicating a closed circulation confirmed that Tropical Storm Chantal had developed by 12:00 UTC on July 7, while located about 1,250 mi (2,010 km) east-southeast of Barbados. Chantal continued to move swiftly west-northwestward and was one of the fastest moving tropical cyclones in the deep tropics during the satellite era. While approaching the Lesser Antilles, it became disorganized due to wind shear, but at 12:00 UTC on July 9, Chantal peaked with sustained winds of 65 mph (100 km/h). Shortly thereafter, it crossed through the Lesser Antilles and continued weakening in the Caribbean Sea. By late on July 10, Chantal diminished into a tropical wave while located south of Hispaniola.[37]
The storm brought heavy rainfall to the Lesser Antilles. In Dominica, several mudslides were reported. Wind gusts up to 48 mph (77 km/h) were observed on the island, de-roofing houses and causing power outages.[37] Strong winds were reported on Martinique, with gusts up to 76 mph (122 km/h) observed in Fort-de-France. Trees were knocked onto roads and power lines, leaving about 33,000 homes without electricity.[38] Elsewhere, damage reported in the Lesser Antilles was minimal, and there were no casualties.[37] Although sustained winds in Puerto Rico remained below tropical storm force, a weather station at Las Mareas in Guayama observed a wind gust of 51 mph (82 km/h) late on July 9. Winds toppled trees and power lines, blocking several roads. In Hispaniola, heavy rains caused flooding over portions of the island, but the fast-moving nature of the system precluded a more severe flooding event.[39] In the Dominican Republic, a firefighter from the community of Maimon was killed as he was swept away by flood waters while attempting to clear a clogged storm drain.[37] Chantal's remnant moisture interacted with a surface boundary over northeastern Florida, contributing to widespread thunderstorms that produced locally heavy rainfall and gusty winds.[40] Overall, the storm caused less than $10 million in damage.[25]
Tropical Storm Dorian
| Tropical storm (SSHWS) | |||
|---|---|---|---|
| |||
| Duration | July 23 – August 3 | ||
| Peak intensity | 60 mph (95 km/h) (1-min) 1002 mbar (hPa) | ||


Early on July 22, a tropical wave and associated low-pressure area emerged off the western coast of Africa. Based on satellite data,[41] the wave was upgraded to a tropical depression at 18:00 UTC on July 23 while located about 175 mi (280 km) south of the Cape Verde Islands, and further intensified into Tropical Storm Dorian by 06:00 UTC the following day. The storm tracked swiftly west-northwest over warm ocean temperatures and within an environment of low wind shear initially, allowing it to attain peak winds of 60 mph (95 km/h) by July 25. However, the entrainment of drier mid-level air and cooler ocean waters caused a weakening trend.[42]
Late July 27, a closed low-level circulation ceased to exist and Dorian degenerated into an open trough. The remnants continued west-northwest until August 1, at which time the disturbance reached the western extend of a ridge and curved northward. Despite continued unfavorable wind shear, a broad area of low pressure formed off the east coast of Florida and became increasingly better defined. The convection gained enough organization for the system to be re-designated as a tropical depression by 18:00 UTC on August 2. However, strong northerly winds caused the depression to deteriorate into a remnant low about 24 hours later, southeast of Charleston, South Carolina. On August 4, the remnant low was absorbed into a trough off North Carolina.[42]
Tropical Storm Erin
| Tropical storm (SSHWS) | |||
|---|---|---|---|
| |||
| Duration | August 15 – August 18 | ||
| Peak intensity | 45 mph (75 km/h) (1-min) 1006 mbar (hPa) | ||

A tropical wave, accompanied by a misshapen center of surface low pressure and a large area of disorganized showers and thunderstorms, emerged from the west coast of Africa on August 15. The wave moved west-northwestward along the southern periphery of a ridge to its north. The system quickly organized and its circulation became more defined, warranting its classification as a tropical depression early on August 15. At the time, the depression was situated about 70 mi (110 km) south of Praia, Cape Verde, prompting the issuance of tropical storm warnings for the southernmost islands. Deep convection continued to develop over the center and the depression intensified into Tropical Storm Erin six hours after its initial designation. However, dry air quickly became entrained into the circulation and convection waned.[43]
Operationally (in real-time), Erin was briefly downgraded to a tropical depression on August 16, though post-storm analysis indicated it retained tropical storm intensity that day. Early on August 17, the ship British Cygnet measured 44 mph (71 km/h) winds in relation to the cyclone; around this time, it was estimated that Erin attained its peak intensity with sustained winds of 45 mph (75 km/h) and a barometric pressure of 1,006 mbar (hPa; 29.71 inHg). A temporary northwesterly turn occurred around this time as the storm moved through a weakness in the ridge. Later on August 17, increasing wind shear took its toll on Erin and convection became displaced from the center. The following day, Erin degenerated into a remnant low about halfway between the Lesser Antilles and the west coast of Africa. The remnants proceeded westward on the low-level trade winds before opening up into a trough early on August 20, and ultimately dissipated several days later.[43]
Tropical Storm Fernand
| Tropical storm (SSHWS) | |||
|---|---|---|---|
| |||
| Duration | August 25 – August 26 | ||
| Peak intensity | 60 mph (95 km/h) (1-min) 1001 mbar (hPa) | ||
On August 10, a tropical wave emerged into the Atlantic Ocean from the west coast of Africa. Another tropical wave, which spawned Tropical Storm Erin, emerged into the Atlantic on August 13. The waves moved westward and merged into a single area of disturbed weather east of the Lesser Antilles. Further development did not occur until it crossed the Caribbean Sea and reached the Bay of Campeche on August 25. A tropical depression formed around 12:00 UTC that day, about 40 mi (64 km) north-northeast of Coatzacoalcos, Veracruz. Six hours later, the depression deepened into Tropical Storm Fernand. Early on August 26, Fernand peaked with sustained winds of 60 mph (95 km/h). At 04:45 UTC, the storm made landfall near Zempoala, Veracruz, at the same intensity. Fernand weakened to a tropical depression later on August 26, hours before dissipating.[44]
On August 25, a tropical storm warning was posted for the Gulf Coast of Mexico from Veracruz northward to Tampico. Warnings were canceled north of Barra de Nautla, Veracruz early on August 26, and discontinued entirely after Fernand weakened to a tropical depression.[44] The Mexican Navy helped people in Veracruz evacuate their homes efficiently. Classes at all levels of education in the state were closed during the storm's passage.[45] Impact from the storm in Mexico was most severe in Veracruz, where 13 people were killed by landslides: nine in Yecuatla, three in Tuxpan, and one in Atzalán.[46] In the city of Veracruz, heavy rainfall flooded roads, while downed trees caused power outages.[47] In Boca del Río, flooding stranded people at a shopping plaza. Damage was reported in 19 municipalities, mostly in northern and central Veracruz.[45] The storm damaged 457 homes and caused 4 rivers to overflow. In Oaxaca, a man died after being swept away by a swollen river. After the storm, Veracruz governor Javier Duarte declared a state of emergency for 92 municipalities, which allowed farmers who sustained damage to receive aid.[48]
Tropical Storm Gabrielle
| Tropical storm (SSHWS) | |||
|---|---|---|---|
| |||
| Duration | September 4 – September 13 | ||
| Peak intensity | 65 mph (100 km/h) (1-min) 1003 mbar (hPa) | ||
In late August, a tropical wave accompanied by a broad area of low pressure exited the west coast of Africa. While the wave was south of Puerto Rico, another tropical wave reached the system and enhanced deep convection. Late on September 4, a tropical depression developed about 115 mi (185 km) south-southeast of Puerto Rico.[49] Operationally, the depression was upgraded to Tropical Storm Gabrielle early on September 5.[50] However, in post-analysis, it was determined that Gabrielle was never a tropical storm in the Caribbean. The depression moved west-northwestward and lost its closed circulation near the eastern tip of Hispaniola late on September 5.[49] During a 48-hour period, the disturbance brought 6 to 8 in (150 to 200 mm) of rain to some areas of Puerto Rico.[51] A mudslide detached part of a small bridge on Highway 184. On Saint Croix, minor street flooding was reported, and several trees were downed.[52]
The remnant system was monitored for regeneration.[53] By September 9, wind shear began decreasing and the system re-developed into a tropical depression early on September 10. Six hours later, the depression moved northward and strengthened into Tropical Storm Gabrielle. By 12:00 UTC on September 10, it peaked with maximum sustained winds of 65 mph (100 km/h) and a minimum barometric pressure of 1,003 mbar (29.6 inHg). The storm passed about 25 mi (40 km) east of Hamilton, Bermuda early on September 11. Strong winds on the island downed trees branches, caused minor infrastructural damage, and left minor power outages. After marked oscillations in intensity on September 12, Gabrielle finally succumbed to wind shear midway between Bermuda and Cape Cod.[49]
Tropical Depression Eight
| Tropical depression (SSHWS) | |||
|---|---|---|---|
| |||
| Duration | September 6 – September 7 | ||
| Peak intensity | 35 mph (55 km/h) (1-min) 1008 mbar (hPa) | ||
The eighth tropical depression of the season originated from a tropical wave that crossed the western coast of Africa on August 23. Tracking westward, the wave reached the Caribbean Sea and became increasingly ill-defined while in the central Caribbean. An increase in convection was observed on September 1 and the subsequent day as the wave entered the western Caribbean. After moving into the Bay of Campeche, a broad low-pressure area formed in association with the system on September 5. An increase in deep convection on September 6 led to the formation of a tropical depression by 12:00 UTC, located approximately 30 mi (50 km) east-northeast of Tampico, Mexico. The cyclone then moved west-southwest under the influence of an anticyclone.[54]
Around 18:00 UTC on September 6, the depression made landfall near Tampico. Once inland, the depression quickly diminished to a remnant low by 06:00 UTC on September 7. It dissipated six hours later.[54] Heavy rains across Tamaulipas and Veracruz triggered flooding in areas that had been affected by Tropical Storm Fernand just two weeks prior. The most significant effects were in Veracruz where hundreds of homes were inundated.[55] Record-breaking rains in Mexico City, falling at rates of 3.3 in (84 mm) per hour, caused significant flooding. Many streets were inundated, paralyzing traffic and prompting water rescues. An estimated 20,000 homes were damaged by the floods and officials opened four shelters in the area.[56]
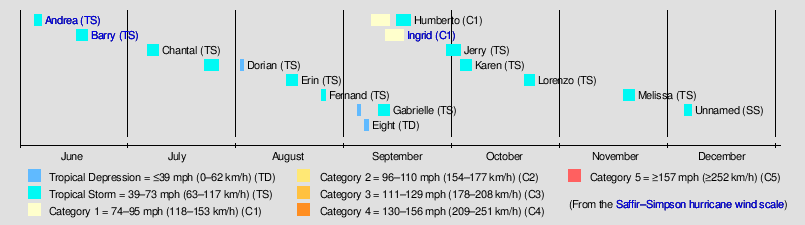
Hurricane Humberto
| Category 1 hurricane (SSHWS) | |||
|---|---|---|---|
| |||
| Duration | September 8 – September 19 | ||
| Peak intensity | 90 mph (150 km/h) (1-min) 979 mbar (hPa) | ||
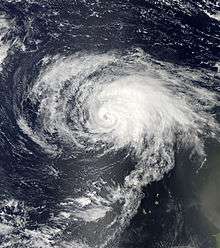

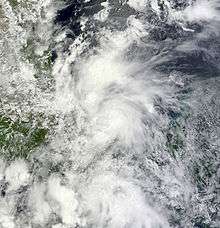
A tropical wave exited the west coast of Africa on September 7 and spawned a low pressure area by the following day. At 18:00 UTC on September 8, a tropical depression developed about 225 mi (360 km) west-southwest of Dakar, Senegal. The depression moved steadily westward and intensified into Tropical Storm Humberto early on September 9. Despite moderate wind shear, Humberto continued to strengthen while passing south of Cape Verde, due to a moist atmosphere and warm ocean temperatures.[57] The storm brought squalls to Cape Verde. The southwestern islands experienced wind gusts exceeding 35 mph (55 km/h) which downed several trees. Heavy rains in many areas triggered flooding that washed out roads and damaged homes. Offshore, the freighter Rotterdam went missing with a crew of six amid 10 to 16 ft (3 to 5 m) swells.[58] The vessel eventually reached São Tomé and Príncipe, though that country's port institute and coast guard denied her entrance.[59] Later on September 10, the storm's deepening briefly halted as it curved northwest in response to a developing mid-level trough over the central Atlantic.[57]
At 12:00 UTC on September 11, Humberto reached hurricane status while turning northward. About six hours later, it peaked with sustained winds of 90 mph (150 km/h). By late on September 12, increasing wind shear, cooling sea surface temperatures, and a more stable atmosphere led to a weakening trend of the storm. Around 12:00 UTC on the next day, Humberto fell to tropical storm intensity, while curving west-northwestward in the low-level flow south of the Azores surface high pressure. Early on September 14, the storm degenerated into a remnant low. However, deep convection began re-developing later that day. At 00:00 UTC on September 15, Humberto regenerated into a tropical storm about 1,095 mi (1,760 km) southwest of Ponta Delgada, Azores. An approaching mid- to upper-level cyclone began to capture Humberto, causing the storm to decelerate between late on September 16 and early on September 17. When Humberto's low-level circulation became vertically stacked under the non-tropical cyclone, the system transitioned into a subtropical storm on September 17. Humberto then weakened to a subtropical depression early the next day, about 1,120 mi (1,800 km) south of Ponta Delgada. The subtropical depression continued north-northwestward until degenerating into an open trough, and was soon absorbed by a cold front.[57]
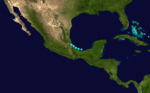
Hurricane Ingrid
| Category 1 hurricane (SSHWS) | |||
|---|---|---|---|
| |||
| Duration | September 12 – September 17 | ||
| Peak intensity | 85 mph (140 km/h) (1-min) 983 mbar (hPa) | ||

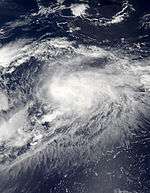
A tropical wave spawned an area of low pressure in the Bay of Campeche early on September 12. Several hours later, it matured into a tropical depression about 170 mi (280 km) east-southeast of the city of Veracruz. Initially, the depression moved slowly due to weak steering currents. Around midday on September 13, the depression strengthened into Tropical Storm Ingrid. After initially moving westward toward Veracruz, the storm turned northeastward away from the coast. Favorable conditions allowed it to attain hurricane status on September 14, and the next day Ingrid attained peak winds of 85 mph (140 km/h). Subsequently, heightened wind shear eroded the storm's convection. Caught between a trough over eastern Mexico and a ridge over the Southeastern United States, the storm turned sharply northwestward and later to the west. On September 16, Ingrid made landfall just south of La Pesca, Tamaulipas in northeastern Mexico as a strong tropical storm. Early on September 17, the storm weakened to a tropical depression, shortly before degenerating into an area of low pressure.[60]
Ingrid struck shortly after Hurricane Manuel on Mexico's Pacific coast, creating the first instance of two landfalling tropical cyclones in the nation within the same 24-hour period since 1958.[61] The combined impacts of hurricanes Ingrid and Manuel affected two-thirds of Mexico, killing 192 people and causing $75 billion pesos (MXN, $5.7 billion USD) in damage.[62] Most of the destruction has been attributed to Manuel, but Ingrid was directly responsible for at least 23 deaths and $20 billion pesos (MXN, $1.5 billion USD) in losses.[60][62] The two storms produced approximately 5.7 trillion cu ft (160 billion m3) of rainwater, equivalent to the combined volume of every reservoir in Mexico.[63] Rainfall from the storm peaked at 20.1 inches (511 mm) in Tuxpan, Veracruz.[60] The rains caused widespread flooding that damaged at least 14,000 houses and hundreds of roads and bridges.[61] In Tamaulipas, where the storm made landfall, the rainfall damaged crops and flooded rivers.[64] The effects of the storm spread into southern Texas, causing high tides and some flooding.[60] After Ingrid's onslaught, the Mexican government declared states of emergency in several municipalities.[61] Relief agencies distributed food and other aid to the hardest hit areas,[65][66] though in Tamaulipas, residents had to rely on assistance from the local Gulf Cartel.[67]
Tropical Storm Jerry
| Tropical storm (SSHWS) | |||
|---|---|---|---|
| |||
| Duration | September 29 – October 3 | ||
| Peak intensity | 50 mph (85 km/h) (1-min) 1005 mbar (hPa) | ||

A tropical wave exited the west coast of Africa on September 24. Interaction with a mid- to upper-level low pressure forced the wave to split, with the southern portion spawning Tropical Storm Octave in the eastern Pacific Ocean on October 12. As evidenced by scatterometer wind data, the northern portion moved north-northwestward and transitioned into a low pressure area early on September 28. After convection gradually became better organized, a tropical depression developed early on September 29, about 910 mi (1,460 km) east-northeast of the Leeward Islands. The depression moved northeastward and initially struggled to intensify due to the presence of dry mid-level air.[68]
However, early on September 30, the depression strengthened into Tropical Storm Jerry while curving eastward. Shortly thereafter, vigorous deep convection developed, allowing the storm to deepen further. At 00:00 UTC on October 1, Jerry attained its peak intensity with sustained winds of 50 mph (85 km/h) and a minimum barometric pressure of 1,005 mbar (29.7 inHg). However, strong wind shear soon weakened Jerry. Later on October 1, a blocking high pressure ridge briefly impeded the storm's northeastward motion, but it resumed moving in that direction by the following day. After losing all deep convection late on October 3, Jerry became extratropical at about 770 mi (1,240 km) southwest of the central Azores. The remnants persisted for a few days, until being absorbed by a larger extratropical low on October 6.[68]
Tropical Storm Karen
| Tropical storm (SSHWS) | |||
|---|---|---|---|
| |||
| Duration | October 3 – October 6 | ||
| Peak intensity | 65 mph (100 km/h) (1-min) 998 mbar (hPa) | ||

On September 16, a tropical wave emerged into the Atlantic from the west coast of Africa. Minimal tropical cyclogenesis occurred until the wave reached the western Caribbean Sea on September 27. Around that time, the wave encountered an upper-level trough, generating deep convection over the region. On September 28, a broad area of low pressure formed southeast of Jamaica. Based on surface observations, it is estimated that Tropical Storm Karen developed near the northeastern tip of the Yucatán Peninsula early on October 3. Despite a deteriorating cloud pattern, Karen deepened and peaked with winds of 65 mph (100 km/h) later that day. Wind shear and dry air caused the storm to weaken beginning early on October 4. Throughout the day, only sporadic bursts of deep convection occurred. The storm moved northwestward at inconsistent forward speeds around a low- to mid-level ridge. Early on October 6, Karen weakened to a tropical depression, and several hours later disintegrated into an open trough off the coast of Louisiana,[69] and was further absorbed into a much larger storm complex that was producing blizzard conditions and a tornado outbreak at the time.
Since the beginning of reconnaissance flights in 1943, Karen was one of few named storms to dissipate in the Gulf of Mexico without making landfall. While the storm was threatening the Gulf Coast of the United States, the NHC issued several tropical cyclone warnings and watches as Karen approached.[69] Additionally, states of emergency were issued in portions of Alabama, Louisiana, Mississippi, and Florida.[70] The mayor of the town of Grand Isle, Louisiana evacuated the island on October 4, while residents were also ordered to flee Lafourche and Plaquemines parishes.[71] The Federal Emergency Management Agency (FEMA) and the United States Department of the Interior called back workers, furloughed because of the government shutdown, to assist state and local agencies.[72] Louisiana Governor Bobby Jindal authorized the mobilization of the state's National Guard members to active duty.[73]
Abnormally high tides were reported along the coast of Louisiana. At Grand Isle, tar balls from the Deepwater Horizon oil spill in 2010 were washed ashore.[74] In Texas, the storm brought minor coastal flooding to Brazoria County. Additionally, the moisture associated with the remnants of Karen was absorbed into a frontal system and caused minor flooding in a few states, including Delaware, Georgia, New Jersey, and Pennsylvania.[75]
Tropical Storm Lorenzo
| Tropical storm (SSHWS) | |||
|---|---|---|---|
| |||
| Duration | October 21 – October 24 | ||
| Peak intensity | 50 mph (85 km/h) (1-min) 1000 mbar (hPa) | ||


A tropical wave exited the west coast of Africa and entered the Atlantic on October 11. Four days later, a mid- to upper-level trough increased convection along the northern portion of the wave. The southern portion of the wave continued westward, while the northern portion moved slowly west-northwestward and developed into a surface trough. Eventually, the system transitioned into a broad surface low. Despite southwesterly vertical shear, deep convection began to increase by late on October 20. After becoming better defined, the system developed into a tropical depression at 06:00 UTC on October 21 while located about 620 mi (1,000 km) east-southeast of Bermuda. Six hours later, the depression strengthened into Tropical Storm Lorenzo.[76]
On October 21, the storm moved north-northeastward around the northwestern periphery of a mid-level ridge. Lorenzo strengthened further and peaked with sustained winds of 50 mph (85 km/h) and a minimum barometric pressure of 1,000 mbar (30 inHg) at 12:00 UTC on October 22. Around that time, satellite imagery indicated increased banding and an eye-like feature. The cyclone then turned eastward in weak westerly low- to mid-level flow. Early on October 23, strong wind shear began impacting Lorenzo, causing the circulation to become exposed to deep convection. At 00:00 UTC on the following day, Lorenzo weakened to a tropical depression and dissipated into a remnant low 12 hours later. The low persisted for a few days, until it degenerated into an open trough on October 26.[76] The remnants of Lorenzo fueled the St. Jude storm, which struck northern Europe with hurricane-force winds on October 27 and October 28.[77]
Tropical Storm Melissa
| Tropical storm (SSHWS) | |||
|---|---|---|---|
| |||
| Duration | November 18 – November 21 | ||
| Peak intensity | 65 mph (100 km/h) (1-min) 980 mbar (hPa) | ||


Early on November 17, an extratropical low developed along a stationary front over the central Atlantic. It moved northward and became co-located with an upper-level low. After the fronts dissipated, deep convection began to initiate near the center. As a result, Subtropical Storm Melissa developed at 12:00 UTC on November 18, about 720 mi (1,160 km) east-southeast of Bermuda. Melissa moved generally northward and strengthened slightly on November 19, but weakened later that day after convection diminished. Early on November 20, convection increased again, and after the storm acquired a warm core, it was reclassified as a tropical storm.[78]
After becoming a tropical cyclone on November 20, Melissa accelerated northeastward and slowly strengthened. Later that day, the storm attained its peak intensity with sustained winds of 65 mph (100 km/h) and a minimum barometric pressure of 980 mbar (29 inHg). Amid colder ocean temperatures, Melissa lost all of its deep convection and transitioned into an extratropical cyclone at 00:00 UTC on November 22, at about 140 mi (230 km) north-northeast of Flores Island, Azores. The remnants merged with another system several hours later.[78]
Unnamed Subtropical Storm
| Subtropical storm (SSHWS) | |||
|---|---|---|---|
| |||
| Duration | December 5 – December 7 | ||
| Peak intensity | 50 mph (85 km/h) (1-min) 997 mbar (hPa) | ||
In early December, an upper-level trough stalled to the south of a ridge in the northeastern Atlantic Ocean. Late on December 3, an extratropical storm formed about 415 mi (260 km) south of the Azores, and with the ridge to the north, it executed a cyclonic loop. Amplified by an upper-level low to the west, the storm produced a large area of gale-force winds. Early on December 4 the winds began to decrease. With low wind shear and water temperatures of 72 °F (22 °C), the system developed an area of convection near the center.[79] At around 18:00 UTC on December 4, the NHC noted in a tropical weather outlook that further development was possible before the cyclone encountered more unfavorable conditions.[80]
Early on December 5, the associated frontal features dissipated and the convection became better organized, while the center had a warm core and was co-located with an upper-level low. It was estimated that the system transitioned into a subtropical storm at that time with winds of 50 mph (85 km/h). The NHC operationally treated it as a non-tropical low. After becoming subtropical, the storm turned northward due to an upper-level system. The wind field gradually became smaller while the convection organized into weak rain bands. Separating from the upper-level low aloft, the storm became more tropical in nature, although it was unable to complete the transition. On December 6, the storm turned eastward due to increased upper-level flow, which also increased wind shear. The circulation became distanced from thunderstorm activity, which soon dissipated entirely. After turning back to the north, the storm weakened further due to cooler water temperatures, degenerating into a remnant low on December 7. The storm produced sustained winds of 37 mph (59 km/h) on Santa Maria Island in the Azores, with gusts to 54 mph (87 km/h). Late on December 7, the system degenerated into a remnant trough about 110 mi (180 km) south of the Azores.[79]
The storm was recognized as a subtropical storm by the National Hurricane Center during its post-season analysis.[79]
Storm names
The following names were used for named storms that formed in the North Atlantic in 2013.[81] The names not retired from this list will be used again in the 2019 season. This is the same list used in the 2007 season, except for Dorian, Fernand, and Nestor, which replaced Dean, Felix, and Noel respectively.[82] The names Dorian and Fernand were used for the first time this year, but Nestor was not used.
|
|
Retirement
On April 10, 2014, at the 36th session of the RA IV hurricane committee, the name Ingrid was retired due to the damage and deaths it caused. The name was replaced with Imelda for the 2019 Atlantic hurricane season.[83]
Season effects
The following table lists all of the storms that have formed in the 2013 Atlantic hurricane season. It includes their duration, names, landfall(s) (in parentheses), damages, and death totals. Deaths in parentheses are additional and indirect (an example of an indirect death would be a traffic accident), but were still related to that storm. Damage and deaths include totals while the storm was extratropical, a wave, or a low, and all of the damage figures are in 2013 USD.
| Saffir–Simpson hurricane wind scale | ||||||
| TD | TS | C1 | C2 | C3 | C4 | C5 |
| Storm name |
Dates active | Storm category
at peak intensity |
Max 1-min wind mph (km/h) |
Min. press. (mbar) |
Areas affected | Damage (millions USD) |
Deaths | |||
|---|---|---|---|---|---|---|---|---|---|---|
| Andrea | June 5–7 | Tropical storm | 65 (100) | 992 | Yucatán Peninsula, Cuba, Eastern United States, Atlantic Canada | 0.086[30] | 4[28] | |||
| Barry | June 17–20 | Tropical storm | 45 (75) | 1003 | Central America (Belize), Mexico (Veracruz) | Minimal | 5[32] | |||
| Chantal | July 7–10 | Tropical storm | 65 (100) | 1003 | Lesser Antilles, Puerto Rico, Hispaniola | 10[25] | 1[37] | |||
| Dorian | July 23 – August 3 | Tropical storm | 60 (95) | 1002 | The Bahamas, Florida | None | None | |||
| Erin | August 15–18 | Tropical storm | 45 (75) | 1006 | Cape Verde | Minimal | None | |||
| Fernand | August 25–26 | Tropical storm | 60 (95) | 1001 | Mexico (Veracruz) | Millions[84] | 14[46][48] | |||
| Gabrielle | September 4–13 | Tropical storm | 65 (100) | 1003 | Lesser Antilles, Puerto Rico, Hispaniola, Bermuda, Atlantic Canada | Minimal | None | |||
| Eight | September 6–7 | Tropical depression | 35 (55) | 1008 | Mexico (Tamaulipas) | None | None | |||
| Humberto | September 8–19 | Category 1 hurricane | 90 (150) | 979 | Cape Verde | Minimal | None | |||
| Ingrid | September 12–17 | Category 1 hurricane | 85 (140) | 983 | Mexico (Tamaulipas), Texas | 1500[62] | 23[62] | |||
| Jerry | September 29 – October 3 | Tropical storm | 50 (85) | 1005 | Azores | None | None | |||
| Karen | October 3–6 | Tropical storm | 65 (100) | 998 | Yucatán Peninsula, United States Gulf Coast, Northeastern United States | Minimal | None | |||
| Lorenzo | October 21–24 | Tropical storm | 50 (85) | 1000 | None | None | None | |||
| Melissa | November 18–21 | Tropical storm | 65 (100) | 980 | Azores | None | None | |||
| Unnamed | December 5–7 | Subtropical storm | 50 (85) | 997 | Azores | None | None | |||
| Season Aggregates | ||||||||||
| 15 cyclones | June 5 – December 7 | 90 (150) | 979 | 1510 | 47 | |||||
See also
- Lists of Atlantic hurricanes
- Atlantic hurricane season
- 2013 Pacific hurricane season
- 2013 Pacific typhoon season
- 2013 North Indian Ocean cyclone season
- South-West Indian Ocean cyclone seasons: 2012–13, 2013–14
- Australian region cyclone seasons: 2012–13, 2013–14
- South Pacific cyclone seasons: 2012–13, 2013–14
Notes
- ↑ A major hurricane is a storm that ranks as Category 3 or higher on the Saffir–Simpson hurricane wind scale.[1]
- ↑ All damage figures are in 2013 USD, unless otherwise noted.
References
- ↑ Saffir–Simpson Hurricane Wind Scale. National Hurricane Center (Report). Miami, Florida: National Oceanic and Atmospheric Administration. May 23, 2013. Retrieved April 18, 2014.
- 1 2 3 Background Information: The North Atlantic Hurricane Season. Climate Prediction Center (Report). College Park, Maryland: National Oceanic and Atmospheric Administration. August 9, 2012. Retrieved April 18, 2014.
- 1 2 National Hurricane Center; Hurricane Research Division (July 6, 2016). "Atlantic hurricane best track (HURDAT version 2)". United States National Oceanic and Atmospheric Administration. Retrieved December 5, 2016.
- 1 2 3 Mark Saunders; Adam Lea (December 5, 2012). Extended Range Forecast for Atlantic Hurricane Activity in 2013 (PDF) (Report). London, England: Tropical Storm Risk. Retrieved December 6, 2012.
- 1 2 Mark Saunders; Adam Lea (April 5, 2013). April Forecast Update for Atlantic Hurricane Activity in 2013 (PDF) (Report). London, England: Tropical Storm Risk. Retrieved April 5, 2013.
- 1 2 Linda Maynard (April 8, 2013). WSI: Warm Tropical Atlantic Ocean Temperatures Suggest Another Active Hurricane Season (Report). Andover, Massachusetts: Weather Services International. Retrieved April 8, 2013.
- 1 2 3 William Gray; Philip Klotzbach (April 10, 2013). Extended Range Forecast of Atlantic Seasonal Hurricane Activity and Landfall Strike Probability for 2013 (PDF) (Report). Fort Collins, Colorado: Colorado State University. Retrieved April 10, 2013.
- ↑ Lian Xie; et al. (April 15, 2013). 2013 Atlantic Tropical Cyclone Outlook (PDF) (Report). Raleigh, North Carolina: North Carolina State University. Retrieved May 8, 2013.
- 1 2 North Atlantic Tropical Storm Seasonal Forecast 2013 (Report). Exeter, England. May 15, 2013. Retrieved May 15, 2013.
- 1 2 NOAA predicts active 2013 Atlantic hurricane season (Report). Washington, D.C.: National Oceanic and Atmospheric Administration. May 23, 2013. Retrieved May 23, 2013.
- 1 2 3 4 FSU's 2013 North Atlantic hurricane forecast predicts above-average season (Report). Tallahassee, Florida: Florida State University. May 30, 2013. Retrieved June 3, 2013.
- 1 2 3 William Gray; Phil Klotzbach (June 3, 2013). Extended Range Forecast of Atlantic Seasonal Hurricane Activity and Landfall Strike Probability for 2013 (PDF) (Report). Fort Collins, Colorado: Colorado State University. Retrieved June 3, 2013.
- 1 2 3 Mark Saunders; Adam Lea (June 4, 2013). July Forecast Update for Atlantic Hurricane Activity in 2013 (PDF) (Report). London, England: Tropical Storm Risk. Retrieved July 5, 2013.
- 1 2 3 Mark Saunders; Adam Lea (July 5, 2013). July Forecast Update for Atlantic Hurricane Activity in 2013 (PDF) (Report). London, England: Tropical Storm Risk. Retrieved July 5, 2013.
- 1 2 3 William Gray; Phil Klotzbach (August 2, 2013). Forecast of Atlantic Seasonal Hurricane Activity and Landfall Strike Probability for 2013 (PDF) (Report). Colorado State University. Retrieved August 2, 2013.
- 1 2 3 NOAA: Atlantic hurricane season on track to be above-normal (Report). National Oceanic and Atmospheric Administration. August 8, 2013. Retrieved August 8, 2013.
- ↑ Philip J. Klotzbach; William M. Gray (December 10, 2008). Extended Range Forecast of Atlantic Seasonal Hurricane Activity and U.S. Landfall Strike Probability for 2009 (PDF) (Report). Fort Collins, Colorado: Colorado State University. Archived (PDF) from the original on June 12, 2009. Retrieved January 1, 2009.
- 1 2 3 4 5 2013 Atlantic Hurricane Season. National Hurricane Center (Report). Miami, Florida: National Oceanic and Atmospheric Administration. February 25, 2014. Retrieved April 18, 2014.
- ↑ Brian McNoldy (September 30, 2013). What happened to hurricane season? And why we should keep forecasting it... The Washington Post (Report). Retrieved November 30, 2013.
- ↑ Jon Hamilton (November 29, 2013). 'Forecast Bust:' Why 2013 Hurricane Predictions Were So Wrong. NPR News (Report). Retrieved April 18, 2014.
- ↑ Ryan Maye Handy (November 27, 2013). "Colo. State hurricane forecasts may end due to lack of funds". USA Today. Fort Collins Coloradoan. Retrieved June 20, 2014.
- 1 2 Philip J. Klotzbach; William M. Gray (April 10, 2014). Extended Range Forecast of Atlantic Seasonal Hurricane Activity and U.S. Landfall Strike Probability for 2014 (PDF) (Report). Fort Collins, Colorado: Colorado State University. p. 2. Retrieved June 20, 2014.
- 1 2 Dr. Jeff Masters (November 29, 2013). The Unusually Quiet Atlantic Hurricane Season of 2013 Ends. Weather Underground (Report). Weather Underground. Retrieved November 30, 2013.
- ↑ John L. Beven II (August 22, 2013). Tropical Cyclone Report: Tropical Storm Andrea (PDF). National Hurricane Center (Report). Miami, Florida: National Oceanic and Atmospheric Administration. Retrieved September 14, 2013.
- John L. Beven II (December 12, 2012). Tropical Cyclone Report: Tropical Storm Beryl (PDF) (Report). Miami, Florida: National Hurricane Center. Retrieved December 15, 2012.
- Stacy R. Stewart (August 22, 2013). Tropical Cyclone Report: Tropical Storm Barry (PDF). National Hurricane Center (Report). Miami, Florida: National Oceanic and Atmospheric Administration. Retrieved April 6, 2014.
- July 2013 Global Catastrophe Recap (PDF) (Report). Chicago: Aon. 2013.
- September 2013 Global Catastrophe Recap (PDF) (Report). Chicago: Aon. October 2013. Retrieved April 18, 2014.
- 1 2 3 July 2013 Global Catastrophe Recap (PDF) (Report). Chicago, Illinois: Aon. 2013.
- ↑ William Gray and Phil Klotzbach (March 2014). Why the Atlantic was surprisingly quiet in 2013 (PDF) (Report). Fort Collins, Colorado: Colorado State University. Retrieved June 28, 2014.
- 1 2 Atlantic basin Comparison of Original and Revised HURDAT. Hurricane Research Division; Atlantic Oceanographic and Meteorological Laboratory (Report). Miami, Florida: National Oceanic and Atmospheric Administration. March 2011. Archived from the original on March 29, 2014. Retrieved April 18, 2014.
- 1 2 3 4 5 6 John L. Beven II (August 22, 2013). Tropical Cyclone Report: Tropical Storm Andrea (PDF). National Hurricane Center (Report). Miami, Florida: National Oceanic and Atmospheric Administration. Retrieved September 14, 2013.
- 1 2 Juan O. Tamayo (June 5, 2013). "Tropical storm Andrea's rains pummeled western Cuba". Miami Herald. Archived from the original on January 2, 2014. Retrieved June 6, 2013.
- 1 2 3 "Storm Data and Unusual Weather Phenomena" (PDF). Storm Data. Asheville, North Carolina: National Climatic Data Center. 55 (6): 49–50, 56, 58, 87, 279, 282, 284–285, 412, 414, 448, 466, 480, 482, 486, 590, 620, and 769. June 2013. ISSN 0039-1972. Archived from the original (PDF) on February 20, 2014. Retrieved February 20, 2014.
- ↑ "Remnants of tropical storm Andrea drench the Maritimes". The Canadian Press. Canadian Broadcasting Corporation. June 8, 2013. Retrieved April 5, 2014.
- 1 2 3 4 5 6 Stacy R. Stewart (August 22, 2013). Tropical Cyclone Report: Tropical Storm Barry (PDF). National Hurricane Center (Report). Miami, Florida: National Oceanic and Atmospheric Administration. Retrieved April 6, 2014.
- ↑ "Mantienen alerta de precaución por lluvias de depresión tropical en Honduras". La Prensa (in Spanish). Tegucigalpa, Honduras. EFE. June 18, 2013. Retrieved April 5, 2014.
- ↑ Daniel Ortiz (June 18, 2013). "Hope Creek Gets Flooded Again, This Time Residents Ready". 7NewsBelize. Retrieved April 6, 2014.
- ↑ "Depresión tropical tira árboles y postes en Yucatán". Vanguardia (in Spanish). Mérida, Yucatán. El Universal. June 18, 2013. Retrieved June 19, 2013.
- ↑ "Depresión tropical en Yucatán: Inundaciones, accidentes y caìda de árboles y postes. En Progreso impacta rayo a la CFE". Artículo 7 (in Spanish). Merida, Yucatán. June 19, 2013. Retrieved June 20, 2013.
- 1 2 3 4 5 Todd B. Kimberlain (October 8, 2013). Tropical Cyclone Report: Tropical Storm Chantal (PDF). National Hurricane Center (Report). Miami, Florida: National Oceanic and Atmospheric Administration. Retrieved April 9, 2014.
- ↑ "Martinique: la tempête Chantal prive 33.000 foyers d'électricité". BFM TV (in French). Agence France-Presse. July 9, 2013. Retrieved April 9, 2014.
- ↑ Gary S. Votaw; Luis Rosa; Walter Snell; Carlos Anselmi (2013). Tropical Storm Chantal (PDF). National Weather Service Office San Juan, Puerto Rico (Report). San Juan, Puerto Rico: National Oceanic and Atmospheric Administration. Retrieved April 9, 2014.
- ↑ "Storm Data and Unusual Weather Phenomena" (PDF). Storm Data. Asheville, North Carolina: National Climatic Data Center. 55 (7): 80. July 2013. ISSN 0039-1972. Archived (PDF) from the original on June 1, 2014. Retrieved June 1, 2014.
- ↑ Daniel P. Brown (July 23, 2013). Tropical Depression Four Discussion Number 1. National Hurricane Center (Report). Miami, Florida: National Oceanic and Atmospheric Administration. Retrieved February 11, 2014.
- 1 2 Daniel P. Brown (October 17, 2013). Tropical Cyclone Report: Tropical Storm Dorian (PDF). National Hurricane Center (Report). Miami, Florida: National Oceanic and Atmospheric Administration. Retrieved February 11, 2014.
- 1 2 John P. Cangialosi (September 23, 2013). Tropical Cyclone Report: Tropical Storm Erin (PDF). National Hurricane Center (Report). Miami, Florida: National Oceanic and Atmospheric Administration. Retrieved April 10, 2014.
- 1 2 Robbie J. Berg (October 10, 2013). Tropical Cyclone Report: Tropical Storm Fernand (PDF). National Hurricane Center (Report). Miami, Florida: National Oceanic and Atmospheric Administration. Retrieved April 10, 2014.
- 1 2 "Fernand deja daños en 19 municipios de Veracruz". El Universal (in Spanish). August 26, 2013. Retrieved October 12, 2013.
- 1 2 Henry Austin; Elisha Fieldstadt (August 26, 2013). "Floods, landslides triggered by tropical depression Fernand kill 13 across Mexico". NBC News. Retrieved August 26, 2013.
- ↑ "Tropical Storm Fernand targets Mexico coast". Fox News. Associated Press. August 26, 2013. Retrieved October 12, 2013.
- 1 2 "La tormenta tropical 'Fernand' causa al menos 14 muertos en Veracruz". CNN (in Spanish). August 27, 2013. Retrieved August 27, 2013.
- 1 2 3 Lixion A. Avila (October 25, 2013). Tropical Cyclone Report: Tropical Storm Gabrielle (PDF). National Hurricane Center (Report). Miami, Florida: National Oceanic and Atmospheric Administration. Retrieved April 11, 2014.
- ↑ Michael J. Brennan (September 4, 2013). Tropical Storm Gabrielle Discussion Number 2. National Hurricane Center (Report). Miami, Florida: National Oceanic and Atmospheric Administration. Retrieved April 11, 2014.
- ↑ September 2013 Climate Report for Puerto Rico and the U.S. Virgin Islands. National Weather Service Office San Juan, Puerto Rico (Report). San Juan, Puerto Rico: National Oceanic and Atmospheric Administration. October 10, 2013. Retrieved April 14, 2014.
- ↑ "Storm Data and Unusual Weather Phenomena" (PDF). Storm Data. Asheville, North Carolina: National Climatic Data Center. 55 (9): 285 and 288. September 2013. ISSN 0039-1972. Archived (PDF) from the original on April 14, 2014. Retrieved April 14, 2014.
- ↑ Christopher W. Landsea; Daniel P. Brown (September 6, 2013). NHC Graphical Outlook Archive. National Hurricane Center (Report). Miami, Florida: National Oceanic and Atmospheric Administration. Retrieved September 13, 2013.
- 1 2 Richard J. Pasch (February 4, 2014). Tropical Cyclone Report: Tropical Depression Eight (PDF). National Hurricane Center (Report). Miami, Florida: National Oceanic and Atmospheric Administration. Retrieved February 4, 2014.
- ↑ (Spanish) Isabel Zamudio (September 6, 2013). Inundaciones en Veracruz, saldo de depresión tropical 8. Milenio (Report). Retrieved April 14, 2014.
- ↑ "DF: hasta con lanchas atienden inundaciones". Milenio (in Spanish). September 8, 2013. Retrieved April 14, 2014.
- 1 2 3 Christopher W. Landsea; Eric S. Blake (January 8, 2014). Tropical Cyclone Report: Hurricane Humberto (PDF). National Hurricane Center (Report). Miami, Florida: National Oceanic and Atmospheric Administration. Retrieved April 17, 2014.
- ↑ Lusa (September 11, 2013). "Meteorologia Tempestade tropical afasta-se de Cabo Verde". Noticias ao Minuto (in Portuguese). Retrieved April 17, 2014.
- ↑ "São Tomean authorities deny presence of "Rotterdam"". A Semana. November 22, 2013. Retrieved June 20, 2014.
- 1 2 3 4 John L. Beven II (February 5, 2014). Tropical Cyclone Report: Hurricane Ingrid (PDF). National Hurricane Center (Report). Miami, Florida: National Oceanic and Atmospheric Administration. Retrieved April 18, 2014.
- 1 2 3 (Spanish) Redhum (December 25, 2013). 2013: México vive un año histórico en desastres naturales (Report). ReliefWeb. Retrieved April 18, 2014.
- 1 2 3 4 September 2013 Global Catastrophe Recap (PDF) (Report). Chicago, Illinois: Aon. October 2013. Retrieved April 18, 2014.
- ↑ (Spanish) Government of Mexico (November 28, 2013). El Coordinador Nacional de Protección Civil, Luis Felipe Puente Espinosa y el Subsecretario de Normatividad de Medios de la Secretaría de Gobernación y Vocero del Gabinete de Seguridad del Gobierno de la República, Eduardo Sánchez Hernández. (Report). Mexico City, Mexico: ReliefWeb. Retrieved April 18, 2014.
- ↑ WSPA Disaster Assessment and Needs Analysis: Flooding in Mexico (PDF). World Society for the Protection of Animals (Report). ReliefWeb. September 30, 2013. Retrieved April 18, 2014.
- ↑ (Spanish) Government of Mexico (October 24, 2013). Llevan Sedesol y Bancos de Alimentos productos a las zonas marginadas (Report). Mexico City, Mexico: ReliefWeb. Retrieved April 18, 2014.
- ↑ (Spanish) Entrega Cruz Roja Mexicana ayuda humanitaria a pobladores de seis comunidades en Pánuco, Veracruz. Cruz Roja Mexicana (Report). Mexico City, Mexico: ReliefWeb. October 11, 2013. Retrieved April 18, 2014.
- ↑ "How cartels win with storm damage". McClatchy DC. September 28, 2013. Retrieved April 18, 2014.
- 1 2 Stacy R. Stewart (December 23, 2013). Tropical Cyclone Report: Hurricane Jerry (PDF). National Hurricane Center (Report). Miami, Florida: National Oceanic and Atmospheric Administration. Retrieved April 17, 2014.
- 1 2 Todd B. Kimberlain (January 8, 2014). Tropical Cyclone Report: Tropical Storm Karen (PDF). National Hurricane Center (Report). Miami, Florida: National Oceanic and Atmospheric Administration. Retrieved April 17, 2014.
- ↑ "Latest track shows weaker Karen making hard right turn". WESH TV. Orlando, Florida. October 6, 2013. Retrieved April 17, 2014.
- ↑ Kathy Finn (October 5, 2013). "Evacuations ordered as Tropical Storm Karen nears U.S. coast". Chicago Tribune. New Orleans, Louisiana. Reuters. Retrieved April 17, 2014.
- ↑ Kevin McGill; Stacey Plaisance (October 4, 2013). "Karen threatens US during quiet hurricane season". Yahoo News. Braithwaite, Louisiana. Associated Press. Retrieved October 4, 2013.
- ↑ Campbell Robertson (October 5, 2013). "Gulf Coast Storm Pulls Federal Workers Off Furlough". The New York Times. New Orleans, Louisiana. Retrieved April 17, 2014.
- ↑ "Storm System Karen Dissipates Off Gulf Coast". The Weather Channel. New Orleans, Louisiana. Associated Press. October 6, 2013. Retrieved June 1, 2014.
- ↑ "Storm Data and Unusual Weather Phenomena" (PDF). Storm Data. Asheville, North Carolina: National Climatic Data Center. 55 (10): 16–17, 100, 122, and 133. October 2013. ISSN 0039-1972. Archived (PDF) from the original on April 17, 2014. Retrieved April 17, 2014.
- 1 2 Daniel P. Brown (December 9, 2013). Tropical Cyclone Report: Tropical Storm Lorenzo (PDF). National Hurricane Center (Report). Miami, Florida: National Oceanic and Atmospheric Administration. Retrieved April 18, 2014.
- ↑ "UK windstorm heads to northern Europe". Insurance Times. Retrieved 28 October 2013.
- 1 2 John P. Cangialosi (January 22, 2014). Tropical Cyclone Report: Tropical Storm Melissa (PDF). National Hurricane Center (Report). Miami, Florida: National Oceanic and Atmospheric Administration. Retrieved April 18, 2014.
- 1 2 3 Eric S. Blake; Todd B. Kimberlain; John L. Beven II (February 7, 2014). Unnamed Subtropical Storm Tropical Cyclone Report (PDF). National Hurricane Center (Report). Miami, Florida: National Oceanic and Atmospheric Administration. Archived from the original (PDF) on 2014-02-25. Retrieved April 17, 2014.
- ↑ John L. Beven II (December 4, 2013). Tropical Weather Outlook. National Hurricane Center (Report). National Oceanic and Atmospheric Administration. Archived from the original (TXT) on 2014-02-25. Retrieved April 17, 2014.
- ↑ Tropical Cyclone Names. National Hurricane Center (Report). National Oceanic and Atmospheric Administration. April 11, 2013. Archived from the original on February 8, 2014. Retrieved April 10, 2014.
- ↑ "Dean, Felix, and Noel Retired From List of Storm Names". National Oceanic and Atmospheric Administration. May 13, 2008. Retrieved May 8, 2013.
- ↑ WMO retires Ingrid and Manuel for Atlantic and eastern North Pacific basins (Report). Silver Spring, Maryland: National Oceanic and Atmospheric Administration. April 10, 2014. Retrieved April 10, 2014.
- ↑ August 2013 Global Catastrophe Recap (PDF) (Report). Impact Forecasting. Aon. September 4, 2013. p. 5. Retrieved January 5, 2014.
External links
| Wikimedia Commons has media related to 2013 Atlantic hurricane season. |
- National Hurricane Center Website
- National Hurricane Center's Atlantic Tropical Weather Outlook
- Tropical Cyclone Formation Probability Guidance Product
Tropical cyclones of the 2013 Atlantic hurricane season | ||
|---|---|---|
| ||
| ||