Selby (UK Parliament constituency)
| Selby | |
|---|---|
|
Former County constituency for the House of Commons | |
|
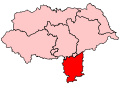
Boundary of Selby in North Yorkshire for the 2005 general election. | |
|
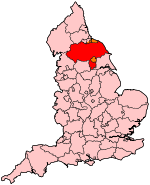
Location of North Yorkshire within England. | |
| County | North Yorkshire |
| Major settlements | Selby, Tadcaster, Sherburn-in-Elmet |
| 1983–2010 | |
| Number of members | One |
| Replaced by | Selby and Ainsty, York Outer |
| Created from | Barkston Ash, Howden, Goole and Thirsk & Malton[1] |
Selby was a parliamentary constituency in North Yorkshire, represented in the House of Commons of the Parliament of the United Kingdom. It elected one Member of Parliament (MP) by the first past the post system of election.
The constituency existed from 1983 to 2010.
History
This was a safe Conservative seat from 1983 to 1997 then became a Labour marginal for the remainder of its existence.
Boundaries
1983-1997: The District of Selby, and the District of Ryedale ward of Osbaldwick and Heworth.
1997-2010: The District of Selby.
The constituency covered the district of Selby and the south-eastern suburbs of the city of York (namely the parishes of Fulford, Heslington and Osbaldwick and Heworth Without[2]). It included the University of York and the Drax and Eggborough power stations.
Boundary review
Following their review of parliamentary representation in York and North Yorkshire in the 2000s, the Boundary Commission for England created a new seat of Selby and Ainsty. The new seat consists of much of the former Selby constituency, minus the south-western suburbs of York which are included in the (also newly created) seat of York Outer.
Members of Parliament
| Election | Member[3] | Party | |
|---|---|---|---|
| 1983 | Michael Alison | Conservative | |
| 1997 | John Grogan | Labour | |
| 2010 | constituency abolished: see Selby and Ainsty & York Outer | ||
Elections
Elections in the 2000s
| Party | Candidate | Votes | % | ± | |
|---|---|---|---|---|---|
| Labour | John Timothy Grogan | 22,623 | 43.1 | −2.0 | |
| Conservative | Mark Menzies | 22,156 | 42.2 | +1.4 | |
| Liberal Democrat | Ian Cuthbertson | 7,770 | 14.8 | +3.7 | |
| Majority | 467 | 0.9 | |||
| Turnout | 52,549 | 65.4 | +0.4 | ||
| Labour hold | Swing | −1.7 | |||
| Party | Candidate | Votes | % | ± | |
|---|---|---|---|---|---|
| Labour | John Timothy Grogan | 22,652 | 45.1 | −0.8 | |
| Conservative | Andrew Michael Mitchell | 20,514 | 40.8 | +1.7 | |
| Liberal Democrat | Jeremy David Wilcock | 5,569 | 11.1 | −1.0 | |
| Green | Miss Helen Mary Nightingale Kenwright | 902 | 1.8 | N/A | |
| UKIP | Graham Robert Lewis | 635 | 1.3 | +0.3 | |
| Majority | 2,138 | 4.3 | |||
| Turnout | 50,272 | 65.0 | −9.8 | ||
| Labour hold | Swing | ||||
Elections in the 1990s
| Party | Candidate | Votes | % | ± | |
|---|---|---|---|---|---|
| Labour | John Timothy Grogan | 25,838 | 45.9 | +11.0 | |
| Conservative | Ken Hind | 22,002 | 39.1 | −11.1 | |
| Liberal Democrat | A. Edward Batty | 6,778 | 12.0 | −2.9 | |
| Referendum | David Walker | 1,162 | 2.1 | N/A | |
| UKIP | P. Spence | 536 | 1.0 | N/A | |
| Majority | 3,836 | 6.8 | −8.6 | ||
| Turnout | 56,316 | 74.7 | |||
| Labour gain from Conservative | Swing | +11.1 | |||
| Party | Candidate | Votes | % | ± | |
|---|---|---|---|---|---|
| Conservative | Michael Alison | 31,067 | 50.2 | −1.4 | |
| Labour | John Timothy Grogan | 21,559 | 34.8 | +8.1 | |
| Liberal Democrat | A. Edward Batty | 9,244 | 14.9 | −6.7 | |
| Majority | 9,508 | 15.4 | −9.5 | ||
| Turnout | 61,870 | 80.2 | +2.5 | ||
| Conservative hold | Swing | −4.7 | |||
Elections in the 1980s
| Party | Candidate | Votes | % | ± | |
|---|---|---|---|---|---|
| Conservative | Michael Alison | 28,611 | 51.6 | −5.1 | |
| Labour | John Timothy Grogan | 14,832 | 26.7 | +6.1 | |
| Liberal | James Edward Ford Longman | 12,010 | 21.7 | −1.1 | |
| Majority | 13,779 | 24.9 | |||
| Turnout | 55,453 | 77.69 | |||
| Conservative hold | Swing | ||||
| Party | Candidate | Votes | % | ± | |
|---|---|---|---|---|---|
| Conservative | Michael Alison | 26,712 | 56.7 | N/A | |
| Liberal | W.K. Whitaker | 10,747 | 22.8 | N/A | |
| Labour | Mrs. S. Haines | 9,687 | 20.6 | N/A | |
| Majority | 15,965 | 33.9 | N/A | ||
| Turnout | 47,146 | 72.1 | N/A | ||
| Conservative win (new seat) | |||||
See also
Notes and references
- ↑ "'Selby', June 1983 up to May 1997". ElectionWeb Project. Cognitive Computing Limited. Retrieved 14 March 2016.
- ↑ The ward of Osbaldwick and Heworth Without was moved to the Selby constituency in 1997
- ↑ Leigh Rayment's Historical List of MPs – Constituencies beginning with "S" (part 2)
- ↑ "Politics Resources". Election 1997. Politics Resources. 1 May 1997. Retrieved 5 January 2011.
- ↑ C. Rallings & M. Thrasher, The Media Guide to the New Parliamentary Constituencies, p.145 (Plymouth: LGC Elections Centre, 1995)
- ↑ The 1997 election result has swings relative to the notional, not the actual, 1992 result.
- ↑ "Politics Resources". Election 1992. Politics Resources. 9 April 1992. Retrieved 6 December 2010.
Coordinates: 53°46′37″N 1°04′44″W / 53.777°N 1.079°W