Potter County, Pennsylvania
| Potter County, Pennsylvania | |
|---|---|
 | |
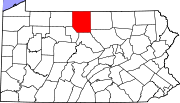 Location in the U.S. state of Pennsylvania | |
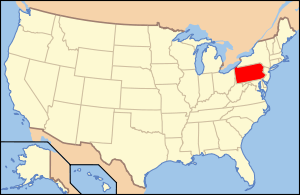 Pennsylvania's location in the U.S. | |
| Founded | September 1, 1826 |
| Named for | James Potter |
| Seat | Coudersport |
| Largest borough | Coudersport |
| Area | |
| • Total | 1,082 sq mi (2,802 km2) |
| • Land | 1,081 sq mi (2,800 km2) |
| • Water | 0.2 sq mi (1 km2), 0.02% |
| Population (est.) | |
| • (2015) | 17,093 |
| • Density | 16/sq mi (6/km²) |
| Congressional district | 5th |
| Time zone | Eastern: UTC-5/-4 |
| Website |
www |
Potter County is a county located in the U.S. state of Pennsylvania. As of the 2010 census, the population was 17,457,[1] making it the fifth-least populous county in Pennsylvania. Its county seat is Coudersport.[2] The county was created in 1804 and later organized in 1836.[3] It is named after James Potter, who was a general from Pennsylvania in the Continental Army during the American Revolution. Though it is named for him, James Potter never actually lived in Potter County and may have never even visited the area.
Potter County is located in the Allegheny Plateau region.
History
Major Isaac Lyman, an American Revolutionary war veteran was one of the first permanent settlers in Potter County. Major Lyman is recognized as the founder of Potter County. He was paid ten dollars for each settler he convinced to move to Potter County. He built his home in 1809 in nearby Lymansville, now known as Ladonna. Major Lyman also built the first road to cross Potter County and Potter County's first sawmill and gristmill.
Lyman had a colorful personal history. After the death in childbirth of his first wife, Sally Edgecombe, he remarried; later he left his second wife and started a third family in Potter County. The second Mrs. Lyman was determined not to suffer on her own. She sought out the Major, travelling from Bolton Landing, New York to Potter County with the help of their son, Burrell, who was 18 at the time. Major Lyman lived with these two families in Potter County. Historical accounts of the living situation vary. Some say that Lyman kept both wives under one roof. Others state that there were two log homes for the families on the same piece of property. Descendants of Major Isaac Lyman's three families still live and work in Potter County.
Geography
According to the U.S. Census Bureau, the county has a total area of 1,082 square miles (2,800 km2), of which 1,081 square miles (2,800 km2) is land and 0.2 square miles (0.52 km2) (0.02%) is water.[4]
Three major watersheds meet in Potter County: the watersheds of the Chesapeake Bay, St. Lawrence River, and Mississippi River. Moreover, the main stem by volume of the entire Mississippi river system, the Allegheny River, has its source in central Potter County, near Cobb Hill.
Adjacent counties
- Allegany County, New York (north)
- Steuben County, New York (northeast)
- Tioga County (east)
- Lycoming County (southeast)
- Clinton County (south)
- Cameron County (southwest)
- McKean County (west)
Major highways
Demographics
| Historical population | |||
|---|---|---|---|
| Census | Pop. | %± | |
| 1810 | 29 | — | |
| 1820 | 186 | 541.4% | |
| 1830 | 1,265 | 580.1% | |
| 1840 | 3,371 | 166.5% | |
| 1850 | 6,048 | 79.4% | |
| 1860 | 11,470 | 89.6% | |
| 1870 | 11,265 | −1.8% | |
| 1880 | 13,797 | 22.5% | |
| 1890 | 22,778 | 65.1% | |
| 1900 | 30,621 | 34.4% | |
| 1910 | 29,729 | −2.9% | |
| 1920 | 21,089 | −29.1% | |
| 1930 | 17,489 | −17.1% | |
| 1940 | 18,201 | 4.1% | |
| 1950 | 16,810 | −7.6% | |
| 1960 | 16,483 | −1.9% | |
| 1970 | 16,395 | −0.5% | |
| 1980 | 17,726 | 8.1% | |
| 1990 | 16,717 | −5.7% | |
| 2000 | 18,080 | 8.2% | |
| 2010 | 17,457 | −3.4% | |
| Est. 2015 | 17,093 | [5] | −2.1% |
| U.S. Decennial Census[6] 1790-1960[7] 1900-1990[8] 1990-2000[9] 2010-2013[1] | |||
As of the census[10] of 2000, there were 18,080 people, 7,005 households, and 5,001 families residing in the county. The population density was 17 people per square mile (6/km²). There were 12,159 housing units at an average density of 11 per square mile (4/km²). The racial makeup of the county was 98.06% White, 0.29% Black or African American, 0.22% Native American, 0.50% Asian, 0.03% Pacific Islander, 0.19% from other races, and 0.71% from two or more races. 0.57% of the population were Hispanic or Latino of any race. 27.3% were of English, 26.9% were of German, 9.9% Irish and 5.8% Italian ancestry according to the 2012 American Community Survey.
There were 7,005 households out of which 31.50% had children under the age of 18 living with them, 59.50% were married couples living together, 7.60% had a female householder with no husband present, and 28.60% were non-families. 24.70% of all households were made up of individuals and 11.40% had someone living alone who was 65 years of age or older. The average household size was 2.54 and the average family size was 3.02.
In Potter County, the population was spread out with 26.00% under the age of 18, 6.90% from 18 to 24, 26.10% from 25 to 44, 24.30% from 45 to 64, and 16.70% who were 65 years of age or older. The median age was 39 years. For every 100 females there were 97.40 males. For every 100 females age 18 and over, there were 94.80 males.
- Live birth rate
Potter County's live birth rate was 242 births in 1990. The County's live birth rate in 2000 was 223 births, while in 2011 it had declined to 201 babies.[11] Over the past 50 years (1960 to 2010), rural Pennsylvania saw a steady decline in both the number and proportion of residents under 18 years old. In 1960, 1.06 million rural residents, or 35 percent of the rural population, were children.
- County poverty demographics
According to research by The Center for Rural Pennsylvania, which is a legislative agency of the Pennsylvania General Assembly, the poverty rate for Potter County was 14.3% in 2014.[12] The statewide poverty rate was 13.6% in 2014. The 2012 childhood poverty rate by school district was: Austin Area School District - 42% of pupils living at 185% or below than the Federal Poverty Level and Coudersport Area School District - 41.9%, Galeton Area School District - 57.1%, Northern Potter School District - 51.3%, Oswayo Valley School District - 54.9%, Port Allegany School District - 46.8% and Keystone Central School District - 51.7% of pupils living in poverty.[13]
Politics
Potter County is one of the most Republican counties in Pennsylvania. In 2004, George W. Bush received 5,640 votes (71%) to 2,268 votes (29%) for John Kerry. The county has voted for the Republican in every presidential election since 1964. In 2006, Rick Santorum received 3,476 votes (63%) to 2,012 votes (37%) for Bob Casey, Jr., making it Santorum's strongest county in his defeat. Lynn Swann also received more than 60% of the Potter County vote in his defeat. In 2016, Donald J. Trump and Pat Toomey were overwhelmingly elected in Potter County for the U.S. presidential election and U.S. Senate election respectively. Trump won 80.31% of the vote over Hillary Clinton while Toomey won 77.79% of the vote over Katie McGinty. In the 2016 State Attorney General race, John Rafferty won 79.15% of the vote.[14]
Education

Public school districts
- Austin Area School District
- Coudersport Area School District
- Galeton Area School District (also in Tioga County)
- Keystone Central School District (also in Clinton County)
- Northern Potter School District
- Oswayo Valley School District (also in McKean County)
- Port Allegany School District (also in McKean County)
Private schools
- Chestnut Ridge School, Genesee, Grades 1-8
- Hebron Center Christian School, Coudersport, Grades PK-12
- Meadow View School, Genesee, Grades 1-8
- Musto Hollow Amish School, Genesee, Grades 1-8
- Penn-York Camp & Retreat Center, Ulysses
- Ulysses Amish School, Ulysses, Grades 1-8
List from National Center for Education Statistics[15]
Libraries
- Coudersport Public Library
- Galeton Public Library
- Genesee Area Library
- Oswayo Valley Memorial Library, Shinglehouse
- Ulysses Library Association
- Potter-Tioga County Library System, Coudersport
Pennsylvania EdNA - Educational Entities, 2013
Recreation

Potter County is home to 8 state parks and many more acres of state forest and gamelands.
- Cherry Springs State Park
- Denton Hill State Park
- Lyman Run State Park
- Ole Bull State Park
- Patterson State Park
- Prouty Place State Park
- Sinnemahoning State Park parts in Cameron County
- Sizerville State Park parts in Cameron County
The county is also the location of the annual "God's Country Marathon" race between Galeton and Coudersport.
Communities

Under Pennsylvania law, there are four types of incorporated municipalities: cities, boroughs, townships, and, in at most two cases, towns. The following boroughs and townships are located in Potter County:
Boroughs
- Austin
- Coudersport (county seat)
- Galeton
- Oswayo
- Shinglehouse
- Ulysses
Townships
Census-designated places
Unincorporated communities
Road district (defunct)
- East Fork Road was a former district which dissolved on January 1, 2004. The district contained only one road and 14 residents, with almost all of the district's land claimed as part of the Susquehannock State Forest. The territory that constituted the East Fork Road District is now the eastern half of Wharton Township.
Population ranking
The population ranking of the following table is based on the 2010 census of Potter County.[16]
† county seat
| Rank | City/Town/etc. | Municipal type | Population (2010 Census)
|
|---|---|---|---|
| 1 | † Coudersport | Borough | 2,546 |
| 2 | Galeton | Borough | 1,149 |
| 3 | Shinglehouse | Borough | 1,127 |
| 4 | Roulette | CDP | 779 |
| 5 | Ulysses | Borough | 621 |
| 6 | Austin | Borough | 562 |
| 7 | Sweden Valley | CDP | 223 |
| 8 | Oswayo | Borough | 139 |
Marcellus shale impact fee
Act 13 of 2012,[17] which levied a Marcellus Shale Impact Fee, was signed into law by Governor Tom Corbett on February 14, 2012. The bill provides for the imposition of an unconventional well fee by county (or alternatively municipalities compelling the imposition of an unconventional well fee). A county may impose the fee if unconventional gas wells are located within its borders and it passes an ordinance within 60 days of the effective date of Act 13. A county that did not pass an ordinance imposing a fee is prohibited from receiving funds. This prohibition remains in effect until a county passes an ordinance imposing a fee.[18][19] In 2014, Potter County received an impact fee disbursement of $256,456.52. The top county recipient was Washington County which received $6,512,570.65 in 2014.[20] In 2014, there were 40 marcellus shale wells in Potter County.[21]
- 2013 - 58 wells, received $401,640.77,[22]
- 2012 - 30 wells, received $407,315.48[23]
- 2011 - $554, 536.48[24]
See also
- Austin Dam (until 1911 failure, and afterward until 1942 failure) (in Pennsylvania in the US)
- National Register of Historic Places listings in Potter County, Pennsylvania
- The Great Outdoors Conservancy
References
- 1 2 "State & County QuickFacts". United States Census Bureau. Retrieved November 20, 2013.
- ↑ "Find a County". National Association of Counties. Retrieved 2011-06-07.
- ↑ "Pennsylvania: Individual County Chronologies". Pennsylvania Atlas of Historical County Boundaries. The Newberry Library. 2008. Retrieved March 13, 2015.
- ↑ "2010 Census Gazetteer Files". United States Census Bureau. August 22, 2012. Retrieved March 10, 2015.
- ↑ "County Totals Dataset: Population, Population Change and Estimated Components of Population Change: April 1, 2010 to July 1, 2015". Retrieved July 2, 2016.
- ↑ "U.S. Decennial Census". United States Census Bureau. Retrieved March 10, 2015.
- ↑ "Historical Census Browser". University of Virginia Library. Retrieved March 10, 2015.
- ↑ Forstall, Richard L., ed. (March 24, 1995). "Population of Counties by Decennial Census: 1900 to 1990". United States Census Bureau. Retrieved March 10, 2015.
- ↑ "Census 2000 PHC-T-4. Ranking Tables for Counties: 1990 and 2000" (PDF). United States Census Bureau. April 2, 2001. Retrieved March 10, 2015.
- ↑ "American FactFinder". United States Census Bureau. Retrieved 2008-01-31.
- ↑ Pennsylvania Department of Health, Birth Age County Reports 1990, 2000 and 2011, 2011
- ↑ US Census Bureau (2015). "Poverty Rates by County Small Area Income and Poverty Estimates".
- ↑ Pennsylvania Budget and Policy Center (2012). "Student Poverty Concentration 2012".
- ↑ "Pennsylvania Elections - County Results". www.electionreturns.pa.gov. Retrieved 2016-11-25.
- ↑ ies, National Center for Education Statistics, US Department of Education, Institute of Education Sciences, Private School Universe Survey 2008
- ↑ http://www.census.gov/2010census/
- ↑ Pennsylvania House of Representatives (February 8, 2012). "HB1950 of Session 2011 OIL AND GAS (58 PA.C.S.) - OMNIBUS AMENDMENTS".
- ↑ Pennsylvania General Assembly, Act 13 of 2012, February 14, 2012.
- ↑ Pennsylvania Utility Commission (2012). "Act 13 (Impact Fee)".
- ↑ Pennsylvania Utility Commission (2015). "Disbursements and Impact Fees 2014".
- ↑ Pennsylvania Utility Commission (2015). "County Well Count Breakdown for 2014".
- ↑ PUC (2013). "Potter County Total distribution for year 2013 :".
- ↑ Pennsylvania Utility Commission (2013). "Potter County disbursements".
- ↑ Pennsylvania Utility Commission (2012). "Potter County disbursements".
External links
- PotterCountyPa.net
- Potter County Visitor's Association
- Galeton Area School District
- Austin Area School District
- Coudersport Area School District
- Shinglehouse Area School District
Municipalities and communities of Potter County, Pennsylvania, United States | ||
|---|---|---|
| Boroughs | | |
| Townships | ||
| CDPs | ||
| Unincorporated communities | ||
Coordinates: 41°44′N 77°54′W / 41.74°N 77.90°W