Newcastle upon Tyne Central (UK Parliament constituency)
Coordinates: 55°00′11″N 1°36′36″W / 55.003°N 1.610°W
| Newcastle upon Tyne Central | |
|---|---|
|
Borough constituency for the House of Commons | |
|
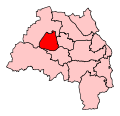
Boundary of Newcastle upon Tyne Central in Tyne and Wear. | |
|
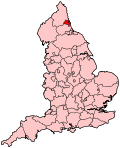
Location of Tyne and Wear within England. | |
| County | Tyne and Wear |
| Electorate | 60,795 (December 2010)[1] |
| Current constituency | |
| Created | 1918 |
| Member of parliament | Chi Onwurah (Labour) |
| Number of members | One |
| Created from | Newcastle-upon-Tyne |
| Overlaps | |
| European Parliament constituency | North East England |
Newcastle upon Tyne Central is a constituency[n 1] represented in the House of Commons of the UK Parliament since 2010 by Chi Onwurah from Labour, a former head of OFCOM.[n 2]
History
Parliament created this seat under the Representation of the People Act 1918 for the general election later that year. From its creation the constituency has been represented by members of the Labour and Conservative parties only. Since the 1987 general election, the seat has been served by an MP in the Labour Party.
Boundaries
1918-1950: The County Borough of Newcastle wards of All Saints, St John's, St Nicholas, Stephenson, and Westgate.
1950-1983: The County Borough of Newcastle wards of Armstrong, Byker, St Anthony's, St Nicholas, and Stephenson, and the Rural District of Newcastle.
1983-1997: The City of Newcastle wards of Blakelaw, Fenham, Jesmond, Kenton, Moorside, South Gosforth, and Wingrove.
1997-2010: The City of Newcastle wards of Blakelaw, Fenham, Jesmond, Kenton, Moorside, Sandyford, South Gosforth, and Wingrove.
2010-present: The City of Newcastle wards of Benwell and Scotswood, Blakelaw, Elswick, Fenham, Kenton, Westgate, West Gosforth, and Wingrove.
The constituency covers the central part of Newcastle upon Tyne, being one of three constituencies in the city. Between 1983 and 2010, the seat did not actually include the city's commercial centre, being instead part of the now-abolished Tyne Bridge constituency.
Constituency profile
The constituency is mostly the urban city itself, which has seen end its once export-leading shipbuilding industry, its adult population has mostly a middle or low income, however with modern advanced engineering, learning, design, graphics, production company headquarters and tourism the city forms is a bellwether for the North East region's economy firmly in the British forefront of a determined return to increasing national output.[2] In November 2012 total unemployment (based on the more up-to-date claimant statistics) placed the City of Newcastle in joint 17th place of 29 constituencies in the region, above, for example the City of Durham at the bottom of the list, with just 3.4% claimants whereas Newcastle had 6.0% claimants, identical to Sunderland Central.[3]
Members of Parliament
Elections
Elections in the 2010s
| Party | Candidate | Votes | % | ± | |
|---|---|---|---|---|---|
| Labour | Chi Onwurah | 19,301 | 55.0 | +9.1 | |
| Conservative | Simon Kitchen[6] | 6,628 | 18.9 | -0.5 | |
| UKIP | Daniel Peter Thompson[7] | 5,214 | 14.9 | +12.7 | |
| Liberal Democrat | Nicholas Cott | 2,218 | 6.3 | -17.8 | |
| Green | Alexander Patrick Johnson[8] | 1,724 | 4.9 | +3.3 | |
| Majority | 12,673 | 36.1 | |||
| Turnout | 35085 | 57.5 | |||
| Labour hold | Swing | ||||
David Robinson-Young was previously standing for UKIP in Newcastle Central,[9] but has now moved to Newcastle East.
| Party | Candidate | Votes | % | ± | |
|---|---|---|---|---|---|
| Labour | Chi Onwurah | 15,692 | 45.9 | −4.6 | |
| Liberal Democrat | Gareth Kane | 8,228 | 24.1 | −3.4 | |
| Conservative | Nick Holder | 6,611 | 19.4 | +2.8 | |
| BNP | Ken Booth | 2,302 | 6.7 | +6.7 | |
| UKIP | Martin Davies | 754 | 2.2 | +2.2 | |
| Green | John Pearson | 568 | 1.7 | −2.2 | |
| Majority | 7,464 | 21.9 | |||
| Turnout | 34,155 | 56.4 | −0.1 | ||
| Labour hold | Swing | −0.6 | |||
- * Gareth Kane, Lib Dem candidate, was Councillor for Ouseburn Ward at the time of the General Election 2010
Elections in the 2000s
| Party | Candidate | Votes | % | ± | |
|---|---|---|---|---|---|
| Labour | Jim Cousins | 16,211 | 45.1 | −9.9 | |
| Liberal Democrat | Greg Stone | 12,229 | 34.0 | +12.3 | |
| Conservative | Wendy Morton | 5,749 | 16.0 | −5.3 | |
| Green | Joe Hulm | 1,254 | 3.5 | +3.5 | |
| Newcastle Academy with Christian Values Party | Clive Harding | 477 | 1.3 | +1.3 | |
| Majority | 3,982 | 11.1 | |||
| Turnout | 35,920 | 52.5 | +1.2 | ||
| Labour hold | Swing | −11.1 | |||
- * Greg Stone, Lib Dem candidate, was Councillor for North Heaton Ward at the time of the General Election 2005
| Party | Candidate | Votes | % | ± | |
|---|---|---|---|---|---|
| Labour | Jim Cousins | 19,169 | 55.0 | −4.2 | |
| Liberal Democrat | Stephen Psallidas | 7,564 | 21.7 | +6.7 | |
| Conservative | Aidan Ruff | 7,414 | 21.3 | −2.2 | |
| Socialist Labour | Gordon Potts | 723 | 2.1 | N/A | |
| Majority | 11,605 | 33.3 | |||
| Turnout | 34,870 | 51.3 | −14.6 | ||
| Labour hold | Swing | ||||
Elections in the 1990s
| Party | Candidate | Votes | % | ± | |
|---|---|---|---|---|---|
| Labour | Jim Cousins | 27,272 | 59.2 | +7.5 | |
| Conservative | Brooks Newmark | 10,792 | 23.4 | −12.2 | |
| Liberal Democrat | Ruth Berry | 6,911 | 15.0 | +2.3 | |
| Referendum | Charles A. Coxon | 1,113 | 2.4 | N/A | |
| Majority | 16,480 | 35.8 | |||
| Turnout | 46,088 | 65.9 | |||
| Labour hold | Swing | ||||
| Party | Candidate | Votes | % | ± | |
|---|---|---|---|---|---|
| Labour | Jim Cousins | 21,123 | 49.4 | +5.2 | |
| Conservative | Mike Summersby | 15,835 | 37.0 | -1.8 | |
| Liberal Democrat | Lembit Öpik | 5,816 | 13.6 | −2.2 | |
| Majority | 5,288 | 12.4 | +7.0 | ||
| Turnout | 42,774 | 71.3 | −4.2 | ||
| Labour hold | Swing | +3.5 | |||
Elections in the 1980s
| Party | Candidate | Votes | % | ± | |
|---|---|---|---|---|---|
| Labour | Jim Cousins | 20,416 | 44.2 | ||
| Conservative | Piers Merchant | 17,933 | 38.8 | ||
| Social Democratic | Nigel Martin | 7,304 | 15.8 | ||
| Green | Richard John Bird | 418 | 0.91 | ||
| Red Front | Kirk Williams | 111 | 0.24 | ||
| Majority | 2,483 | 5.38 | |||
| Turnout | 75.52 | ||||
| Labour gain from Conservative | Swing | ||||
| Party | Candidate | Votes | % | ± | |
|---|---|---|---|---|---|
| Conservative | Piers Merchant | 18,161 | 40.82 | ||
| Labour | Nigel Todd | 15,933 | 35.81 | ||
| Social Democratic | John Horam | 9,923 | 22.30 | ||
| Ecology | Douglas Neil Jacques | 478 | 1.07 | ||
| Majority | 2,228 | 5.01 | |||
| Turnout | 70.98 | ||||
| Conservative gain from Labour | Swing | ||||
Elections in the 1970s
| Party | Candidate | Votes | % | ± | |
|---|---|---|---|---|---|
| Labour | Harry Cowans | 10,395 | 67.28 | -4.49 | |
| Conservative | Piers Rolf Garfield Merchant | 2,982 | 19.30 | +2.75 | |
| Liberal | Andrew Steven Ellis | 2,073 | 13.42 | +1.74 | |
| Majority | 7,413 | 47.98 | |||
| Turnout | 65.25 | ||||
| Labour hold | Swing | -3.62 | |||
| Party | Candidate | Votes | % | ± | |
|---|---|---|---|---|---|
| Labour | Harry Cowans | 4,692 | 47.61 | -24.16 | |
| Liberal | Andrew Stephen Ellis | 2,854 | 28.96 | +17.28 | |
| Conservative | Richard Sowler | 1,945 | 19.73 | +3.18 | |
| Socialist Workers | David Hayes | 184 | 1.87 | N/A | |
| National Front | Bruce Anderson-Lynes | 181 | 1.84 | N/A | |
| Majority | 1,838 | 18.65 | |||
| Turnout | 9,856 | ||||
| Labour hold | Swing | ||||
| Party | Candidate | Votes | % | ± | |
|---|---|---|---|---|---|
| Labour | Rt Hon. Edward Watson Short | 10,546 | 71.8 | ||
| Conservative | Irene Sheila Faith | 2,432 | 16.6 | ||
| Liberal | Andrew Stephen Ellis | 1,716 | 11.7 | ||
| Majority | 8,108 | 55.2 | |||
| Turnout | 14,694 | 58.4 | |||
| Labour hold | Swing | ||||
| Party | Candidate | Votes | % | ± | |
|---|---|---|---|---|---|
| Labour | Rt Hon. Edward Watson Short | 12,182 | 74.45 | ||
| Conservative | Michael Jack | 4,180 | 25.55 | ||
| Majority | 8,002 | 48.91 | |||
| Turnout | 65.43 | ||||
| Labour hold | Swing | 0.1% | |||
| Party | Candidate | Votes | % | ± | |
|---|---|---|---|---|---|
| Labour | Rt Hon. Edward Watson Short | 13,671 | 70.61 | ||
| Conservative | Michael St John Way | 4,256 | 21.98 | ||
| Liberal | David Lesser | 1,433 | 7.40 | ||
| Majority | 9,415 | 48.63 | |||
| Turnout | 61.64 | ||||
| Labour hold | Swing | ||||
Elections in the 1960s
| Party | Candidate | Votes | % | ± | |
|---|---|---|---|---|---|
| Labour | Edward Watson Short | 19,291 | 76.65 | ||
| Conservative | J. J. Walker-Smith | 5,474 | 21.75 | ||
| Communist | T. G. Welch | 404 | 1.61 | ||
| Majority | 13,817 | 54.90 | |||
| Turnout | 65.87 | ||||
| Labour hold | Swing | ||||
| Party | Candidate | Votes | % | ± | |
|---|---|---|---|---|---|
| Labour | Edward Watson Short | 20,547 | 70.91 | ||
| Conservative | W. D. Rutter | 7,896 | 27.25 | ||
| Communist | T. G. Welch | 532 | 1.84 | ||
| Majority | 12,651 | 43.66 | |||
| Turnout | 69.13 | ||||
| Labour hold | Swing | ||||
Elections in the 1950s
| Party | Candidate | Votes | % | ± | |
|---|---|---|---|---|---|
| Labour | Edward Watson Short | 24,051 | 65.83 | ||
| Conservative | W. D. Rutter | 12,485 | 34.17 | ||
| Majority | 11,566 | 31.66 | |||
| Turnout | 73.18 | ||||
| Labour hold | Swing | ||||
| Party | Candidate | Votes | % | ± | |
|---|---|---|---|---|---|
| Labour | Edward Watson Short | 26,102 | 66.59 | ||
| Conservative | G. Peters | 13,099 | 33,41 | ||
| Majority | 13,003 | 33.17 | |||
| Turnout | 70.88 | ||||
| Labour hold | Swing | ||||
| Party | Candidate | Votes | % | ± | |
|---|---|---|---|---|---|
| Labour | Edward Watson Short | 25,637 | 64.14 | ||
| Conservative | F. T. Webster | 13,325 | 33.34 | ||
| Ind. Labour Party | Fred Barton | 1,006 | 2.52 | ||
| Majority | 12,312 | 30.80 | |||
| Turnout | 80.74 | ||||
| Labour hold | Swing | ||||
| Party | Candidate | Votes | % | ± | |
|---|---|---|---|---|---|
| Labour | Lyall Wilkes | 25,190 | 63.66 | ||
| Conservative | G. C. White | 13,567 | 34.29 | ||
| Ind. Labour Party | Fred Barton | 812 | 2.05 | ||
| Majority | 11,623 | 29.37 | |||
| Turnout | 79.80 | ||||
| Labour hold | Swing | ||||
Elections in the 1940s
| Party | Candidate | Votes | % | ± | |
|---|---|---|---|---|---|
| Labour | Lyall Wilkes | 10,627 | 61.92 | ||
| Conservative | Arthur Denville | 6,536 | 38.08 | ||
| Majority | 4,091 | 23.84 | |||
| Turnout | 71.75 | ||||
| Labour gain from Conservative | Swing | ||||
Elections in the 1930s
| Party | Candidate | Votes | % | ± | |
|---|---|---|---|---|---|
| Conservative | Alfred Arthur Hinchcliffe Denville | 15,826 | 59.28 | ||
| Labour | Walter Monslow | 10,871 | 40.72 | ||
| Majority | 4,955 | 18.56 | |||
| Turnout | 75.47 | ||||
| Conservative hold | Swing | ||||

| Party | Candidate | Votes | % | ± | |
|---|---|---|---|---|---|
| Conservative | Alfred Arthur Hinchcliffe Denville | 20,309 | 62.41 | ||
| Ind. Labour Party | Rt Hon. Sir Charles Trevelyan | 12,136 | 37.30 | ||
| National Labour | W.H.D. Caple | 94 | 0.29 | ||
| Majority | 8,173 | 25.12 | |||
| Turnout | 32,539 | 80.47 | |||
| Conservative gain from Labour | Swing | ||||
Elections in the 1920s
| Party | Candidate | Votes | % | ± | |
|---|---|---|---|---|---|
| Labour | Rt Hon. Sir Charles Philips Trevelyan | 17,580 | 57.2 | ||
| Unionist | Viscount Adare | 13,161 | 42.8 | ||
| Majority | 4,419 | 14.6 | |||
| Turnout | 30,740 | ||||
| Labour hold | Swing | ||||
| Party | Candidate | Votes | % | ± | |
|---|---|---|---|---|---|
| Labour | Charles Philips Trevelyan | 12,447 | 52.5 | ||
| Unionist | Francis Marion Bates Fisher | 11,260 | 47.5 | ||
| Majority | 1,187 | 5.0 | |||
| Turnout | 67.4 | ||||
| Labour hold | Swing | ||||
See also
Notes and references
- Notes
- ↑ A borough constituency (for the purposes of election expenses and type of returning officer)
- ↑ As with all constituencies, the constituency elects one Member of Parliament (MP) by the first past the post system of election at least every five years.
- References
- ↑ "Electorate Figures - Boundary Commission for England". 2011 Electorate Figures. Boundary Commission for England. 4 March 2011. Retrieved 13 March 2011.
- ↑ Constituency Profile The Guardian
- ↑ Unemployment statistics The Guardian
- ↑ Leigh Rayment's Historical List of MPs – Constituencies beginning with "N" (part 1)
- ↑ "Election Data 2015". Electoral Calculus. Archived from the original on 17 October 2015. Retrieved 17 October 2015.
- ↑ Wearmouth, Rachel (17 January 2015). "Young Geordie Tory from Heaton to battle Labour for Newcastle Central seat". Chronicle Live. Retrieved 31 January 2015.
- ↑ http://ukip-gatesheadnewcastle.org.uk/candidates.htm
- ↑ Tallentire, Mark (15 January 2015). "Greens name election candidates". The Northern Echo. Retrieved 31 January 2015.
- ↑ http://web.archive.org/web/20150213030710/http://ukip-gatesheadnewcastle.org.uk/candidates.htm
- ↑ "Election Data 2010". Electoral Calculus. Archived from the original on 17 October 2015. Retrieved 17 October 2015.
- ↑ "BBC NEWS – Election 2010 – Washington & Sunderland West". BBC News.
- ↑ "Election Data 2005". Electoral Calculus. Archived from the original on 15 October 2011. Retrieved 18 October 2015.
- ↑ "Election Data 2001". Electoral Calculus. Archived from the original on 15 October 2011. Retrieved 18 October 2015.
- ↑ "Election Data 1997". Electoral Calculus. Archived from the original on 15 October 2011. Retrieved 18 October 2015.
- ↑ "Election Data 1992". Electoral Calculus. Archived from the original on 15 October 2011. Retrieved 18 October 2015.
- ↑ "Politics Resources". Election 1992. Politics Resources. 9 April 1992. Retrieved 2010-12-06.
- ↑ "Election Data 1987". Electoral Calculus. Archived from the original on 15 October 2011. Retrieved 18 October 2015.
- ↑ "Election Data 1983". Electoral Calculus. Archived from the original on 15 October 2011. Retrieved 18 October 2015.
- ↑ "'Newcastle upon Tyne Central', Feb 1974 - May 1983". ElectionWeb Project. Cognitive Computing Limited. Retrieved 23 March 2016.
- ↑ British Parliamentary Election Results 1918-1949, FWS Craig
- ↑ British Parliamentary Election Results 1918-1949, FWS Craig