2014 Pacific hurricane season
 | |
| Season summary map | |
| First system formed | May 22, 2014 |
|---|---|
| Last system dissipated | November 5, 2014 |
| Strongest storm1 | Marie – 918 mbar (hPa) (27.11 inHg), 160 mph (260 km/h) |
| Total depressions | 23 |
| Total storms | 22 |
| Hurricanes | 16 (record high, tied with 1990,1992 and 2015) |
| Major hurricanes (Cat. 3+) | 9 |
| Total fatalities | 45 total |
| Total damage | $1.401 billion (2014 USD) |
| 1Strongest storm is determined by lowest pressure | |
2012, 2013, 2014, 2015, 2016 | |
| Related article | |
The 2014 Pacific hurricane season was an exceptionally active year with 22 named storms developing, ranking it as the fourth-busiest season since reliable records began in 1949. The season officially started on May 15 in the East Pacific Ocean, and on June 1 in the Central Pacific; they both ended on November 30. These dates conventionally delimit the period of each year when most tropical cyclones form in the Pacific basin. Entering the season, expectations were high, with most weather agencies predicting a near or above average season. The season began with an active start, with three tropical cyclones developing before June 15, including two Category 4 hurricanes, of which one became the strongest tropical cyclone ever recorded in May in the East Pacific. After a less active period in late June and early July, activity once again picked up in late July. Activity increased in August, which featured four major hurricanes, and persisted throughout September and October. However, activity finally waned by early November.
The 22 tropical storms marked the highest total in 22 years. In addition, a record-tying 16 hurricanes developed. Furthermore, there were total of nine major hurricanes, Category 3 or greater on the Saffir-Simpson Hurricane Wind Scale, including a record-tying eight in Eastern Pacific proper (east of 140°W).
The active season resulted in numerous records and highlights. First, Hurricane Amanda was the strongest May hurricane and earliest Category 4 on record. A month later, Hurricane Cristina became the earliest second major hurricane, although it was surpassed by Hurricane Blanca the following year. In August, Hurricane Iselle became the strongest tropical cyclone on record to strike the Big Island of Hawaii while Hurricane Marie was the first Category 5 Pacific hurricane since 2010. The following month, Hurricane Odile became the most destructive tropical cyclone of the season and the most intense and destructive tropical cyclone to make landfall over the Baja California peninsula.
Seasonal forecasts
| Record | Named storms |
Hurricanes | Major hurricanes |
Ref | |
|---|---|---|---|---|---|
| Average (1981-2010): | 15.4 | 7.6 | 3.2 | [1] | |
| Record high activity: | 1992: 27 | 2015: 16 | 2015: 11 | [2] | |
| Record low activity: | 2010: 8 | 2010: 3 | 2003: 0 | [2] | |
| Date | Source | Named storms |
Hurricanes | Major hurricanes |
Ref |
| March 12, 2014 | SMN | 15 | 7 | 3 | [3] |
| April 10, 2014 | SMN | 14 | 7 | 5 | [4] |
| May 22, 2014 | CPC | 14-20 | 7-11 | 3-6 | [5] |
| Area | Named storms | Hurricanes | Major hurricanes | Ref | |
| Actual activity: | EPAC | 20 | 15 | 9 | |
| Actual activity: | CPAC | 2 | 1 | 0 | |
| Actual activity: | 22 | 16 | 9 | ||
On March 12, 2014, the Servicio Meteorológico Nacional (SMN) issued its first outlook for the Pacific hurricane season, expecting a total of fifteen named storms, seven hurricanes, and three major hurricanes[nb 1].[3] A month later, the agency revised their outlook to fourteen named storms, seven hurricanes, and five major hurricanes, citing the anticipated development of El Niño for above-average activity, compared to the 1949-2013 average of 13.2,[4] On May 22, the Climate Prediction Center (CPC) announced its prediction of 14 to 20 named storms, seven to eleven hurricanes, three to six major hurricanes, and an Accumulated Cyclone Energy (ACE) within 95-160% of the median.[5] It also called for a 50% chance of an above-normal season, a 40% chance of a near-normal season, and a 10% chance of a below-normal season. Similar to the SMN outlook, the basis for the forecast was the expectation of below average wind shear and above average sea surface temperatures, both factors associated with El Niño conditions. The CPC also noted that the Eastern Pacific was in a lull that first began in 1995; however, they expected that this would be offset by the aforementioned favorable conditions.[6] Within the Central Pacific Hurricane Center (CPHC)'s jurisdiction, four to seven tropical cyclones were expected to form, slightly above the average of four to five tropical cyclones.[7]
Seasonal summary


| Most intense Pacific hurricanes[2] | ||||
|---|---|---|---|---|
| Hurricane | Year | Pressure | ||
| hPa | inHg | |||
| 1 | Patricia | 2015 | 872 | 25.75 |
| 2 | Linda | 1997 | 902 | 26.64 |
| 3 | Rick | 2009 | 906 | 26.76 |
| 4 | Kenna | 2002 | 913 | 26.96 |
| 5 | Ava | 1973 | 915 | 27.02 |
| Ioke | 2006 | |||
| 7 | Marie | 2014 | 918 | 27.11 |
| Odile | ||||
| 9 | Guillermo | 1997 | 919 | 27.14 |
| 10 | Gilma | 1994 | 920 | 27.17 |
| Listing is only for tropical cyclones in the Pacific Ocean north of the equator and east of the International Dateline | ||||
The well-above average activity in 2014 was reflected by an Accumulated Cyclone Energy (ACE) index of 159.895 units for the East Pacific and 38.49 units for the Central Pacific, giving a total of 198.385 units.[nb 2] The total ACE for the East Pacific was 43% above the 1981–2010 average and ranked as the seventh-highest since 1971.[8] The season's first named storm, Amanda, developed on May 23, shortly after the official start to the Pacific hurricane season on May 15. On May 24, the system intensified into a hurricane, transcending the climatological average date of June 26 for the first hurricane. The next day, Amanda attained major hurricane status, over a month sooner than the average date of July 19.[9] Owing to Amanda's extreme intensity the ACE value for May was the highest on record in the East Pacific at 18.6 units, eclipsing the previous record of 17.9 units set in 2001.[10][nb 2] Hurricane Cristina became the second's major hurricane, the system broke the previous record set by Hurricane Darby in 2010 which reached major status on June 25. However, this record was broken by Hurricane Blanca in 2015 which reached major status on June 3. Through June 14, the seasonal ACE reached its highest level since 1971, when reliable records began, for so early in the season. By the end of June, the ACE total remained at 230% of the normal value,[11] before subsiding to near-average levels to end July.[12] By late July, the basin became re-rejuvenated, with 3 systems forming during the final 10 days of the month. Activity in August ramped up significantly, with four hurricanes developing during the month, two of which became major hurricanes, excluding Iselle and Genevieve, which formed in July, but became a major hurricane during August. By the end of August, ACE values rose to 60% above the 30-year average.[13]
Continued, though less prolific, activity extended through September with four hurricanes developing that month. ACE values remained 45% above-average by the end of the month.[14] Following the rapid intensification of Hurricane Simon to a Category 3 hurricane during the afternoon of October 4, the 2014 season featured the highest number of major hurricanes in the Eastern Pacific basin since the advent of satellite imagery. With eight such storms east of 140°W, the year tied with the record set in the 1992 season.[15][16] However, this record was surpassed by the 2015 Pacific hurricane season.
Storms
Hurricane Amanda
| Category 4 hurricane (SSHWS) | |||
|---|---|---|---|
| |||
| Duration | May 22 – May 29 | ||
| Peak intensity | 155 mph (250 km/h) (1-min) 932 mbar (hPa) | ||
On May 19, the National Hurricane Center (NHC) began monitoring an area of disturbed weather south-southwest of the Gulf of Tehuantepec for potential tropical cyclogenesis. Steered west-northwest around a mid-level ridge over Mexico, the system steadily organized as deep convection increased and the low-pressure center became better defined; in accordance with a scatterometer pass, advisories were initiated on the first tropical depression of the season at 21:00 UTC on May 22.[17] The depression was upgraded to Tropical Storm Amanda eighteen hours later.[18] Amid a favorable atmospheric environment, the cyclone began a period of rapid deepening, marked by an increase in winds from 75 mph (120 km/h) at 15:00 UTC on May 24 to winds of 155 mph (255 km/h) at 15:00 UTC the next day, just shy of Category 5 strength. Shortly thereafter, an increase in wind shear and decrease in moisture and sea surface temperatures, led Amanda to a steady weakening trend. The cyclone weakened below major hurricane intensity at 03:00 UTC on May 27,[19] below hurricane intensity at 03:00 UTC on May 28,[20] and below tropical storm intensity at 15:00 UTC on May 29.[21] Six hours later, Amanda degenerated into a non-convective remnant low.[22]
Under the anticipation of heavy rains and landslides, weather alerts were issued for Guerrero and Manzanillo.[23][24][25] Thirty-four shelters opened in Michoacán while 80 opened in Guerrero.[26] Heavy rains occurred Guerrero, resulting in flooding.[27] A river near Coyuca de Benítez overflowed its banks. Three trees were brought down and a vehicle in Acapulco was destroyed.[28] Statewide, one person was killed when a tree that had fallen on the road resulted in a fatal car wreck.[27] In Colima, minor landslides occurred, resulting in the closure of Federal Highway 200.[26] Much of Michoacán was battered by large waves and heavy rains, resulting in two casualties.[29] Several roads were destroyed in Zitácuaro.[30] On May 25, Amanda became the second-earliest East Pacific major hurricane on record, behind 2012's Hurricane Bud.[31] Later that day, it also became the strongest May tropical cyclone in the Eastern Pacific basin in the satellite era,[32] eclipsing the previous record set by Hurricane Adolph in 2001, which had peak winds of 145 mph (230 km/h).[33]
Tropical Storm Boris
| Tropical storm (SSHWS) | |||
|---|---|---|---|
| |||
| Duration | June 2 – June 4 | ||
| Peak intensity | 45 mph (75 km/h) (1-min) 998 mbar (hPa) | ||


The formation of Boris is attributed to a low-level trough that entered the East Pacific from the southwestern Caribbean Sea on May 28. A broad area of low pressure developed in association with the trough south of the Mexico–Guatemala border two days later, and the disturbance steadily organized with aid from an eastward-moving convectively-coupled kelvin wave. By 18:00 UTC on June 2, the system acquired enough organization to be deemed a tropical depression. Tracking northward, the depression steadily became better defined as spiral bands developed over the eastern semicircle of the circulation. After intensifying into a tropical storm at 12:00 UTC on June 3 and attaining peak winds of 45 mph (75 km/h) six hours later, increasing land interaction caused Boris to begin weakening. It was downgraded to a tropical storm early on June 4 and subsequently degenerated into a remnant low at 18:00 UTC. The remnant low turned northwestward and dissipated shortly thereafter.[34]
Posing a considerable rainfall and mudslide threat to Guatemala, classes were suspended in nine school districts, impacting 1.25 million pupils.[35] Similarly, some classes were suspended in the Mexican states of Chiapas and Oaxaca.[36][37] In the former, roughly 16,000 people were evacuated out of hazardous areas.[38] Most of the impacts associated with Boris were due to its developing precursor, whose heavy rainfalls caused 20 mudslides, killing five and resulting in extensive property damage.[35][39] Heavy rainfall in Chiapas caused rivers to overflow their banks,[40] resulting in minor damage.[41] Overall, the effects of Tropical Storm Boris and its precursor killed six people across Central America.[35][42]
Hurricane Cristina
| Category 4 hurricane (SSHWS) | |||
|---|---|---|---|
| |||
| Duration | June 9 – June 15 | ||
| Peak intensity | 150 mph (240 km/h) (1-min) 935 mbar (hPa) | ||


A tropical wave emerged off the western coast of Africa on May 26 and traveled quickly westward, entering the East Pacific on June 5. Two days later, the wave merged with a preexisting area of low pressure and began to organize, aided by a convectively-coupled kelvin wave. As convective bands formed near and east of the center, the disturbance acquired enough organization to be declared a tropical depression by 12:00 UTC on June 9. Steered west-northwest around a ridge over Mexico, the depression only slowly organized due to moderate shear and was upgraded to Tropical Storm Cristina early the next day. Following a reprieve in upper-level winds, the cyclone intensified into a Category 1 hurricane at 06:00 UTC on June 11 and began a period of rapid deepening thereafter. Cristina was upgraded to a Category 4 hurricane at 12:00 UTC on June 12, the earliest instance of the second major hurricane on record in the East Pacific.[43] This broke the previous record set by Hurricane Darby in 2010 which reached major status on June 25, 2010. However, this record is broken by Hurricane Blanca in 2015 which reached major status on June 3, 2015. After attaining peak winds of 150 mph (240 km/h) early on June 12, an increasingly unfavorable environment caused the system to commence a weakening trend. At 12:00 UTC on June 14, Cristina was downgraded to a tropical storm; at 06:00 UTC the subsequent day, it was declared a remnant low after remaining devoid of deep convection. The remnant low continued west-northwestward until dissipating early on June 19.[43]
Under the anticipation of 12 ft (3.7 m) waves,[44] a "yellow" alert was issued for Colima, Guerrero, Oaxaca, and parts of Jalisco and Michoacan.[45] Along Manzanillo, strong waves resulted in minor flooding that damaged one road.[46]
Tropical Storm Douglas
| Tropical storm (SSHWS) | |||
|---|---|---|---|
| |||
| Duration | June 28 – July 5 | ||
| Peak intensity | 50 mph (85 km/h) (1-min) 999 mbar (hPa) | ||


A tropical wave emerged off the western coast of Africa on June 17, tracking across the Atlantic Ocean with inappreciable organization throughout the following days. The wave crossed Central America on June 25, where deep convective activity increased. On June 28, the disturbance became distinctively better defined with a well-defined center and spiral banding, signifying the formation of a tropical depression by 18:00 UTC while positioned about 345 mi (555 km) south-southwest of Manzanillo, Mexico. Steered west-northwest and eventually northwest under the influence of a mid-level ridge, the broad cyclone slowly intensified into a tropical storm by 00:00 UTC on June 30, attaining peak winds of 50 mph (85 km/h) late the next day. Thereafter, a track over cooler waters and into a drier environment caused the system to begin weakening; at 06:00 UTC on July 5, Douglas degenerated into a non-convective remnant low well west of Baja California. The remnant low turned slowly west-northwest prior to dissipating on July 8.[47]
Tropical Storm Elida
| Tropical storm (SSHWS) | |||
|---|---|---|---|
| |||
| Duration | June 30 – July 2 | ||
| Peak intensity | 50 mph (85 km/h) (1-min) 1002 mbar (hPa) | ||


A well-defined tropical wave moved emerged off the western coast Africa on June 20. After entering the East Pacific a week later, shower and thunderstorm activity began to increase. Although the system lacked a closed low initially, a small circulation was noted by 06:00 UTC on June 30, and the system was declared Tropical Storm Elida accordingly. Paralleling the southwestern coast of Mexico, the cyclone attained peak winds of 45 mph (75 km/h) before strong northwesterly wind shear from nearby Tropical Storm Douglas caused the storm to become disheveled. It weakened to a tropical depression at 00:00 UTC on July 2 and degenerated into a remnant low six hours later. The remnant low drifted southeastward before dissipating early on July 3.[48]
Tropical Storm Fausto
| Tropical storm (SSHWS) | |||
|---|---|---|---|
| |||
| Duration | July 7 – July 9 | ||
| Peak intensity | 45 mph (75 km/h) (1-min) 1004 mbar (hPa) | ||


A tropical wave moved off the western coast of Africa on June 22 and entered the East Pacific eight days later. On July 4, convection increased with the aid of a convectively-coupled kelvin wave, and two days later, a broad area of low pressure formed along the wave axis well south-southwest of Baja California. After further organization, the disturbance was declared a tropical depression at 12:00 UTC on July 7. Steered westward around a subtropical ridge, the depression intensified into Tropical Storm Fausto six hours later and simultaneously attained peak winds of 45 mph (75 km/h). By early on July 9, Fausto weakened to a tropical depression as dry air became entrained into the circulation. The low-level center opened up into a trough by 12:00 UTC, marking the demise of the cyclone.[49]
Tropical Storm Wali
| Tropical storm (SSHWS) | |||
|---|---|---|---|
| |||
| Duration | July 17 – July 18 | ||
| Peak intensity | 45 mph (75 km/h) (1-min) 1003 mbar (hPa) | ||


The NHC began monitoring a large area of disturbed weather in association with a tropical wave well southwest of the southern tip of the Baja California peninsula on July 13.[50] After crossing into the central Pacific, the disturbance gradually organized, and it acquired enough organization to be declared a tropical depression at 00:00 UTC on July 17.[51] An hour later, data from an ASCAT pass revealed winds up to 45 mph (75 km/h), and the depression was upgraded to Tropical Storm Wali.[52] Steered west-northwestward around a mid-level ridge to the cyclone's northeast, increasing wind shear caused the cloud pattern associated with Wali to become disorganized; at 18:00 UTC on July 18, the system was downgraded to a tropical depression,[51] and by 00:00 UTC the following afternoon, Wali was declared a remnant low after having been devoid of deep convection.[51]
Hurricane Genevieve
| Category 3 hurricane (SSHWS) | |||
|---|---|---|---|
| |||
| Duration | July 25 – August 7 (Exited basin) | ||
| Peak intensity | 115 mph (185 km/h) (1-min) 965 mbar (hPa) | ||


A small area of disturbed weather formed well south of Manzanillo, Mexico on July 20.[53] Tracking west-northwestward, deep convection developed about an area of low pressure, leading to the designation of Tropical Storm Genevieve at 09:00 UTC on July 25.[54] Persistent westerly wind shear caused the low-level center to become exposed to view by early the next day, and in junction with satellite intensity estimates, Genevieve weakened to a tropical depression at 15:00 UTC.[55] The center remained exposed as the storm entered the central Pacific, and the Central Pacific Hurricane Center declared the cyclone a remnant low at 03:00 UTC on July 28.[56] In spite of this, deep convection developed near the circulation once again during the afternoon hours of July 29, and Genevieve was upgraded to a tropical depression.[57] Although intensity guidance suggested the cyclone would slowly intensify into a tropical storm, deep convection faltered by 21:00 UTC on July 31, once again leading to the designation of a remnant low.[58]
Travelling west-southwestward around the south side of a subtropical ridge, deep convection became invigorated once again early on August 2, leading to the classification of Tropical Depression Genevieve for a second time at 15:00 UTC; amid a much improved upper-level pattern, gradual intensification was forecast.[59] The CPHC upgraded Genevieve to a tropical storm at 21:00 UTC on August 5 as curved bands developed north and west of the center.[60] Thereafter, the cyclone began an extraordinary period of intensification, with maximum sustained winds increasing from 75 mph (120 km/h) to 135 mph (215 km/h) in a 12-hour period as it crossed the International Dateline into the West Pacific.[61][62] Genevieve further intensified into a Category 5-equivalent typhoon at its peak.[63]
Hurricane Hernan
| Category 1 hurricane (SSHWS) | |||
|---|---|---|---|
| |||
| Duration | July 26 – July 29 | ||
| Peak intensity | 75 mph (120 km/h) (1-min) 992 mbar (hPa) | ||


A tropical wave moved off the western coast of Africa on July 12 and reached the East Pacific by July 21. Initially devoid of convection, shower and thunderstorm activity increased significantly a few days later, possibly due to the passage of a convectively-coupled kelvin wave. Following the development of a closed area of low pressure, the disturbance was designated as a tropical depression at 06:00 UTC on July 26 while located about 405 mi (650 km) southwest of Zihuatanejo, Mexico; twelve hours later, it was upgraded to Tropical Storm Hernan. Influenced by a mid-level ridge over the southern United States and Mexico, the cyclone moved west-northwest to northwest while quickly strengthening. At 18:00 UTC on July 27, Hernan intensified into a Category 1 hurricane and simultaneously attained peak winds of 75 mph (120 km/h). Thereafter, increasing westerly shear and cooling ocean temperatures caused the storm to begin weakening. Hernan was downgraded to a tropical storm at 06:00 UTC on July 28 and degenerated into a remnant low at 12:00 UTC the following day. The remnant low slowed and turned west prior to dissipating early on July 31.[64]
Hurricane Iselle
| Category 4 hurricane (SSHWS) | |||
|---|---|---|---|
| |||
| Duration | July 31 – August 9 | ||
| Peak intensity | 140 mph (220 km/h) (1-min) 947 mbar (hPa) | ||


Hurricane Iselle formed on July 31 about 1075 mi (1730 km) southwest of the southern tip of Baja California.[65][66] By 0900 UTC August 1, Iselle had developed deep convection in a central dense overcast, and the storm continued to intensify with only light-to-moderate wind shear and warm waters conducive for further development.[67] Iselle continued to travel on a west-northwestward track as it moved around the subtropical ridge to its north, and by 0300 UTC August 2, Iselle had intensified into a Category 1 hurricane with a well-defined eye and cold cloud tops in a small, dense central overcast.[68] Moderate vertical wind shear started to affect Iselle, with the storm's mid-level center being displaced to the south of the low-level center, but despite the shear, Iselle managed to further strengthen to Category 2 intensity by 2100 UTC August 2.[69][70] At 0300 UTC August 3, it was observed that there Iselle was still continuing to strengthen, with the central dense overcast continuing to become symmetric and the eye becoming better defined.[71] By 1500 UTC August 3, Iselle had intensified to a Category 3 hurricane.[72] Iselle began to take on a more circular shape, and Iselle's convective cloud tops began to expand as the storm's structure began to exhibit many characteristics of an annular hurricane.[73][74] Iselle continued to intensify as it tracked west, and by 1500 UTC August 4, Iselle had attained Category 4 intensity, with a 25-30 nm eye with convective cloud tops as cold as -75 °C surrounding it.[75]
Hurricane Julio
| Category 3 hurricane (SSHWS) | |||
|---|---|---|---|
| |||
| Duration | August 4 – August 15 | ||
| Peak intensity | 120 mph (195 km/h) (1-min) 960 mbar (hPa) | ||


On July 31, the NHC began monitoring disorganized convection in association with a tropical wave south of Acapulco, Mexico.[76] Thunderstorm activity increased and organized over subsequent days, leading to the formation of a tropical depression at 03:00 UTC on August 4,[77] and the designation of Tropical Storm Julio six hours later.[78] In conjunction with moderate northeasterly shear, little change in strength was observed initially; by early on August 6, however, atmospheric conditions became more favorable, and the cyclone was upgraded to a Category 1 hurricane.[79] With an improving satellite presentation, including a warm eye, Julio was upgraded to a Category 2 hurricane at 09:00 UTC on August 7,[80] and further to a Category 3 hurricane at 03:00 UTC the next day as the storm began to move into the Central Pacific.[81] After moving into the Central Pacific, Julio started to weaken due to colder waters and was downgraded to a Category 2 hurricane while heading west-northwestward.[82] As Julio turned northwest, avoiding Hawaii, southwesterly wind shear increased over the hurricane, downgrading it further to a tropical storm.[82] By late August 12 Julio restrenghened and was upgraded to a Category 1 as an eye-like feature appeared on radar due to the storm moving to more favorable conditions.[82] But as sson as Julio achieved a secondary peak intensity, drier mid-level air and strong upper-level winds weakened the cyclone and made it being downgraded into a tropical storm again.[82] Julio briefly turned north, before weakening into a tropical depression. The depression became an open circluation and the Central Pacific Hurricane Center downgraded it to a remnant low. The low's circulation became ragged, finally, the NHC and the CPHC downgraded the system to an area of low pressure.[82]
Hurricane Karina
| Category 1 hurricane (SSHWS) | |||
|---|---|---|---|
| |||
| Duration | August 13 – August 26 | ||
| Peak intensity | 85 mph (140 km/h) (1-min) 983 mbar (hPa) | ||


Tropical Depression Eleven-E formed on August 13. Six hours later while located 180 km south of Socorro Island, it was upgraded to Tropical Storm Karina. Karina had moved due west, and later intensified to a hurricane on August 15 with winds of 75 mph (120 km/h).[83] It then weakened to a tropical storm as it encountered unfavorable conditions,[84] then later rapidly weakened to a low-end tropical storm on the next day.[85] Thereafter, it steadily intensified to near hurricane strength, then had fluctuations in intensity while stalling before executing a loop and eventually re-intensifying to a hurricane on August 22 reaching a new peak intensity of 80 mph (130 km/h) on the next day. It then accelerated while turning northeast where interaction with Hurricane Lowell's remnants and a strengthening Marie led to the increase of wind shear exposing the cyclone's low-level circulation center, causing it to weaken to a tropical depression on August 25. Karina drifted southeastward, and increased wind shear from Hurricane Marie caused the system to weaken further. Karina became a remnant low on August 26 and the system made a large loop to the north-northeast, around Hurricane Marie's southern portion. Drifting northeast, Karina's remnants began merging into Marie and by August 28, 2014, Karina's remnants were absorbed into Marie. Karina's remnants caused convection to flare up inside Marie's wind span.[86]
According to the National Hurricane Center, Karina was the seventh longest lasting storm in the Pacific Ocean east of 140ºW.[87]
Hurricane Lowell
| Category 1 hurricane (SSHWS) | |||
|---|---|---|---|
| |||
| Duration | August 17 – August 24 | ||
| Peak intensity | 75 mph (120 km/h) (1-min) 980 mbar (hPa) | ||


The NHC began monitoring a trough of low pressure well west-southwest of Manzanillo, Mexico on August 15.[88] Within a favorable environment for development, the disturbance was upgraded to Tropical Depression Twelve-E at 03:00 UTC on August 18,[89] and further to Tropical Storm Lowell at 03:00 UTC the following day.[90] Steered northwestward in response to an upper-level trough over California, the cyclone steadily organized, with its satellite appearance consisting of a large ragged eye; at 15:00 UTC on August 21, Lowell intensified into a Category 1 hurricane and reached peak winds of 75 mph (120 km/h).[91] Thereafter, a track over cooler sea surface temperatures led to a steady weakening trend. At 03:00 UTC on August 22, the system was downgraded to a tropical storm,[92] and by early on August 24, Lowell no longer maintained the coverage and duration of convection to be considered a tropical cyclone. During this time, Lowell interacted with a strengthening Hurricane Karina, to its south.[93] During the next several days, Lowell's remnants continued to accelerate west-northwestward, while slowly diminishing.[94] On August 28, Lowell's remnant circulation collapsed, while situated at the eastern boundary of the Central Pacific basin.[95]
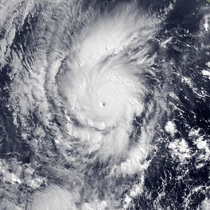
Hurricane Marie
| Category 5 hurricane (SSHWS) | |||
|---|---|---|---|
| |||
| Duration | August 22 – August 28 | ||
| Peak intensity | 160 mph (260 km/h) (1-min) 918 mbar (hPa) | ||


A broad area of low pressure formed several hundred miles south-southeast of the Gulf of Tehuantepec on August 19.[96] Tracking west-northwestward south of a mid-level ridge over the southern United States and northern Mexico, curved bands of deep convection organized about a well-defined center, leading to the formation of a tropical depression at 03:00 UTC on August 22;[97] six hours later, the depression was upgraded to Tropical Storm Marie.[98] With the storm situated over warm sea surface temperatures and in a low wind shear environment, Marie rapidly intensified almost immediately after being upgraded, becoming a Category 1 hurricane at 09:00 UTC on August 23,[99] a Category 2 hurricane at 03:00 UTC on August 24,[100] and a Category 4 hurricane at 09:00 UTC on August 25.[101] With satellite intensity estimates rising to T7.0/140kt, Marie was upgraded to a Category 5 hurricane at 21:00 UTC that day, the first since Hurricane Celia in 2010.[102] Succeeding peak intensity, a combination of drier air, cooler ocean temperatures, and the start of an eyewall replacement cycle all caused Marie to begin weakening: at 09:00 UTC on August 26, the storm fell below major hurricane intensity,[103] and at 21:00 UTC on August 27, the storm weakened below hurricane intensity.[104] After lacking deep convection over the center for several hours, Marie was downgraded to a remnant low early on August 29.[105]
Hurricane Norbert
| Category 3 hurricane (SSHWS) | |||
|---|---|---|---|
| |||
| Duration | September 2 – September 7 | ||
| Peak intensity | 125 mph (205 km/h) (1-min) 950 mbar (hPa) | ||

The NHC began monitoring a large area of disturbed weather in association with a trough of low pressure near the south-central coast of Mexico on August 31.[106] Amid a favorable atmospheric environment, the disturbance steadily organized and was acquired sufficient organization to be declared Tropical Storm Norbert at 15:00 UTC on September 2.[107] The cyclone moved generally northwestward following formation, steered on the southwestern side of a mid-level ridge over northern Mexico.[108] With a symmetric central dense overcast and curved bands wrapping into the center, Norbert was upgraded to a Category 1 hurricane at 03:00 UTC on September 4.[109] Initially steady state, the cyclone began a period of rapid deepening early on September 5, becoming a Category 2 hurricane at 00:00 UTC and a Category 3 hurricane at 06:00 UTC.[110][111] After attaining peak winds of 125 mph (205 km/h), the effects of cooler ocean temperatures began to weaken the system. Norbert weakened below major hurricane intensity at 21:00 UTC on September 6 and below hurricane intensity at 15:00 UTC on September 7.[112][113] After lacking deep, organized convection for over 12 hours, Norbert was declared post-tropical at 09:00 UTC on September 8.[114] During the next few days, Nobert's remnants made a northward loop, before dissipating on September 11.[115]
Hurricane Odile
| Category 4 hurricane (SSHWS) | |||
|---|---|---|---|
| |||
| Duration | September 10 – September 18 | ||
| Peak intensity | 140 mph (220 km/h) (1-min) 918 mbar (hPa) | ||


On September 7, the NHC began monitoring disorganized convection in association with a trough several hundred miles south of the Mexico coastline.[116] The disturbance gradually organized within an environment of moderate northeasterly wind shear, and it acquired sufficient organization to be declared a tropical depression at 0900 UTC on September 10.[117] Six hours later, it was upgraded to Tropical Storm Odile.[118] Over the coming days, only slow intensification occurred as upper-level winds remained unfavorable; by early on September 13, however, the satellite presentation began to change quickly, with the center fully embedded within a central dense overcast. In conjunction with satellite intensity estimates, the cyclone was upgraded to a Category 1 hurricane at 09:00 UTC.[119] Odile then began a period of rapid deepening, becoming a Category 2 hurricane at 00:00 UTC,[120] a Category 3 hurricane at 06:00 UTC,[121] and a Category 4 hurricane at 09:00 UTC on September 14.[122] After reaching peak winds of 135 mph (215 km/h), the start of an eyewall replacement cycle caused the system to weaken to a Category 3 hurricane.[123] Eight hours later, Odile made landfall near Cabo San Lucas with winds of 125 mph (205 km/h).[124] Over the next two days, Odile slowly weakened as it traversed the mountainous terrain of the Baja peninsula, and eventually re-emerged into the northern Gulf of California as a 50 mph (85 km/h) tropical storm on September 16.[125] The next day, after crossing the gulf, Odile made its final landfall in northwestern Mexico as a tropical depression, and lost tropical characteristics shortly thereafter.[126][127] These remnants would persist for a further two days before finally dissipating near the Arizona/New Mexico border on September 19.[128]
Tropical Depression Sixteen-E
| Tropical depression (SSHWS) | |||
|---|---|---|---|
| |||
| Duration | September 11 – September 15 | ||
| Peak intensity | 35 mph (55 km/h) (1-min) 1005 mbar (hPa) | ||


On September 9, the NHC began monitoring an area of low pressure that had formed well to the south-southwest of Baja California, though any immediate development of the system was not anticipated.[129] Over the next two days, the disturbance slowly began to organize, and on September 11, the NHC initiated advisories on Tropical Depression Sixteen-E.[130] Initially forecast to attain minimal tropical storm strength,[131] unfavorable outflow generated by the much larger Odile hindered any significant intensification.[132] Despite this hostile environment, the small depression continued to persist over the next few days while moving in a generally eastward direction.[133] But by September 15, Sixteen-E's circulation had become elongated and detached from what little deep convection remained. As a result, the NHC discontinued advisories on the system at 0300 UTC.[134]
Hurricane Polo
| Category 1 hurricane (SSHWS) | |||
|---|---|---|---|
| |||
| Duration | September 16 – September 22 | ||
| Peak intensity | 75 mph (120 km/h) (1-min) 979 mbar (hPa) | ||


The interaction of a westward-tracking tropical wave that emerged off the coast of Africa on September 4, an eastward-tracking kelvin wave, and an elongated surface trough led to the formation of Tropical Storm Polo by 00:00 UTC on September 16 about 310 mi (500 km) south of Puerto Escondido, Mexico. Tracking northwest within an environment conducive for strengthening, Polo intensified into a Category 1 hurricane and reached peak winds of 75 mph (120 km/h) by 00:00 UTC on September 18 as an eye became evident on satellite imagery. A sharp increase in wind shear quickly thereafter caused the storm's center to become exposed, and a reconnaissance mission indicated that Polo weakened to a tropical storm by 18:00 UTC that day. After maintaining intensity for about a day, the cyclone weakened to a tropical depression by 06:00 UTC on September 22 and further decreased into a remnant low six hours later. The low turned southwestward before dissipating well southwest of the southern tip of Baja California on September 26.[135]
One tourist was killed while going missing and three, including two fisherman, were missing in Guerrero. A total of 190 restaurants and 20 shops were damaged.[136] Damage totaled around $100 million MXN ($7.5 million USD).[137]
Hurricane Rachel
| Category 1 hurricane (SSHWS) | |||
|---|---|---|---|
| |||
| Duration | September 24 – September 30 | ||
| Peak intensity | 85 mph (140 km/h) (1-min) 980 mbar (hPa) | ||


On September 20, a low pressure area from Central America entered the Eastern Pacific Ocean.[138] With environmental conditions favorable for further intensification, the NHC gave the system a high probability of development as it continued to move west-northwestward.[139] On September 24, while situated about 285 mi (460 km) south-southwest of Manzanillo, Mexico, the system acquired enough organization for the NHC to declare it Tropical Depression Eighteen-E.[140] Roughly twelve hours later, the depression was upgraded to a tropical storm and given the name Rachel.[141] By September 27, an eye-like feature had begun to appear in infrared satellite imagery.[142] With the aforementioned eye becoming more apparent in visible imagery, surrounded by a convective ring of cooling cloud tops, Rachel was upgraded to a Category 1 hurricane, the thirteenth of the season, later that same day.[143] Two days later, as the result of increasing shear and a decrease in overall convection, Rachel was downgraded to a tropical storm.[144] By September 30, all deep convection had disappeared, and the system was further downgraded to a tropical depression.[145] Later on the same day, the NHC issued its final advisory on the system, as Rachel had degenerated into a remnant low.[146]
Hurricane Simon
| Category 4 hurricane (SSHWS) | |||
|---|---|---|---|
| |||
| Duration | October 1 – October 7 | ||
| Peak intensity | 130 mph (215 km/h) (1-min) 946 mbar (hPa) | ||


On September 27, the NHC began monitoring a broad area of low pressure that had formed off the coast of southeastern Mexico, and assessed its immediate development potential as low.[147] Over the next several days, the system slowly began to organize, and by October 1, it had acquired enough deep convection to be considered a tropical cyclone, at which time the NHC initiated advisories on Tropical Depression Nineteen-E.[148] By the next day, with banding features becoming better organized and the estimated center located directly below the deep convection, the depression was upgraded to Tropical Storm Simon, the eighteenth of the Eastern Pacific season and nineteenth overall.[149] Late on October 3, Simon's winds reached 75 mph (120 km/h), making it the fourteenth hurricane of the season.[150] The following day, Simon entered a period of rapid intensification and became the ninth major hurricane of the year, in the East Pacific basin.[151] Simon became a Category 4 hurricane, the sixth of the season, as it slowly turned northwest. The system weakened into a Category 3 storm as it turned northward. Simon entered a fast weakening trend and became a Category 1 hurricane by the following day. Simon turned truly north and was downgraded into a tropical storm, after the eye became cloud-filled and soon was unseen on radar. For the next two days, Simon remained a tropical storm. After veering northeast, the storm became a tropical depression and dissipated soon after. Although Simon had minimal effects on land as a tropical cyclone, remnant moisture from the storm brought rain to Mexico and the Southwestern United States.
Hurricane Ana
| Category 1 hurricane (SSHWS) | |||
|---|---|---|---|
| |||
| Duration | October 13 – October 26 | ||
| Peak intensity | 85 mph (140 km/h) (1-min) 985 mbar (hPa) | ||


An area of deep convection and a low pressure area merged and became Tropical Depression Two-C on October 13. It slowly intensified and turned northwestward, developing into Tropical Storm Ana. The storm continued intensifying and was upgraded to a strong tropical storm. Ana turned westward, strengthening into a Category 1 hurricane on October 17. As Ana kept south of the island chain, the hurricane produced large waves and winds. Consequently, the Central Pacific Hurricane Center initiated tropical storm watches. Ana was downgraded to a tropical storm very early on October 20.[152]
Beginning on October 15, various tropical cyclone warnings and watches were issued for Hawaii, starting with a tropical storm watch for the Big Island.[153] Three days later, a tropical storm warning was issued for Kauai and Nihau,[154] and was extended to include portions of the Papahānaumokuākea Marine National Monument.[155] The threat of the storm forced parks and beaches to close in the state.[156] While passing south of Hawaii, Ana produced heavy rainfall on most of the islands, peaking at 11.67 in (296 mm) at Keaumo on the Big Island.[157] The rains caused the Sand Island water treatment plant in Honolulu to overflow, which sent about 5,000 gallons of partially treated wastewater into Honolulu Harbor.[158] On October 25, Ana was downgraded to a tropical storm for the second time. Ana continued on a track to the northwest and weakened even further. The system eventually turned north and once again re-strengthened into a high-end tropical storm. Ana turned northwest and soon northeast, fluctuating in strength before being picked up by the Jet Stream. While racing off to the northeast at nearly 40 mph, Ana once again strengthened into a Category 1. After yet again being downgraded to a tropical storm, Ana became extratropical far to the northeast of Hawaii on October 26.[152]
Tropical Storm Trudy
| Tropical storm (SSHWS) | |||
|---|---|---|---|
| |||
| Duration | October 17 – October 19 | ||
| Peak intensity | 65 mph (100 km/h) (1-min) 998 mbar (hPa) | ||


A broad area of low pressure became established across the East Pacific during the first week of October. In conjunction with an eastward-moving convectively-coupled kelvin wave and a Tehuantepecer, a significant increase in convection in association with the low was observed. Following several days of consolidation, the disturbance acquired sufficient organization to be declared a tropical depression at 12:00 UTC on October 17; six hours later, it was upgraded to Tropical Storm Trudy. Amid an exceptionally favorable environment, Trudy quickly intensified as it moved north-northwestward, with the formation of an inner core and eye evident on conventional and microwave satellite imagery. At 09:15 UTC on October 18, the cyclone reached peak winds of 65 mph (100 km/h) as it moved ashore just southeast of Marquelia, Mexico. Trudy quickly weakened following landfall, weakening to a tropical depression at 18:00 UTC and dissipating by 06:00 UTC on October 19, while located over the mountains of southern Mexico. Trudy's remnant energy continued across Mexico and contributed to the development of Tropical Storm Hanna/Tropical Depression Nine on October 21, 2014.[159]
In preparation for the cyclone, various tropical cyclone watches and warnings were issued for the coastline of southeastern Mexico.[159] A "yellow" alert was initially activated for Guerrero;[160] however, following Trudy's period of rapid intensification, this was abruptly upgraded to a "red" alert for southeastern portions of the state as well as southwestern Oaxaca, and the remainder of the two states were placed under an "orange" alert.[161] Upon making landfall, torrential rainfall associated with the cyclone caused numerous landslides and flooding. Approximately 4,075 people were evacuated from the most-at-risk locations. A total of 5,000 homes were affected by the storm, 218 of which damaged and an additional six completely destroyed.[162] At the height of the storm, more than 20,000 households were without electricity.[163] A state of emergency was declared for 35 municipalities across Guerrero and 100 municipalities in Oaxaca.[164][165] Overall, Trudy was responsible for nine deaths: eight in Guerrero and one in Campeche.[166][167]
Hurricane Vance
| Category 2 hurricane (SSHWS) | |||
|---|---|---|---|
| |||
| Duration | October 30 – November 5 | ||
| Peak intensity | 110 mph (175 km/h) (1-min) 964 mbar (hPa) | ||

A cluster of thunderstorms consolidated with convection formed well southeast of Mexico on October 26. The area was first noted as a tropical disturbance by the NHC the next day. As it moved in a general westward direction, it was upgraded to Tropical Depression Twenty-One-E on October 30. On October 31, the depression was upgraded to Tropical Storm Vance. Although the system maintained its strength early on November 1, it then weakened due to some weakening cloud cover and convection. As predicted, Vance rapidly intensified and attained Category 2 strength on November 3. However, strong shear caused Vance to curve northward and weaken into a Category 1. On November 4, Vance started a slow weakening trend, becoming a weak Category 1 by the following day. Vance continued its weakening trend and veered northeastward. The NHC finally discontinued issuing advisories late on November 5, as Vance weakened into a remnant low.[168]
Heavy rains from the remnants of Vance, lasting 40 hours in some places,[169] damaged 2,490 homes across 7 municipalities in the Mexican state of Durango.[170] Flooding up to 1 m (3.3 ft) in depth affected ten homes in San Dimas. Thirty families in the area were evacuated due to the rising water. A few landslides were reported in the region, though no major damage resulted.[169]
Storm names
The following names were used to name storms that formed in the northeastern Pacific Ocean during 2014. Retired names, were announced by the World Meteorological Organization in the spring of 2015. The names not retired from this list will be used again in the 2020 season.[171] This is the same list used in the 2008 season with the exception of Amanda, which replaced Alma; the name Amanda was used for the first time this year.
|
For storms that form in the Central Pacific Hurricane Center's area of responsibility, encompassing the area between 140°W and the International Date Line, all names are used in a series of four rotating lists.[172] The next four names slated for use are shown below.
|
|
|
|
Retirement
On April 17, 2015, at the 37th session of the RA IV hurricane committee, the name Odile was retired due to the damage and deaths it caused and will not be used for another Pacific hurricane. Odile will be replaced with Odalys for the 2020 Pacific hurricane season.[173]
Season effects
This is a table of all of the storms that have formed in the 2014 Pacific hurricane season. It includes their duration, names, landfall(s), denoted in parenthesis, damages, and death totals. Deaths in parentheses are additional and indirect (an example of an indirect death would be a traffic accident), but were still related to that storm. Damage and deaths include totals while the storm was extratropical, a wave, or a low, and all of the damage figures are in 2014 USD.
| Storm name |
Dates active | Storm category
at peak intensity |
Max 1-min wind mph (km/h) |
Min. press. (mbar) |
Areas affected | Damage (millions USD) |
Deaths | |||
|---|---|---|---|---|---|---|---|---|---|---|
| Amanda | May 22 – May 29 | Category 4 hurricane | 155 (250) | 932 | Southwestern Mexico, Western Mexico | Minimal | 3 | |||
| Boris | June 2 – June 4 | Tropical storm | 45 (75) | 998 | Southwestern Mexico, Guatemala | 46.8 | 6 | |||
| Cristina | June 9 – June 15 | Category 4 hurricane | 150 (240) | 935 | Southwestern Mexico, Western Mexico | Minimal | None | |||
| Douglas | June 28 – July 5 | Tropical storm | 50 (85) | 999 | Clarion Island | Minor | None | |||
| Elida | June 30 – July 2 | Tropical storm | 50 (85) | 1002 | Western Mexico | None | None | |||
| Fausto | July 7 – July 9 | Tropical storm | 45 (75) | 1004 | None | None | None | |||
| Wali | July 17 – July 19 | Tropical storm | 45 (75) | 1003 | None | None | None | |||
| Genevieve | July 25 – August 7[nb 3] | Category 3 hurricane | 115 (185) | 965 | None | None | None | |||
| Hernan | July 26 – July 29 | Category 1 hurricane | 75 (120) | 992 | None | None | None | |||
| Iselle | July 31 – August 9 | Category 4 hurricane | 140 (220) | 947 | Hawaii | 79.2 | 1 | |||
| Julio | August 4 – August 15 | Category 3 hurricane | 120 (195) | 960 | None | None | None | |||
| Karina | August 13 – August 26 | Category 1 hurricane | 85 (140) | 983 | None | None | None | |||
| Lowell | August 17 – August 24 | Category 1 hurricane | 75 (120) | 980 | None | None | None | |||
| Marie | August 22 – August 28 | Category 5 hurricane | 160 (260) | 918 | Southwestern Mexico, Southern California | 20 | 6[174] | |||
| Norbert | September 2 – September 7 | Category 3 hurricane | 125 (205) | 950 | Western Mexico, Baja California Peninsula, Southwestern United States | 27.7 | 5 | |||
| Odile | September 10 – September 18 | Category 4 hurricane | 140 (220) | 918 | Western Mexico, Baja California Peninsula, Northwestern Mexico, Southwestern United States, Texas | 1220 | 15 | |||
| Sixteen-E | September 11 – September 15 | Tropical depression | 35 (55) | 1005 | None | None | None | |||
| Polo | September 16 – September 22 | Category 1 hurricane | 75 (120) | 979 | Western Mexico, Baja California Peninsula | 7.5 | 1 | |||
| Rachel | September 24 – September 30 | Category 1 hurricane | 85 (140) | 980 | None | None | None | |||
| Simon | October 1 – October 7 | Category 4 hurricane | 130 (215) | 946 | Western Mexico, Baja California Peninsula, Southwestern United States | Unknown | None | |||
| Ana | October 13 – October 26 | Category 1 hurricane | 85 (140) | 985 | Hawaii, Western Canada | Minimal | None | |||
| Trudy | October 17 – October 19 | Tropical storm | 65 (100) | 998 | Southwestern Mexico | Unknown | 8 | |||
| Vance | October 30 – November 5 | Category 2 hurricane | 110 (175) | 964 | Western Mexico, Northwestern Mexico | Minor | None | |||
| Season Aggregates | ||||||||||
| 23 cyclones | May 22 – November 5 | 160 (260) | 918 | 1401.2 | 45 | |||||
See also
- List of Pacific hurricanes
- List of Pacific hurricane seasons
- 2014 Atlantic hurricane season
- 2014 Pacific typhoon season
- 2014 North Indian Ocean cyclone season
- South-West Indian Ocean cyclone seasons: 2013–14, 2014–15
- Australian region cyclone seasons: 2013–14, 2014–15
- South Pacific cyclone seasons: 2013–14, 2014–15
Footnotes
- ↑ A major hurricane is a storm that ranks as Category 3 or higher on the Saffir–Simpson hurricane wind scale.
- 1 2 The totals represent the sum of the squares for every tropical storm's intensity of over 33 knots (38 mph, 61 km/h), divided by 10,000. Calculations are provided at Talk:2014 Pacific hurricane season/ACE calcs.
- ↑ Genevieve did not dissipate on August 7. It crossed the International Date Line, beyond which point it was then referred to as Typhoon Genevieve.
References
- ↑ "Background Information: East Pacific Hurricane Season". Climate Prediction Center. College Park, Maryland: National Oceanic and Atmospheric Administration. May 22, 2014. Retrieved May 29, 2014.
- 1 2 3 National Hurricane Center; Hurricane Research Division; Central Pacific Hurricane Center. "The Northeast and North Central Pacific hurricane database 1949–2015". United States National Oceanic and Atmospheric Administration's National Weather Service. A guide on how to read the database is available here.
- 1 2 Previsiones Meteorológicas Generales 2014 Ciclones Tropicales (PDF). Servicio Meteorológico Nacional (Report) (in Spanish). Servicio Meteorológico Nacional. March 12, 2014. Archived from the original on March 23, 2014. Retrieved May 29, 2014.
- 1 2 "Proyección de la Temporada de Tormentas Tropicales y Huracanes 2014 (PDF). Servicio Meteorológico Nacional (Report) (in Spanish). Servicio Meteorológico Nacional. April 10, 2014. Archived from the original (PDF) on May 29, 2014. Retrieved May 29, 2014.
- 1 2 "NOAA predicts near-normal or above-normal Eastern Pacific hurricane season". National Oceanic and Atmospheric Administration. National Oceanic and Atmospheric Administration. May 22, 2014. Retrieved May 29, 2014.
- ↑ "NOAA: 2014 Eastern Pacific Hurricane Season Outlook". Climate Prediction Center. National Oceanic and Atmospheric Administration. May 22, 2014.
- ↑ "NOAA expects near-normal or above-normal Central Pacific hurricane season". National Oceanic and Atmospheric Administration. National Oceanic and Atmospheric Administration. May 22, 2014. Retrieved May 29, 2014.
- ↑ Hurricane Specialists Unit (December 1, 2014). Monthly Tropical Weather Summary (.TXT). National Hurricane Center (Report). Miami, Florida: National Oceanic and Atmospheric Administration. Retrieved March 2, 2015.
- ↑ "Tropical Cyclone Climatology". National Hurricane Center. Miami, Florida: National Oceanic and Atmospheric Administration. Retrieved May 23, 2014.
- ↑ Hurricane Specialists Unit (June 1, 2014). Monthly Tropical Weather Summary (.TXT). National Hurricane Center (Report). Miami, Florida: National Oceanic and Atmospheric Administration. Retrieved March 2, 2015.
- ↑ Hurricane Specialist Unit (July 1, 2014). Monthly Tropical Weather Summary. National Hurricane Center (Report). Miami, Florida: National Oceanic and Atmospheric Administration. Retrieved August 13, 2014.
- ↑ Hurricane Specialist Unit (August 1, 2014). Monthly Tropical Weather Summary (.TXT). National Hurricane Center (Report). Miami, Florida: National Oceanic and Atmospheric Administration. Retrieved August 13, 2014.
- ↑ Hurricane Specialist Unit (September 1, 2014). Monthly Tropical Weather Summary (.TXT). National Hurricane Center (Report). Miami, Florida: National Oceanic and Atmospheric Administration. Retrieved September 2, 2014.
- ↑ Hurricane Specialists Unit (October 1, 2014). Monthly Tropical Weather Summary (.TXT). National Hurricane Center (Report). Miami, Florida: National Oceanic and Atmospheric Administration. Retrieved October 1, 2014.
- ↑ Daniel P. Brown (September 14, 2014). Hurricane Odile Discussion Number 17. National Hurricane Center (Report). Miami, Florida: National Oceanic and Atmospheric Administration. Retrieved September 14, 2014.
- ↑ Jack L. Beven II (October 4, 2014). Hurricane Simon Discussion Number 13. National Hurricane Center (Report). Miami, Florida: National Oceanic and Atmospheric Administration. Retrieved October 4, 2014.
- ↑ Robbie J. Berg (May 22, 2014). "Tropical Depression One Discussion Number 1". National Hurricane Center. Miami, Florida: National Oceanic and Atmospheric Administration. Retrieved August 28, 2014.
- ↑ Robbie J. Berg (May 23, 2014). "Tropical Storm Amanda Discussion Number 4". National Hurricane Center. Miami, Florida: National Oceanic and Atmospheric Administration. Retrieved August 28, 2014.
- ↑ Todd B. Kimberlain (May 26, 2014). "Hurricane Amanda Discussion Number 18". National Hurricane Center. Miami, Florida: National Oceanic and Atmospheric Administration. Retrieved August 28, 2014.
- ↑ Todd B. Kimberlain (May 27, 2014). "Tropical Storm Amanda Discussion Number 22". National Hurricane Center. Miami, Florida: National Oceanic and Atmospheric Administration. Retrieved August 28, 2014.
- ↑ John P. Cangialosi (May 29, 2014). "Tropical Depression Amanda Discussion Number 28". National Hurricane Center. Miami, Florida: National Oceanic and Atmospheric Administration. Retrieved August 28, 2014.
- ↑ John P. Cangialosi (May 29, 2014). "Post-Tropical Cyclone Amanda Discussion Number 29". National Hurricane Center. Miami, Florida: National Oceanic and Atmospheric Administration. Retrieved August 28, 2014.
- ↑ "'Amanda' provocará lluvias fuertes en Jalisco, Colima y Michoacán" [Amanda causes heavy rains in Jalisco, Colima and Michoacan]. El Universal (in Spanish). May 24, 2013. Retrieved May 24, 2014.
- ↑ "Guerrero emite alerta azul por tormenta Amanda" [Guerrero issues blue storm warning for Amanda]. El Universal (in Spanish). May 23, 2013. Retrieved May 24, 2014.
- ↑ ""Amanda" podría convertirse en huracán el domingo" ["Amanda" could become hurricane Sunday]. El Universal (in Spanish). May 24, 2013. Retrieved May 24, 2014.
- 1 2 "Huracán Amanda causa derrumbes en Colima" [Hurricane Amanda cause landslides in Colima]. El Universal (in Spanish). May 26, 2013. Retrieved May 28, 2014.
- 1 2 "Causa Amanda un muerto en Guerrero" [Cause Amanda dead in Guerrero]. El Universal (in Spanish). May 26, 2013. Retrieved May 28, 2014.
- ↑ "Amanda alcanza categoría 4; mantienen alerta" [Amanda reached category 4; remain alert]. El Universal (in Spanish). May 26, 2013. Retrieved May 28, 2014.
- ↑ "Lluvias de Amanda dejan dos muertos en Michoacán" [Amanda Rains leave two dead in Michoacan]. El Universal (in Spanish). May 28, 2013. Retrieved May 28, 2014.
- ↑ "Heavy rains caused by storm Amanda left three dead in Mexico" [Amanda Rains leave two dead in Michoacan]. Terra Noticas (in Spanish). May 28, 2013. Retrieved May 28, 2014.
- ↑ Michael J. Brennan (May 24, 2014). Hurricane Amanda Discussion Number 10. National Hurricane Center (Report). Miami, Florida: National Oceanic and Atmospheric Administration. Retrieved May 24, 2014.
- ↑ Stacy R. Stewart (May 25, 2014). Hurricane Amanda Public Advisory Number 12. National Hurricane Center (Report). Miami, Florida: National Oceanic and Atmospheric Administration. Retrieved May 25, 2014.
- ↑ Stacy R. Stewart (June 18, 2001). "Tropical Cyclone Report: Hurricane Adolph". National Hurricane Center. Miami, Florida: National Oceanic and Atmospheric Administration. Retrieved May 25, 2014.
- ↑ Daniel P. Brown (August 12, 2014). Tropical Cyclone Report: Tropical Storm Boris (PDF). National Hurricane Center (Report). Miami, Florida: National Oceanic and Atmospheric Administration. Retrieved September 9, 2014.
- 1 2 3 "Autoridades suspenden clases en 9 departamentos de Guatemala por lluvias" [Classes suspended by authorities in 9 of Guatemala's provinces due to rain]. Agency Guatemala de Noticas (in Spanish). June 2, 2014. Retrieved June 2, 2014.
- ↑ "Suspenden clases en Chiapas por posible huracán" [Classes suspended in Chiapas for possible hurricane]. La Prensa (in Spanish). June 2, 2014. Retrieved June 2, 2014.
- ↑ "Oaxaca: suspenden clases 50 municipios por Boris" [Oaxaca: classes suspended for 50 municipalities due to Boris]. El Universal (in Spanish). June 3, 2013. Retrieved June 3, 2014.
- ↑ "Evacuan a 16 mil chiapanecos por tormenta Boris" [16,000 evacuated in Chiapas prior to Boris]. El Universal (in Spanish). June 3, 2013. Retrieved June 3, 2014.
- ↑ "Guatemala confirma la formación de una depresión tropical en el Pacífico" [Guatemala confirms the formation of a tropical depression in the Pacific]. Alaniza Metropolitan News (in Spanish). June 2, 2014. Retrieved June 2, 2014.
- ↑ "Supervisan ríos y arroyos ante lluvias en Chiapas" [Rivers and streams monitored for rainfall in Chiapas]. El Universal (in Spanish). June 3, 2013. Retrieved June 3, 2014.
- ↑ "Chiapas reporta saldo blanco ante lluvias de Boris". El Universal (in Spanish). June 4, 2014. Retrieved June 10, 2013.
- ↑ "Inundaciones y un muerto, por lluvias" [Showers, flooding, and deaths]. El Universal (in Spanish). June 4, 2013. Retrieved June 4, 2014.
- 1 2 Eric S. Blake (August 21, 2014). Tropical Cyclone Report: Hurricane Cristina (PDF). National Hurricane Center (Report). Miami, Florida: National Oceanic and Atmospheric Administration. Retrieved September 9, 2014.
- ↑ "Guerrero mantiene alerta por lluvias de Cristina". El Universal. June 12, 2014. Retrieved June 12, 2014.
- ↑ "Guerrero mantiene alerta por lluvias de Cristina". El Universal. June 11, 2014. Retrieved June 12, 2014.
- ↑ "Reportan inundaciones en Manzanillo por Cristina". El Universal. June 12, 2014. Retrieved June 12, 2014.
- ↑ Richard J. Pasch (March 4, 2015). Tropical Cyclone Report: Tropical Storm Douglas (PDF). National Hurricane Center (Report). Miami, Florida: National Oceanic and Atmospheric Administration. Retrieved March 14, 2015.
- ↑ Lixion A. Avila (August 8, 2014). Tropical Cyclone Report: Tropical Storm Elida (PDF). National Hurricane Center (Report). Miami, Florida: National Oceanic and Atmospheric Administration. Retrieved September 9, 2014.
- ↑ John P. Cangialosi (August 31, 2014). Tropical Cyclone Report: Tropical Storm Fausto (PDF). National Hurricane Center (Report). Miami, Florida: National Oceanic and Atmospheric Administration. Retrieved September 9, 2014.
- ↑ Eric S. Blake (July 13, 2014). "Tropical Weather Outlook" (PDF). National Hurricane Center. Miami, Florida: National Oceanic and Atmospheric Administration. Retrieved September 13, 2014.
- 1 2 3 Jeff Powell (March 24, 2015). Tropical Cyclone Report: Tropical Storm Wali (DOC). Central Pacific Hurricane Center (Report). Honolulu, Hawaii: National Oceanic and Atmospheric Administration. Retrieved August 16, 2015.
- ↑ Derek Wroe (July 17, 2014). "Tropical Storm Wali Special Discussion Number 2". Central Pacific Hurricane Center. Honolulu, Hawaii: National Oceanic and Atmospheric Administration. Retrieved September 13, 2014.
- ↑ Richard J. Pasch (July 20, 2014). "Tropical Weather Outlook". National Hurricane Center. Miami, Florida: National Oceanic and Atmospheric Administration. Retrieved September 14, 2014.
- ↑ Robbie J. Berg (July 25, 2014). "Tropical Storm Genevieve Discussion Number 1". National Hurricane Center. Miami, Florida: National Oceanic and Atmospheric Administration. Retrieved September 14, 2014.
- ↑ Lixion A. Avila (July 26, 2014). "Tropical Depression Genevieve Discussion Number 6". National Hurricane Center. Miami, Florida: National Oceanic and Atmospheric Administration. Retrieved September 14, 2014.
- ↑ Tom Brichard (July 28, 2014). "Post-Tropical Cyclone Genevieve Discussion Number 12". Central Pacific Hurricane Center. Honolulu, Hawaii: National Oceanic and Atmospheric Administration. Retrieved September 14, 2014.
- ↑ Bob Burke (July 29, 2014). "Tropical Depression Genevieve Discussion Number 13". Central Pacific Hurricane Center. Honolulu, Hawaii: National Oceanic and Atmospheric Administration. Retrieved September 14, 2014.
- ↑ Bob Burke (July 29, 2014). "Post-Tropical Cyclone Genevieve Discussion Number 21". Central Pacific Hurricane Center. Honolulu, Hawaii: National Oceanic and Atmospheric Administration. Retrieved September 14, 2014.
- ↑ Samuel H. Houston (August 2, 2014). "Tropical Depression Genevieve Discussion Number 22". Central Pacific Hurricane Center. Honolulu, Hawaii: National Oceanic and Atmospheric Administration. Retrieved September 14, 2014.
- ↑ Tom Brichard (August 5, 2014). "Tropical Storm Genevieve Discussion Number 35". Central Pacific Hurricane Center. Honolulu, Hawaii: National Oceanic and Atmospheric Administration. Retrieved September 14, 2014.
- ↑ Samuel Houston; Chris Jacobson (August 6, 2014). "Hurricane Genevieve Discussion Number 38". Central Pacific Hurricane Center. Honolulu, Hawaii: National Oceanic and Atmospheric Administration. Retrieved September 14, 2014.
- ↑ Kevin Kodama (August 7, 2014). "Hurricane Genevieve Discussion Number 40". Central Pacific Hurricane Center. Honolulu, Hawaii: National Oceanic and Atmospheric Administration. Retrieved September 14, 2014.
- ↑ "Prognostic Reasoning for Super Typhoon 11W (Genevieve) Warning NR 42". Joint Typhoon Warning Center. Pearl Harbor, Hawaii: National Oceanic and Atmospheric Administration. August 7, 2014. Archived from the original on August 8, 2014. Retrieved September 14, 2014.
- ↑ Robbie J. Berg (October 7, 2014). Tropical Cyclone Report: Tropical Storm Hernan (PDF). National Hurricane Center (Report). Miami, Florida: National Oceanic and Atmospheric Administration. Retrieved January 10, 2015.
- ↑ Robbie Berg (July 31, 2014). Hurricane Iselle Discussion Number 1. National Hurricane Center (Report). Miami, Florida: National Oceanic and Atmospheric Administration. Retrieved July 31, 2014.
- ↑ Robbie J. Berg (July 31, 2014). Hurricane Iselle Public Advisory Number 1. National Hurricane Center (Report). Miami, Florida: National Oceanic and Atmospheric Administration. Retrieved August 4, 2014.
- ↑ Eric S. Blake (August 1, 2014). Tropical Storm Iselle Discussion Number 3. National Hurricane Center (Report). Miami, Florida: National Oceanic and Atmospheric Administration. Retrieved August 4, 2014.
- ↑ Todd B. Kimberlain (August 1, 2014). Hurricane Iselle Discussion Number 6. National Hurricane Center (Report). Miami, Florida: National Oceanic and Atmospheric Administration. Retrieved August 4, 2014.
- ↑ Robbie J. Berg (August 2, 2014). Hurricane Iselle Discussion Number 8. National Hurricane Center (Report). Miami, Florida: National Oceanic and Atmospheric Administration. Retrieved August 5, 2014.
- ↑ Robbie J. Berg (August 2, 2014). Hurricane Iselle Discussion Number 9. National Hurricane Center (Report). Miami, Florida: National Oceanic and Atmospheric Administration. Retrieved August 5, 2014.
- ↑ Todd B. Kimberlain (August 2, 2014). Hurricane Iselle Discussion Number 10. National Hurricane Center (Report). Miami, Florida: National Oceanic and Atmospheric Administration. Retrieved August 6, 2014.
- ↑ Robbie J. Berg (August 3, 2014). Hurricane Iselle Public Advisory Number 12. National Hurricane Center (Report). Miami, Florida: National Oceanic and Atmospheric Administration. Retrieved August 6, 2014.
- ↑ Robbie J. Berg (August 3, 2014). Hurricane Iselle Discussion Number 13. National Hurricane Center (Report). Miami, Florida: National Oceanic and Atmospheric Administration. Retrieved August 6, 2014.
- ↑ Todd B. Kimberlain (August 3, 2014). Hurricane Iselle Discussion Number 14. National Hurricane Center (Report). Miami, Florida: National Oceanic and Atmospheric Administration. Retrieved August 6, 2014.
- ↑ Robbie J. Berg (August 4, 2014). Hurricane Iselle Discussion Number 17. National Hurricane Center (Report). Miami, Florida: National Oceanic and Atmospheric Administration. Retrieved August 6, 2014.
- ↑ Robbie J. Berg (July 31, 2014). "Tropical Weather Outlook". National Hurricane Center. Miami, Florida: National Oceanic and Atmospheric Administration. Retrieved September 10, 2014.
- ↑ Todd B. Kimberlain (August 4, 2014). "Tropical Depression Ten-E Discussion Number 1". National Hurricane Center. Miami, Florida: National Oceanic and Atmospheric Administration. Retrieved September 10, 2014.
- ↑ Eric S. Blake (August 4, 2014). "Tropical Storm Julio Discussion Number 2". National Hurricane Center. Miami, Florida: National Oceanic and Atmospheric Administration. Retrieved September 10, 2014.
- ↑ Stacy R. Stewart (August 6, 2014). "Hurricane Julio Discussion Number 10". National Hurricane Center. Miami, Florida: National Oceanic and Atmospheric Administration. Retrieved September 10, 2014.
- ↑ Robbie J. Berg (August 7, 2014). "Hurricane Julio Discussion Number 14". National Hurricane Center. Miami, Florida: National Oceanic and Atmospheric Administration. Retrieved September 10, 2014.
- ↑ Eric S. Blake (August 8, 2014). "Hurricane Julio Discussion Number 17". National Hurricane Center. Miami, Florida: National Oceanic and Atmospheric Administration. Retrieved September 10, 2014.
- 1 2 3 4 5 Richard J. Pasch; Christopher Jacobson (February 11, 2016). Tropical Cyclone Report: Hurricane Julio (PDF). National Hurricane Center (Report). Miami, Florida: National Oceanic and Atmospheric Administration. Retrieved February 14, 2016.
- ↑ "Hurricane Karina Public Advisory Number 8".
- ↑ "Tropical Storm Karina Public Advisory Number 10".
- ↑ "Tropical Storm Karina Public Advisory Number 16".
- ↑ "Graphical Tropical Weather Outlook".
- ↑ "Tropical Depression Karina Discussion Number 56".
- ↑ Robbie J. Berg (August 15, 2014). "Tropical Weather Outlook". National Hurricane Center. Miami, Florida: National Oceanic and Atmospheric Administration. Retrieved September 13, 2014.
- ↑ Eric S. Blake (August 18, 2014). "Tropical Depression Twelve-E Discussion Number 1". National Hurricane Center. Miami, Florida: National Oceanic and Atmospheric Administration. Retrieved September 13, 2014.
- ↑ Eric S. Blake (August 19, 2014). "Tropical Storm Lowell Discussion Number 5". National Hurricane Center. Miami, Florida: National Oceanic and Atmospheric Administration. Retrieved September 13, 2014.
- ↑ Michael J. Brennan (August 21, 2014). "Hurricane Lowell Discussion Number 15". National Hurricane Center. Miami, Florida: National Oceanic and Atmospheric Administration. Retrieved September 13, 2014.
- ↑ Jack L. Beven II (August 22, 2014). "Tropical Storm Lowell Discussion Number 17". National Hurricane Center. Miami, Florida: National Oceanic and Atmospheric Administration. Retrieved September 13, 2014.
- ↑ Jack L. Beven II (August 24, 2014). "Post-Tropical Cyclone Lowell Discussion Number 25". National Hurricane Center. Miami, Florida: National Oceanic and Atmospheric Administration. Retrieved September 13, 2014.
- ↑ "Graphical Tropical Weather Outlook".
- ↑ "Graphical Tropical Weather Outlook".
- ↑ Stacy R. Stewart (August 19, 2014). "Tropical Weather Outlook". National Hurricane Center. Miami, Florida: National Oceanic and Atmospheric Administration. Retrieved September 13, 2014.
- ↑ Stacy R. Stewart (August 22, 2014). "Tropical Depression Thirteen-E Discussion Number 1". National Hurricane Center. Miami, Florida: National Oceanic and Atmospheric Administration. Retrieved September 13, 2014.
- ↑ Robbie J. Berg (August 22, 2014). "Tropical Storm Marie Discussion Number 2". National Hurricane Center. Miami, Florida: National Oceanic and Atmospheric Administration. Retrieved September 13, 2014.
- ↑ Dave Roberts (August 23, 2014). "Hurricane Marie Discussion Number 6". National Hurricane Center. Miami, Florida: National Oceanic and Atmospheric Administration. Retrieved September 13, 2014.
- ↑ Todd B. Kimberlain (August 24, 2014). "Hurricane Marie Discussion Number 9". National Hurricane Center. Miami, Florida: National Oceanic and Atmospheric Administration. Retrieved September 13, 2014.
- ↑ John P. Cangialosi (August 25, 2014). "Hurricane Marie Discussion Number 10". National Hurricane Center. Miami, Florida: National Oceanic and Atmospheric Administration. Retrieved September 13, 2014.
- ↑ Robbie J. Berg (August 24, 2014). "Hurricane Marie Discussion Number 12". National Hurricane Center. Miami, Florida: National Oceanic and Atmospheric Administration. Retrieved September 13, 2014.
- ↑ John P. Cangialosi (August 26, 2014). "Hurricane Marie Discussion Number 18". National Hurricane Center. Miami, Florida: National Oceanic and Atmospheric Administration. Retrieved September 13, 2014.
- ↑ Daniel P. Brown (August 27, 2014). "Tropical Storm Marie Discussion Number 24". National Hurricane Center. Miami, Florida: National Oceanic and Atmospheric Administration. Retrieved September 13, 2014.
- ↑ Eric S. Blake (August 29, 2014). "Post-Tropical Cyclone Marie Discussion Number 30". National Hurricane Center. Miami, Florida: National Oceanic and Atmospheric Administration. Retrieved September 13, 2014.
- ↑ Todd B. Kimberlain (August 31, 2014). "Tropical Weather Outlook". National Hurricane Center. Miami, Florida: National Oceanic and Atmospheric Administration. Retrieved September 7, 2014.
- ↑ Eric S. Blake (September 2, 2014). "Tropical Storm Norbert Discussion Number 1". National Hurricane Center. Miami, Florida: National Oceanic and Administration. Retrieved September 7, 2014.
- ↑ Stacy R. Stewart (September 3, 2014). "Tropical Storm Norbert Discussion Number 4". National Hurricane Center. Miami, Florida: National Oceanic and Atmospheric Administration. Retrieved September 7, 2014.
- ↑ Daniel P. Brown (September 4, 2014). "Hurricane Norbert Discussion Number 7". National Hurricane Center. Miami, Florida: National Oceanic and Atmospheric Administration. Retrieved September 7, 2014.
- ↑ Michael J. Brennan (September 6, 2014). "Hurricane Norbert Intermediate Advisory Number 14A". National Hurricane Center. Miami, Florida: National Oceanic and Atmospheric Administration. Retrieved September 7, 2014.
- ↑ Jack L. Beven II (September 6, 2014). "Hurricane Norbert Intermediate Advisory Number 15A". National Hurricane Center. Miami, Florida: National Oceanic and Atmospheric Administration. Retrieved September 7, 2014.
- ↑ Lixion A. Avila (September 6, 2014). "Hurricane Norbert Discussion Number 18". National Hurricane Center. Miami, Florida: National Oceanic and Atmospheric Administration. Retrieved September 7, 2014.
- ↑ John P. Cangialosi (September 4, 2014). "Tropical Storm Norbert Discussion Number 21". National Hurricane Center. Miami, Florida: National Oceanic and Atmospheric Administration. Retrieved September 7, 2014.
- ↑ Todd B. Kimberlain (September 8, 2014). "Post-Tropical Cyclone Norbert Discussion Number 24". National Hurricane Center. Miami, Florida: National Oceanic and Atmospheric Administration. Retrieved September 8, 2014.
- ↑ Hurricane Nobert Tropical Cyclone Report
- ↑ Daniel P. Brown (September 7, 2014). "Tropical Weather Outlook". National Hurricane Center. Miami, Florida: National Oceanic and Atmospheric Administration. Retrieved September 10, 2014.
- ↑ Michael J. Brennan (September 10, 2014). "Tropical Depression Fifteen-E Discussion Number 1". Miami, Florida: National Oceanic and Atmospheric Administration. Retrieved September 10, 2014.
- ↑ John P. Cangialosi (September 10, 2014). "Tropical Storm Odile Discussion Number 2". Miami, Florida: National Oceanic and Atmospheric Administration. Retrieved September 10, 2014.
- ↑ Michael J. Brennan (September 13, 2014). "Hurricane Odile Discussion Number 13". Miami, Florida: National Oceanic and Atmospheric Administration. Retrieved September 10, 2014.
- ↑ Jack L. Beven II (September 14, 2014). "Hurricane Odile Intermediate Advisory Number 15A". Miami, Florida: National Oceanic and Atmospheric Administration. Retrieved September 14, 2014.
- ↑ Daniel P. Brown (September 14, 2014). "Hurricane Odile Intermediate Advisory Number 16A". Miami, Florida: National Oceanic and Atmospheric Administration. Retrieved September 14, 2014.
- ↑ Daniel P. Brown (September 14, 2014). "Hurricane Odile Discussion Number 17". Miami, Florida: National Oceanic and Atmospheric Administration. Retrieved September 14, 2014.
- ↑ Stacy R. Stewart (September 14, 2014). "Hurricane Odile Discussion Number 19". Miami, Florida: National Oceanic and Atmospheric Administration. Retrieved September 14, 2014.
- ↑ Daniel Brown/Christopher Landsea (September 14, 2014). "Hurricane Odile Tropical Cyclone Update". Miami, Florida: National Oceanic and Atmospheric Administration. Retrieved October 4, 2014.
- ↑ Richard Pasch (September 16, 2014). "Tropical Storm Odile Intermediate Advisory Number 27A". Miami, Florida: National Oceanic and Atmospheric Administration. Retrieved October 4, 2014.
- ↑ Stacy R. Stewart (September 17, 2014). "Tropical Depression Odile Advisory Number 30A". Miami, Florida: National Oceanic and Atmospheric Administration. Retrieved October 4, 2014.
- ↑ Stacy R. Stewart (September 17, 2014). "Remnants of Odile Advisory Number 31". Miami, Florida: National Oceanic and Atmospheric Administration. Retrieved October 4, 2014.
- ↑ Jason Krekeler (September 19, 2014). "Remnants of Odile Advisory Number 37". College Park, Maryland: Weather Prediction Center. Retrieved October 4, 2014.
- ↑ John P. Cangialosi. "Tropical Weather Outlook". National Hurricane Center. Retrieved October 4, 2014.
- ↑ Todd B. Kimberlain. "Tropical Depression Sixteen-E Special Advisory Number 1". National Hurricane Center. Retrieved October 4, 2014.
- ↑ Todd B. Kimberlain. "Tropical Depression Sixteen-E Special Discussion Number 1". National Hurricane Center. Retrieved October 4, 2014.
- ↑ Richard Pasch. "Tropical Depression Sixteen-E Discussion Number 6". National Hurricane Center. Retrieved October 4, 2014.
- ↑ Stacy R. Stewart. "Tropical Depression Sixteen-E Discussion Number 13". National Hurricane Center. Retrieved October 4, 2014.
- ↑ James Franklin. "Remnants of Sixteen-E Discussion Number 15". National Hurricane Center. Retrieved October 4, 2014.
- ↑ Robbie J. Berg (January 24, 2015). Tropical Cyclone Report: Hurricane Polo (PDF) (Report). Miami, Florida: National Hurricane Center. Retrieved January 16, 2016.
- ↑ "Huracán Polo deja numerosos daños en Guerrero". Altonivel (in Spanish). September 19, 2014. Retrieved September 25, 2014.
- ↑ "Huracán Polo deja numerosos daños en Guerrero". Quadtarain Mexico (in Spanish). September 23, 2014. Retrieved September 25, 2014.
- ↑ Todd B. Kimberlain. "Graphical Tropical Weather Outlook". National Hurricane Center. Retrieved 24 September 2014.
- ↑ Todd B. Kimberlain. "Graphical Tropical Weather Outlook". National Hurricane Center. Retrieved 24 September 2014.
- ↑ Brown. "Tropical Depression Eighteen-E Advisory Number 1". National Hurricane Center. Retrieved 24 September 2014.
- ↑ Christopher W. Landsea. "Tropical Storm Rachel Discussion Number 3". National Hurricane Center. Retrieved 24 September 2014.
- ↑ Robbie J. Berg. "Tropical Storm Rachel Discussion Number 12". National Hurricane Center. Retrieved 27 September 2014.
- ↑ Michael J. Brennan. "Hurricane Rachel Discussion Number 14". National Hurricane Center. Retrieved 27 September 2014.
- ↑ Todd B. Kimberlain/Jeffrey Lewitsky. "Tropical Storm Rachel Discussion Number 21". National Hurricane Center. Retrieved 30 September 2014.
- ↑ Todd B. Kimberlain/Nelsie Ramos. "Tropical Depression Rachel Discussion Number 25". National Hurricane Center. Retrieved 30 September 2014.
- ↑ John P. Cangialosi/Nelsie Ramos. "Post-Tropical Cyclone Rachel Discussion Number 26". National Hurricane Center. Retrieved 30 September 2014.
- ↑ Michael J. Brennan. "Graphical Tropical Weather Outlook". National Hurricane Center. Retrieved 1 October 2014.
- ↑ Michael J. Brennan. "Tropical Depression Nineteen-E Discussion Number 1". National Hurricane Center. Retrieved 1 October 2014.
- ↑ John P. Cangialosi. "Tropical Storm Simon Discussion Number 3". National Hurricane Center. Retrieved 2 October 2014.
- ↑ Lixion Avila. "Hurricane Simon Discussion Number 10". National Hurricane Center. Retrieved 3 October 2014.
- ↑ Jack L. Beven II. "Hurricane Simon Tropical Cyclone Update". National Hurricane Center. Retrieved October 4, 2014.
- 1 2 Jeff Powell (July 17, 2015). Tropical Cyclone Report: Hurricane Ana (DOC). Central Pacific Hurricane Center (Report). Honolulu, Hawaii: National Oceanic and Atmospheric Administration. Retrieved August 16, 2015.
- ↑ Kodama (October 15, 2014). "Tropical Storm Ana Advisory Number 10". Central Pacific Hurricane Center. Retrieved October 21, 2014.
- ↑ Wroe (October 18, 2014). "Hurricane Ana Advisory Number 22". Central Pacific Hurricane Center. Retrieved October 21, 2014.
- ↑ Powell (October 19, 2014). "Hurricane Ana Advisory Number 25". Central Pacific Hurricane Center. Retrieved October 21, 2014.
- ↑ Kurtis Lee (October 19, 2014). "Hurricane Ana weakens, moves west of Hawaii". Los Angeles Times. Retrieved October 21, 2014.
- ↑ "Hurricane Ana Rainfall Totals". Honolulu, Hawaii National Weather Service. October 19, 2014. Archived from the original on October 21, 2014.
- ↑ Jim Mendoza (October 21, 2014). "Hurricane triggers sewage spill". WWLP.com. Retrieved October 21, 2014.
- 1 2 Daniel P. Brown (December 2, 2014). Tropical Cyclone Report: Tropical Storm Trudy (PDF). National Hurricane Center (Report). Miami, Florida: National Oceanic and Atmospheric Administration. Retrieved January 10, 2015.
- ↑ Liliana Alcántara (October 17, 2014). "Emiten zona de alerta por tormenta tropical en Guerrero". El Universal (in Spanish). Retrieved January 10, 2015.
- ↑ "Emiten alerta roja para zonas de Guerrero y Oaxaca por Trudy". El Universal (in Spanish). October 18, 2014. Retrieved January 10, 2015.
- ↑ Laura Reyes (October 19, 2014). "'Trudy' causa seis muertos tras su paso por Guerrero y Oaxaca". Reuters (in Spanish). CNN México. Retrieved January 10, 2015.
- ↑ "Restablecido 91% de suministro eléctrico en Guerrero". Notimex (in Spanish). El Financiero. October 19, 2014. Retrieved January 10, 2015.
- ↑ David Vicenteño; Rolando Aguilar (October 19, 2014). "Declaran emergencia en 35 municipios de Guerrero por Trudy". Excélsior (in Spanish). Retrieved January 10, 2015.
- ↑ "En emergencia 100 municipios de Oaxaca por la tormenta "Trudy"". Notimex (in Spanish). Economía Hoy. October 21, 2014. Retrieved January 10, 2015.
- ↑ Arturo Márquez (October 23, 2014). "Suman 8 muertos en Guerrero por 'Trudy'; comunidades continúan incomunicadas". Noticieros Televisa (in Spanish). Noticieros Televisa. Retrieved January 10, 2015.
- ↑ "Tormenta Tropical Trudy deja un muerto en Campeche". SDP Noticias (in Spanish). SDP Noticias. October 21, 2014. Retrieved January 10, 2015.
- ↑ "Hurricane Vance Recap: Another Mexico Landfall". Weather Underground. 2014-09-05. Retrieved 2015-10-17.
- 1 2 Víctor Blanco (November 6, 2014). ""Vance" causa daños en todo el Estado" (in Spanish). Organización Editorial Mexicana. Retrieved February 24, 2015.
- ↑ Rosy Gaucín (November 10, 2014). "'Vance' deja daños en 7 municipios de Durango" (in Spanish). El Siglo de Durango. Retrieved February 24, 2015.
- ↑ "Tropical Cyclone Names". National Hurricane Center. National Oceanic and Atmospheric Administration. 2013-04-11. Archived from the original on May 8, 2013. Retrieved May 8, 2013.
- ↑ "Pacific Tropical Cyclone Names" (PHP). Central Pacific Hurricane Center. National Oceanic and Atmospheric Administration. April 11, 2013. Archived from the original on May 8, 2013. Retrieved May 8, 2013.
- ↑ "'Isis' among names removed from UN list of hurricane names". Reuters. April 17, 2015. Retrieved April 17, 2015.
- ↑ Antonio Vázquez López (August 25, 2014). "Marie causa la muerte de dos personas en la Costalegre de Jalisco" (in Spanish). Notisistema. Retrieved August 28, 2014.
External links
| Wikimedia Commons has media related to 2014 Pacific hurricane season. |
- National Hurricane Center Website
- 2014 Eastern Pacific Hurricane Season Annual Summary
- Servicio Meteorológico Nacional Website (Spanish)
Tropical cyclones of the 2014 Pacific hurricane season | ||
|---|---|---|
| ||
| ||