Gower (UK Parliament constituency)
Coordinates: 51°37′12″N 4°08′13″W / 51.620°N 4.137°W
| Gower | |
|---|---|
|
constituency for the House of Commons | |
|
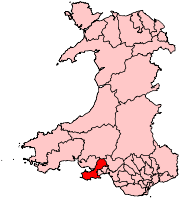
Boundary of Gower in Wales. | |
| Preserved county | West Glamorgan |
| Electorate | 62,389 (December 2010)[1] |
| Major settlements | Mumbles, Clydach, Pontarddulais, Penllergaer |
| Current constituency | |
| Created | 1885 |
| Member of parliament | Byron Davies (Conservative) |
| Number of members | One |
| Created from | Glamorganshire |
| Overlaps | |
| Welsh Assembly | South Wales West |
| European Parliament constituency | Wales |
Gower (Welsh: Gŵyr) is represented in the House of Commons of the Parliament of the United Kingdom by one member of parliament (MP). Byron Davies is the current MP after winning, by only 27 votes, in the 2015 UK General Election.
Overview
The constituency was first created in 1885 and has existed in various forms ever since. Before 2015 it had elected only Labour MPs since 1906, at the time the longest run (with Normanton and Makerfield) of any British constituency. It is one of three parliamentary seats representing the city and county of Swansea, the others being Swansea West and Swansea East.
Boundaries
1885-1918: The Municipal Borough of Swansea, and the Sessional Divisions of Gower, Pontardawe, and Swansea.
1918-1950: The Urban District of Oystermouth, and the Rural Districts of Gower and Swansea.
1950-1983: The Urban District of Llwchwr, and the Rural Districts of Gower and Pontardawe.
1983-2010: The City of Swansea wards of Bishopston, Fairwood, Gower, Newton, Oystermouth, Penclawdd, Pennard, and West Cross, and the Borough of Lliw Valley wards of Clydach, Dulais East, Gorseinon Central, Gorseinon East, Gowerton East, Gowerton West, Graigfelin, Kingsbridge, Llangyfelach, Lower Loughor, Mawr, Penllergaer, Penyrheol, Pontardulais, Tal-y-bont, Upper Loughor, and Vardre.
2010-present: The Swansea County electoral divisions of Bishopston, Clydach, Fairwood, Gorseinon, Gower, Gowerton, Kingsbridge, Llangyfelach, Lower Loughor, Mawr, Newton, Oystermouth, Penclawdd, Penllergaer, Pennard, Penyrheol, Pontardulais, Upper Loughor, and West Cross.
The constituency encompasses most of the old Lordship of Gower (less the city of Swansea) and covers the inner Gower Peninsula and outer Gower areas including Clydach, Gowerton, Gorseinon, Felindre and Garnswllt.
History
Liberals and Labour 1885-1918
The first years of the constituency saw a struggle between the Liberals and those who favoured direct labour representation. Although its new electors in 1885 were predominantly the miners and tinplaters of the Swansea Valley, the new MP was Frank Ash Yeo, a local colliery owner and clearly an upper-class figure.[2] In 1885 he comfortably defeated Henry Nathaniel Miers of Ynyspenllwch in the Swansea Valley, a coal owner, tinplate manufacturer and landowner.[3]
| Party | Candidate | Votes | % | ± | |
|---|---|---|---|---|---|
| Liberal | Frank Ash Yeo | 5,560 | |||
| Conservative | Henry Nathaniel Miers | 2,103 | - | ||
| Majority | 3,457 | ||||
| Turnout | 72.6 | ||||
| Liberal win (new seat) | |||||
On Yeo's death in 1888, representatives of the trade unions in the constituency overturned the Liberal association's choice of Sir Horace Davey and ensured the selection of David Randell as candidate. Randell was a Methodist solicitor who specialised in trade union litigation and his victory, albeit with a reduced majority over John Dillwyn Llewellyn, formed the basis of later claims that Gower was a 'labour' seat.[2]
2015 General Election
The defeat of Labour's 2015 candidate, Liz Evans by Byron Davies, in the 2015 General Election, by only 27 votes, was the narrowest victory across the whole country, making it the most marginal Conservative gain. Subsequently, Davies' victory brought 105 consecutive years of Labour representation to an end.
Members of Parliament
Elections
Elections in the 2010s
| Party | Candidate | Votes | % | ± | |
|---|---|---|---|---|---|
| Conservative | Byron Davies | 15,862 | 37.1 | +5.1 | |
| Labour | Liz Evans | 15,835 | 37.0 | -1.4 | |
| UKIP | Colin Beckett | 4,773 | 11.2 | +9.6 | |
| Plaid Cymru | Darren Thomas | 3,051 | 7.1 | +0.5 | |
| Liberal Democrats | Mike Sheehan | 1,552 | 3.6 | -15.4 | |
| Green | Julia Marshall | 1,161 | 2.7 | n/a | |
| Monster Raving Loony | Baron Barnes Von Claptrap | 253 | 0.6 | n/a | |
| Independent | Steve Roberts | 168 | 0.4 | n/a | |
| TUSC | Mark Evans | 103 | 0.2 | n/a | |
| Majority | 27 | 0.1 | |||
| Turnout | 42,758 | 69.2 | +1.7 | ||
| Conservative gain from Labour | Swing | +3.2 | |||
| Party | Candidate | Votes | % | ± | |
|---|---|---|---|---|---|
| Labour | Martin Caton | 16,016 | 38.4 | -4.0 | |
| Conservative | Byron Davies | 13,333 | 32.0 | +6.5 | |
| Liberal Democrats | Mike Day | 7,947 | 19.1 | +0.6 | |
| Plaid Cymru | Darren Price | 2,760 | 6.6 | -1.2 | |
| BNP | Adrian Jones | 963 | 2.3 | N/A | |
| UKIP | Gordon Triggs | 652 | 1.6 | -1.6 | |
| Majority | 2,683 | 6.4 | |||
| Turnout | 41,671 | 67.5 | +2.1 | ||
| Labour hold | Swing | -5.3 | |||
Elections in the 2000s
| Party | Candidate | Votes | % | ± | |
|---|---|---|---|---|---|
| Labour | Martin Caton | 16,786 | 42.5 | -4.8 | |
| Conservative | Mike Murray | 10,083 | 25.5 | -2.0 | |
| Liberal Democrats | Nick Tregoning | 7,291 | 18.4 | +6.3 | |
| Plaid Cymru | Sian Caiach | 3,089 | 7.8 | -2.5 | |
| UKIP | Richard Lewis | 1,264 | 3.2 | +3.2 | |
| Green | Rhodri Griffiths | 1,029 | 2.6 | +1.0 | |
| Majority | 6,703 | 17.0 | |||
| Turnout | 39,542 | 64.9 | +1.5 | ||
| Labour hold | Swing | -1.4 | |||
| Party | Candidate | Votes | % | ± | |
|---|---|---|---|---|---|
| Labour | Martin Caton | 17,676 | 47.3 | -6.5 | |
| Conservative | John Bushell | 10,281 | 27.5 | +3.7 | |
| Liberal Democrats | Sheila Waye | 4,507 | 12.1 | -0.9 | |
| Plaid Cymru | Sian Caiach | 3,865 | 10.3 | +5.2 | |
| Green | Tina Shrewsbury | 607 | 1.6 | N/A | |
| Socialist Labour | Darran Hickery | 417 | 1.1 | N/A | |
| Majority | 7,395 | 19.8 | |||
| Turnout | 37,353 | 63.4 | -11.7 | ||
| Labour hold | Swing | ||||
Elections in the 1990s
| Party | Candidate | Votes | % | ± | |
|---|---|---|---|---|---|
| Labour | Martin Caton | 23,313 | 53.8 | +3.7 | |
| Conservative | Alun Cairns | 10,306 | 23.8 | −11.3 | |
| Liberal Democrats | Howard W. Evans | 5,624 | 13.0 | +3.0 | |
| Plaid Cymru | D. Elwyn Williams | 2,226 | 5.1 | +1.6 | |
| Referendum | Richard D. Lewis | 1,745 | 4.0 | N/A | |
| Independent | Anthony G. Popham | 122 | 0.3 | N/A | |
| Majority | 13,007 | 30.0 | +15.0 | ||
| Turnout | 43,336 | 75.1 | −11.7 | ||
| Labour hold | Swing | +7.5 | |||
| Party | Candidate | Votes | % | ± | |
|---|---|---|---|---|---|
| Labour | Gareth Wardell | 23,485 | 50.1 | +3.5 | |
| Conservative | Anthony L. Donnelly | 16,437 | 35.1 | +0.6 | |
| Liberal Democrats | Christopher G. Davies | 4,655 | 9.9 | −6.2 | |
| Plaid Cymru | Adam Price | 1,639 | 3.5 | +0.7 | |
| Green | Brian Kingzett | 448 | 1.0 | N/A | |
| Raving Loony Green Giant Party | Gerry P. Egan | 114 | 0.2 | N/A | |
| Natural Law | Michael S. Beresford | 74 | 0.2 | N/A | |
| Majority | 7,048 | 15.0 | +2.9 | ||
| Turnout | 46,852 | 81.9 | +1.2 | ||
| Labour hold | Swing | +1.5 | |||
Elections in the 1980s
| Party | Candidate | Votes | % | ± | |
|---|---|---|---|---|---|
| Labour | Gareth Wardell | 22,139 | 46.6 | +8.5 | |
| Conservative | G A L Price | 16,374 | 34.5 | -0.8 | |
| Social Democratic | D H O Elliott | 7,645 | 16.1 | -7.3 | |
| Plaid Cymru | J G M Edwards | 1,341 | 2.8 | -0.4 | |
| Majority | 5,765 | 12.1 | +9.3 | ||
| Turnout | 47,498 | 80.7 | +2.0 | ||
| Labour hold | Swing | ||||
| Party | Candidate | Votes | % | ± | |
|---|---|---|---|---|---|
| Labour | Gareth Wardell | 16,972 | 38.1 | N/A | |
| Conservative | A R T Kenyon | 15,767 | 35.3 | N/A | |
| Social Democratic | Gwynoro Glyndwr Jones | 10,416 | 23.4 | N/A | |
| Plaid Cymru | N Williams | 1,444 | 3.2 | N/A | |
| Majority | 1,205 | 2.8 | N/A | ||
| Turnout | 44,599 | 78.7 | N/A | ||
| Labour hold | Swing | ||||
| Party | Candidate | Votes | % | ± | |
|---|---|---|---|---|---|
| Labour | Gareth Wardell | 17,095 | 43.5 | -9.8 | |
| Social Democratic | Gwynoro Glyndwr Jones | 9,875 | 25.1 | +16.1 | |
| Conservative | Trefor Llewellyn | 8,690 | 22.1 | -8.4 | |
| Plaid Cymru | Ieuan Owen | 3,431 | 8.7 | +1.6 | |
| Computer Democrat | John Donovan | 125 | 0.3 | N/A | |
| Civil Rights/Welsh Political Prisoner | David Burns | 103 | 0.3 | N/A | |
| Majority | 7,220 | 18.4 | |||
| Turnout | |||||
| Labour hold | Swing | ||||
Elections in the 1970s
| Party | Candidate | Votes | % | ± | |
|---|---|---|---|---|---|
| Labour | Ifor Davies | 24,963 | 53.24 | N/A | |
| Conservative | T Llewellyn | 14,322 | 30.55 | N/A | |
| Liberal | R Blakeborough-Pownal | 4,245 | 9.05 | N/A | |
| Plaid Cymru | E Thomas | 3,357 | 7.16 | N/A | |
| Majority | 10,641 | 22.69 | N/A | ||
| Turnout | 46,887 | 80.8 | N/A | ||
| Labour hold | Swing | ||||
| Party | Candidate | Votes | % | ± | |
|---|---|---|---|---|---|
| Labour | Ifor Davies | 25,067 | 57.29 | ||
| Conservative | DFR George | 8,863 | 20.26 | ||
| Liberal | R Owen | 5,453 | 12.46 | ||
| Plaid Cymru | M Powell | 4,369 | 9.99 | ||
| Majority | 16,204 | 37.04 | |||
| Turnout | 76.94 | ||||
| Labour hold | Swing | ||||
| Party | Candidate | Votes | % | ± | |
|---|---|---|---|---|---|
| Labour | Ifor Davies | 23,856 | 52.88 | ||
| Conservative | DFR George | 8,780 | 19.46 | ||
| Liberal | Richard Clement Charles Thomas | 8,737 | 19.37 | ||
| Plaid Cymru | JN Harris | 3,741 | 8.29 | ||
| Majority | 15,076 | 33.42 | |||
| Turnout | 79.88 | ||||
| Labour hold | Swing | ||||
| Party | Candidate | Votes | % | ± | |
|---|---|---|---|---|---|
| Labour | Ifor Davies | 26,485 | 63.38 | ||
| Conservative | Michael J Carter | 9,435 | 22.58 | ||
| Plaid Cymru | Clifford G Davies | 5,869 | 14.04 | ||
| Majority | 17,050 | 40.80 | |||
| Turnout | 76.94 | ||||
| Labour hold | Swing | ||||
Elections in the 1960s
| Party | Candidate | Votes | % | ± | |
|---|---|---|---|---|---|
| Labour | Ifor Davies | 29,910 | 77.16 | ||
| Conservative | David RO Lewis | 8,852 | 22.84 | ||
| Majority | 21,058 | 54.33 | |||
| Turnout | 77.94 | ||||
| Labour hold | Swing | ||||
| Party | Candidate | Votes | % | ± | |
|---|---|---|---|---|---|
| Labour | Ifor Davies | 27,895 | 71.02 | ||
| Liberal National | J Huw P Griffiths | 8,822 | 22.46 | ||
| Plaid Cymru | John Gwyn Griffiths | 2,562 | 6.52 | ||
| Majority | 19,073 | 48.56 | |||
| Turnout | 79.97 | ||||
| Labour hold | Swing | ||||
Elections in the 1950s
| Party | Candidate | Votes | % | ± | |
|---|---|---|---|---|---|
| Labour | Ifor Davies | 27,441 | 66.89 | ||
| Conservative | Michael Ray Dibdin Heseltine | 9,837 | 23.98 | ||
| Plaid Cymru | John Gwyn Griffiths | 3,744 | 9.13 | ||
| Majority | 17,604 | 42.91 | |||
| Turnout | 82.91 | ||||
| Labour hold | Swing | ||||
| Party | Candidate | Votes | % | ± | |
|---|---|---|---|---|---|
| Labour | David Rhys Grenfell | 26,304 | 68.25 | ||
| National Liberal | B Gwyther Jones | 8,135 | 21.11 | ||
| Plaid Cymru | Edward Christopher Rees | 4,101 | 10.64 | ||
| Majority | 18,169 | 47.14 | |||
| Turnout | 76.78 | ||||
| Labour hold | Swing | ||||
| Party | Candidate | Votes | % | ± | |
|---|---|---|---|---|---|
| Labour | David Rhys Grenfell | 32,661 | 75.93 | ||
| National Liberal | W. Rowe Harding | 10,351 | 24.07 | ||
| Majority | 22,310 | 51.87 | |||
| Turnout | 84.31 | ||||
| Labour hold | Swing | ||||
| Party | Candidate | Votes | % | ± | |
|---|---|---|---|---|---|
| Labour | David Rhys Grenfell | 32,564 | 76.13 | ||
| National Liberal | W. Rowe Harding | 10,208 | 23.87 | ||
| Majority | 22,356 | 52.27 | |||
| Turnout | 84.77 | ||||
| Labour hold | Swing | ||||
Election in the 1940s
| Party | Candidate | Votes | % | ± | |
|---|---|---|---|---|---|
| Labour | David Rhys Grenfell | 30,676 | 68.49 | ||
| Liberal National | John Aeron-Thomas | 14,115 | 31.51 | ||
| Majority | 16,561 | 36.97 | |||
| Turnout | 76.98 | ||||
| Labour hold | Swing | ||||
Elections in the 1930s
| Party | Candidate | Votes | % | ± | |
|---|---|---|---|---|---|
| Labour | David Rhys Grenfell | 25,632 | 66.80 | ||
| Liberal National | GC Hutchinson | 13,239 | 33.20 | ||
| Majority | 13,393 | 33.59 | |||
| Turnout | 76.12 | ||||
| Labour hold | Swing | ||||
| Party | Candidate | Votes | % | ± | |
|---|---|---|---|---|---|
| Labour | David Rhys Grenfell | 21,963 | 53.41 | ||
| Liberal | Sir Edgar Rees Jones | 19,157 | 46.59 | ||
| Majority | 2,806 | 6.82 | |||
| Turnout | 83.52 | ||||
| Labour hold | Swing | ||||
Elections in the 1920s
| Party | Candidate | Votes | % | ± | |
|---|---|---|---|---|---|
| Labour | David Rhys Grenfell | 20,664 | 54.0 | -3.2 | |
| Liberal | Frederick William Davies | 11,055 | 28.9 | n/a | |
| Unionist | Alan Tindal Lennox-Boyd | 6,554 | 17.1 | -25.7 | |
| Majority | 9,609 | 25.1 | +10.7 | ||
| Turnout | 79.6 | +4.1 | |||
| Labour hold | Swing | n/a | |||
| Party | Candidate | Votes | % | ± | |
|---|---|---|---|---|---|
| Labour | David Rhys Grenfell | 15,374 | 57.2 | -1.9 | |
| Unionist | Ernest Thomas Nethercoat | 11,516 | 42.8 | n/a | |
| Majority | 3,858 | 14.4 | -3.8 | ||
| Turnout | 75.5 | +2.5 | |||
| Labour hold | Swing | n/a | |||
| Party | Candidate | Votes | % | ± | |
|---|---|---|---|---|---|
| Labour | David Rhys Grenfell | 14, 771 | 59.1 | +4.9 | |
| Liberal | Mrs Lily Folland | 10,219 | 40.9 | -4.9 | |
| Majority | 4,552 | 18.2 | +9.8 | ||
| Turnout | 73.0 | -1.6 | |||
| Labour hold | Swing | +4.9 | |||
| Party | Candidate | Votes | % | ± | |
|---|---|---|---|---|---|
| Labour | David Rhys Grenfell | 13,388 | 54.2 | -3.3 | |
| Liberal | Frederick William Davies | 11,302 | 45.8 | +3.3 | |
| Majority | 2,086 | 8.4 | -6.6 | ||
| Turnout | 74.6 | +1.6 | |||
| Labour hold | Swing | -3.3 | |||
| Party | Candidate | Votes | % | ± | |
|---|---|---|---|---|---|
| Labour | David Rhys Grenfell | 13,296 | 57.5 | +2.7 | |
| Coalition Liberal | D.H. Williams | 9,841 | 42.5 | -2.7 | |
| Majority | 3,455 | 15.0 | +5.4 | ||
| Turnout | 73.0 | +10.8 | |||
| Labour hold | Swing | +2.7 | |||
Elections in the 1910s
| Party | Candidate | Votes | % | ± | |
|---|---|---|---|---|---|
| Labour | John Williams | 10,109 | 54.8 | ||
| Liberal | D H Williams | 8,353 | 45.2 | ||
| Majority | 1,756 | 9.6 | |||
| Turnout | 62.2 | ||||
| Labour hold | Swing | ||||
General Election 1914/15:
A General Election was required to take place before the end of 1915. The political parties had been making preparations for an election to take place and by the July 1914, the following candidates had been selected;
- Labour:John Williams
- Liberal:
- Unionist: Peter D Thomas[18]
| Party | Candidate | Votes | % | ± | |
|---|---|---|---|---|---|
| Labour | John Williams | 5,480 | |||
| Liberal | WF Phillips | 4,527 | |||
| Majority | |||||
| Turnout | |||||
| Labour hold | Swing | ||||
| Party | Candidate | Votes | % | ± | |
|---|---|---|---|---|---|
| Labour | John Williams | 9,312 | |||
| Conservative | Percy Reginald Owen Abel Simner | 2,532 | |||
| Majority | |||||
| Turnout | |||||
| Labour gain from Liberal | Swing | ||||
Elections in the 1900s
| Party | Candidate | Votes | % | ± | |
|---|---|---|---|---|---|
| Lib-Lab | John Williams | 4,841 | 42.8 | n/a | |
| Liberal | Thomas Jeremiah Williams | 4,522 | 40.0 | -12.6 | |
| Conservative | Ernest Helme | 1,939 | 17.2 | n/a | |
| Majority | 319 | ||||
| Turnout | 83.0 | +16.7 | |||
| Lib-Lab gain from Liberal | Swing | ||||

| Party | Candidate | Votes | % | ± | |
|---|---|---|---|---|---|
| Liberal | John Aeron Thomas | 4,276 | 52.6 | ||
| Independent Labour | John Hodge | 3,853 | 47.4 | ||
| Majority | 423 | 5.2 | |||
| Turnout | 66.3 | ||||
| Liberal hold | Swing | ||||
Elections in the 1890s
| Party | Candidate | Votes | % | ± | |
|---|---|---|---|---|---|
| Liberal | David Randell | 6,074 | |||
| Liberal Unionist | Charles Henry Glascodyne | 2,256 | |||
| Majority | 3,818 | ||||
| Turnout | |||||
| Liberal hold | Swing | ||||
| Party | Candidate | Votes | % | ± | |
|---|---|---|---|---|---|
| Liberal | David Randell | unopposed | n/a | n/a | |
| Liberal hold | Swing | n/a | |||
Elections in the 1880s
| Party | Candidate | Votes | % | ± | |
|---|---|---|---|---|---|
| Liberal | David Randell | 3,964 | 54.1 | n/a | |
| Conservative | John Talbot Dillwyn-Llewelyn | 3,358 | 45.9 | n/a | |
| Majority | 606 | 8.2 | n/a | ||
| Turnout | n/a | ||||
| Liberal hold | Swing | n/a | |||
| Party | Candidate | Votes | % | ± | |
|---|---|---|---|---|---|
| Liberal | Frank Ash Yeo | unopposed | n/a | n/a | |
| Liberal hold | Swing | n/a | |||

| Party | Candidate | Votes | % | ± | |
|---|---|---|---|---|---|
| Liberal | Frank Ash Yeo | 5,560 | 72.6 | n/a | |
| Conservative | Henry Nathaniel Miers | 2,103 | 27.4 | n/a | |
| Majority | 3,457 | 45.2 | n/a | ||
| Turnout | 72.6 | n/a | |||
| Liberal win (new seat) | |||||
See also
- A map of Glamorganshire in 1885, showing its new divisions.
- Gower (Assembly constituency)
- List of Parliamentary constituencies in West Glamorgan
Notes and references
- ↑ "Beyond 20/20 WDS - Table view". 2011 Electorate Figures. StatsWales. 1 December 2010. Retrieved 13 March 2011.
- 1 2 Morgan (1960). Morgannwg: 9. Missing or empty
|title=(help) - ↑ Rees (2004). Gwent Local History: 60–1. Missing or empty
|title=(help) - ↑ Leigh Rayment's Historical List of MPs – Constituencies beginning with "G" (part 2)
- ↑ "Election Data 2015". Electoral Calculus. Archived from the original on 17 October 2015. Retrieved 17 October 2015.
- ↑ "Swansea results". Results - UK Parliamentary general election 2015. City and County of Swansea. Retrieved 21 September 2015.
- ↑ "Election Data 2010". Electoral Calculus. Archived from the original on 17 October 2015. Retrieved 17 October 2015.
- ↑ Gower BBC Election - Gower
- ↑ "Election Data 2005". Electoral Calculus. Archived from the original on 15 October 2011. Retrieved 18 October 2015.
- ↑ "Election Data 2001". Electoral Calculus. Archived from the original on 15 October 2011. Retrieved 18 October 2015.
- ↑ "Election Data 1997". Electoral Calculus. Archived from the original on 15 October 2011. Retrieved 18 October 2015.
- ↑ "Election Data 1992". Electoral Calculus. Archived from the original on 15 October 2011. Retrieved 18 October 2015.
- ↑ "Politics Resources". Election 1992. Politics Resources. 9 April 1992. Retrieved 2010-12-06.
- ↑ "Election Data 1987". Electoral Calculus. Archived from the original on 15 October 2011. Retrieved 18 October 2015.
- ↑ "Election Data 1983". Electoral Calculus. Archived from the original on 15 October 2011. Retrieved 18 October 2015.
- ↑ Etholiadau'r ganrif 1885-1997, Beti Jones
- 1 2 3 4 5 6 7 8 British Parliamentary Election Results 1918-1949, FWS Craig
- ↑ Yorkshire Evening Post 2 May 1914
- ↑ Debrett's House of Commons & Judicial Bench, 1916
- ↑ Debrett's House of Commons & Judicial Bench, 1916
- 1 2 3 4 5 6 7 The Liberal Year Book, 1907
- ↑ Debrett's House of Commons & Judicial Bench, 1901
- ↑ Debrett's House of Commons & Judicial Bench, 1901
- ↑ Debrett's House of Commons & Judicial Bench, 1886
Sources
Books and Journals
- Morgan, Kenneth O. (1960). "Democratic Politics in Glamorgan, 1884-1914". Morgannwg. 4: 5–27.
- Morgan, Kenneth O (1991). Wales in British Politics 1868–1922 (3rd ed.). Cardiff: University of Wales Press. ISBN 0708311245.
- Rees, Ivor Thomas (Autumn 2004). "Whatever happened to young William?". Gwent Local History. 97: 58–66.
| Parliament of the United Kingdom | ||
|---|---|---|
| Preceded by North Antrim |
Constituency represented by the Father of the House 1952–1959 |
Succeeded by Woodford |